By the National Forum on Education Statistics’ Data Visualization Working Group
Every day, 2.5 quintillion—that’s 17 more zeroes—bytes of data are uploaded to the Internet (IBM 2016).[i] How can people be expected to discern meaning when the volume of available data continues to grow at such a pace? The short answer is that they can’t—someone needs to highlight the most relevant “take-home” message in the data or no one will see it, understand it, or use it to make decisions.
Anyone who works in the field of education knows this reality. Federal, state, and local agency staff often struggle to effectively present data to stakeholders in an accessible, accurate, and actionable manner. Although data visualization websites and textbooks are readily available, they are often written for specialists in information architecture or graphic designers. Fortunately, the National Forum on Education Statistics (Forum) has produced the new Forum Guide to Data Visualization: A Resource for Education Agencies, which is customized to meet the specific visualization needs of the education data and research communities. The intended audience is professionals who interpret and communicate data meaning for a wide range of education stakeholders, including practitioners, policymakers, researchers, parents, and the general public.
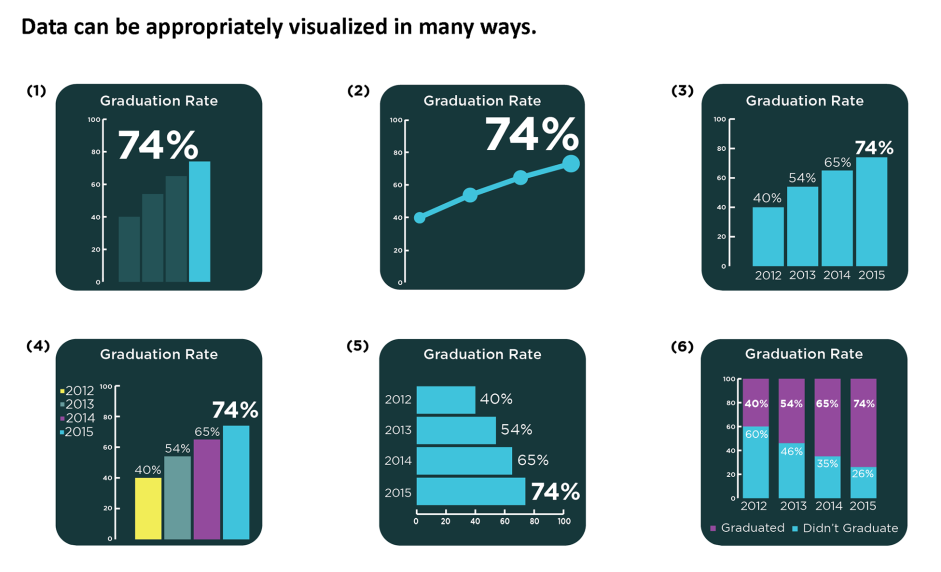
Building off of expertise in the field of data visualization, the guide presents a host of practices that support four overarching “take-home” principles for data visualization:
- Show the data;
- Reduce the clutter;
- Integrate text and images; and
- Portray data meaning accurately and ethically.
Other practical recommendations include:
- Capitalize on consistency—establish and adhere to common conventions;
- Avoid presenting figures side by side if the data are not intended to be compared;
- Consider your design choices beyond default graphing programs;
- Focus on the take-home message for the target audience;
- Minimize the use of jargon, acronyms, and technical terms;
- Choose a font that is easy to read and will reproduce well; and
- Recognize the importance of color and the benefits of Section 508 Compliance.
Because communicating data effectively is a priority in education agencies, the document also explains how the data visualization process can be implemented throughout an organization. In this way, effective visual communication might become the norm rather than exception in our agencies. Visit the Forum’s website for more information about this guide, the Forum, and other free resources for the education data community.
About the National Forum on Education Statistics
The work of the National Forum on Education Statistics is a key aspect of the National Cooperative Education Statistics System. The Cooperative System was established to produce and maintain, with the cooperation of the states, comparable and uniform education information and data that are useful for policymaking at the federal, state, and local levels. To assist in meeting this goal, the National Center for Education Statistics (NCES), within the Institute of Education Sciences (IES) of the U.S. Department of Education, established the Forum to improve the collection, reporting, and use of elementary and secondary education statistics.
The information and opinions published in Forum products do not necessarily represent the policies or views of the U.S. Department of Education, IES, or NCES. For more information about the Forum, please contact Ghedam Bairu