By Lauren Musu-Gillette and Tom Snyder
Situating educational and economic outcomes in the United States within a global context can help researchers, policy makers, and the public understand how individuals in the U.S. compare to their peers internationally. The annual publication Education at a Glance produced by the Organisation for Economic Co-operation and Development (OECD) provides information on the state of education in many countries across the world. While these data are instrumental in helping us to understand how the U.S. compares to other OECD and partner countries on a number of key educational and economic outcomes, national averages can mask the high degree of variation that can occur within individual countries. In order to address this, several OECD and partner countries, including the U.S., provided sub-national data on several select indicators previously only available at the country level.
These data, posted on the NCES website, serve as a supplement to Education at a Glance 2015 and provide select sub-national data for six indicators in this edition. These include data on educational attainment by selected age groups, employment rates by educational attainment, annual expenditure per student, enrollment rates by age, enrollment rates in early childhood and primary education, and enrollment rates and work status of 15-29 year-olds.
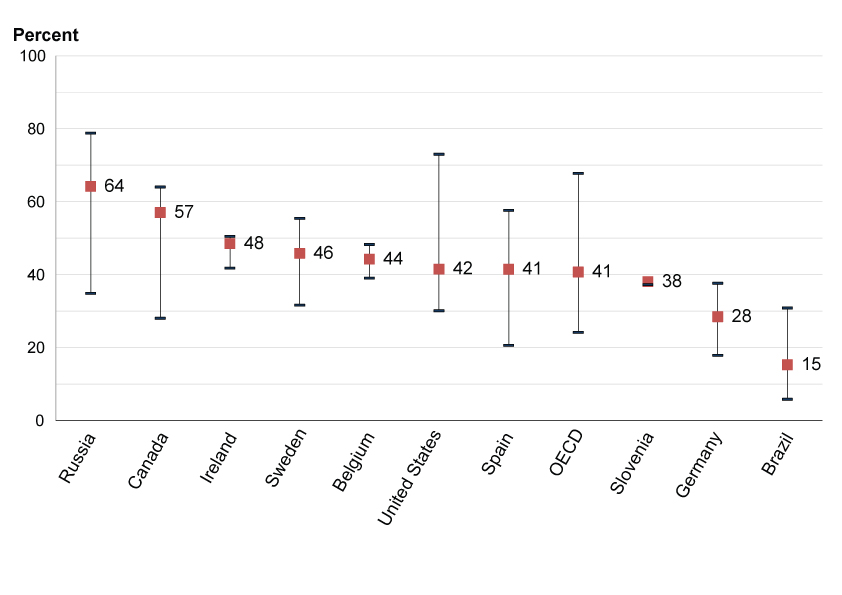
In order to understand the amount of variability in an indicator for a particular country, we can compute a ratio of the state, territory, or region with the highest percentage to that with the lowest percentage on any given metric. For example, within the United States, the percentage of 25- to 34-year-olds who completed any level of postsecondary education in 2013 ranged among the states from 30 percent in Nevada to 55 percent in Massachusetts.
The ratio of high to low percentages of 25- to 34-year-olds completing postsecondary education in the United States (2.4) was among the largest of the reporting countries. The ratio was higher in Brazil (5.8) with a range of 6 to 31 percent, and in Spain (2.8), with a range from 21 to 58 percent. The U.S. ratio was slightly higher than in Canada and Russia (both 2.3). The ratio was lower in Sweden (1.8) and lowest in Slovenia (1.0), Ireland (1.2), and Belgium (1.2). The high to low ratio between OECD countries was 2.8, ranging from a low of 24 percent to a high of 68 percent.
Average percentage of the 25-34 year old population with postsecondary education (with subnational high/low value) in selected OECD and partner countries: 2014
NOTE: Countries are ranked in ascending order of the average percentage of the 25-34 year old population with postsecondary education. Data years differ. Data for Canada is from 2012, while data for the United States and Brazil is from 2013. Data for all other countries is from 2014.
SOURCE: OECD. Table A1.3a. See Annex 3 for notes and sub-national Summary Table A1.3a.
Regional policy makers can benefit most from the comparisons presented in Education at a Glance when they can compare the results from their own sub-national areas with national and sub-national data from other countries. It is not surprising that large federal countries, such as Canada, Germany, and the United States, in which education is largely controlled by regional authorities, might have large internal variations. But, many other countries with centralized education systems such as Spain and Sweden have substantial variations within their countries as well. These new sub-national data can help illuminate these differences and provide additional information to U.S. states on how they compare to their peers both within the U.S. and internationally.