Across the United States, parents have an increasing number of educational options for their children, including traditional public schools, public charter schools, private schools, and homeschooling. Although the majority of students attend traditional public schools, the numbers of students attending public charter schools or homeschool programs are growing, according to recently released data.
Using survey data from the National Center for Education Statistics (NCES), the newly released School Choice in the United States: 2019 report provides information on student enrollment; individual, family, and school characteristics of students enrolled in different educational settings; achievement; school crime and safety; and differences in the school choice options that parents select and their satisfaction with their children’s school.
School Enrollment Trends
Over time, the numbers of students enrolled in traditional public schools, public charter schools, and homeschool programs have increased (see figure 1). Enrollment in traditional public schools was 1 percent higher in fall 2016 (47.3 million) than in fall 2000 (46.6 million).
Public charter schools grew at a much more rapid rate in that time, with enrollment increasing by more than 500 percent, from 0.4 million in fall 2000 to 3.0 million in fall 2016. Enrollment in homeschool programs has also grown, nearly doubling from 1999 (0.9 million) to 2016 (1.7 million). However, private school enrollment fell 4 percent between fall 1999 and fall 2015.
Figure 1. Enrollment in traditional public schools, public charter schools, private schools, and homeschooling
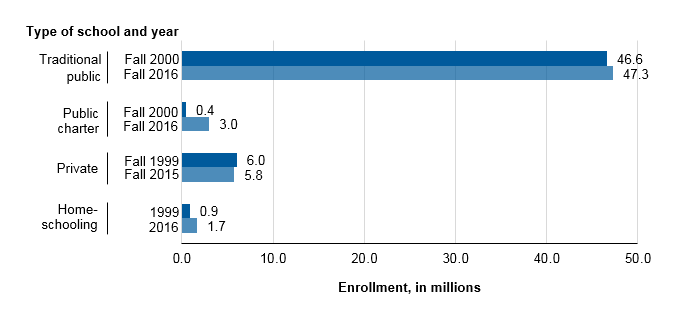
SOURCE: U.S. Department of Education, National Center for Education Statistics, Common Core of Data (CCD), “Public Elementary/Secondary School Universe Survey,” 2000–01 and 2016–17; Private School Universe Survey (PSS), 1999–2000 and 2015–16; Parent Survey and Parent and Family Involvement in Education Survey of the National Household Education Surveys Program (Parent-NHES:1999 and PFI-NHES:2016).
Student and School Characteristics
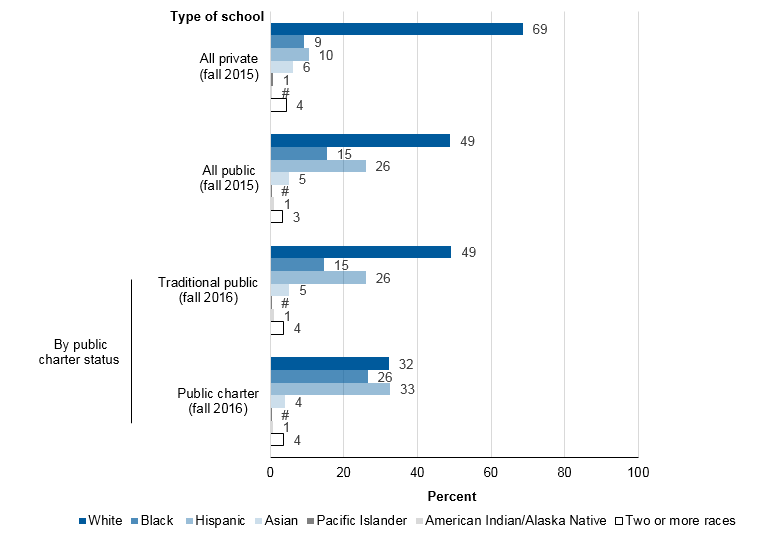
This report also explores enrollment in different school options across a range of characteristics, including students’ racial/ethnic background (see figure 2), family composition, household poverty status, parent education and employment, and more.
For example, public schools enrolled higher percentages of Black and Hispanic students than did private schools in fall 2015. Within the public school sector, public charter schools enrolled higher percentages of Black and Hispanic students and lower percentages of White and Asian/Pacific Islander students than did traditional public schools in fall 2016. And, the percentages of students who were homeschooled in 2016 were higher for White and Hispanic students than for Black and Asian students.
Figure 2. Percentage distribution of elementary and secondary enrollment, by school type and student race/ethnicity: 2015 and 2016
#Rounds to zero.
NOTE: Figure excludes homeschooled children. Race categories exclude persons of Hispanic ethnicity. Although rounded numbers are displayed, the figures are based on unrounded data. Detail may not sum to totals because of rounding.
SOURCE: U.S. Department of Education, National Center for Education Statistics, Private School Universe Survey (PSS), 2015–16; and Common Core of Data (CCD), "Public Elementary/Secondary School Universe Survey," 2016–17.
In 2016, about 58 percent of public charter school students were enrolled in schools in cities, compared with 29 percent of traditional public school students; traditional public school students were more likely than public charter school students to attend schools in suburban areas, towns, and rural areas.
In 2015, about 43 percent of private school students were enrolled in schools in cities, and 40 percent were enrolled in schools in suburban areas. However, homeschooling in 2016 was more prevalent among students in rural areas than among those in cities and suburban areas.
Parental Choice
In 2016, parents whose children were enrolled in public or private schools were asked about their decisions regarding school choice. Twenty-eight percent of students had parents who reported that they had considered schools other than the one in which their children were currently enrolled, and 80 percent had parents who reported that their children’s current school was their first choice. Among public school students, 20 percent had parents who reported they moved to their current neighborhood so their children could attend their current public school.
Each of these percentages was higher for students from nonpoor households than for students from near-poor or poor households (see figure 3). For example, 31 percent of students in nonpoor households had parents who reported that they considered other schools for their children, compared with 23 percent of students in near-poor households and 21 percent of students in poor households.
Figure 3. Percentage of students enrolled in grades 1 through 12 whose parents considered other schools, reported current school was their first choice, or moved to their current neighborhood for the public school, by family poverty status: 2016
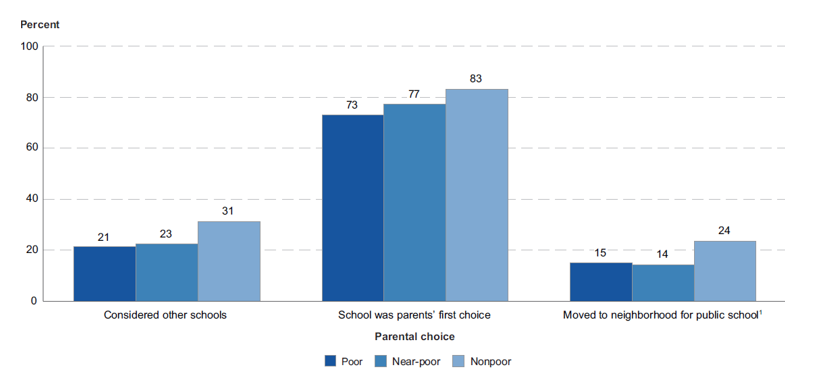
1 Includes public school students only. Private school students are excluded.
NOTE: Data exclude homeschooled children.
SOURCE: U.S. Department of Education, National Center for Education Statistics, Parent and Family Involvement Survey of the National Household Education Surveys Program (PFI-NCES:2016).
Browse the full School Choice in the United States: 2019 report to learn more about these and other trends related to school choice and student enrollment.
By Amy Rathbun and Ke Wang, AIR