The school-age population in the United States is becoming more racially and ethnically diverse. An NCES report released in February 2019, Status and Trends in the Education of Racial and Ethnic Groups 2018, examines how education experiences and outcomes vary among racial/ethnic groups. The report contains 36 indicators that cover preprimary to postsecondary education, as well as family background characteristics and labor force outcomes.
Between 2000 and 2017, the percentage of 5- to 17-year-olds who were White decreased from 62 to 51 percent, while the percentage who were Hispanic increased from 16 to 25 percent.
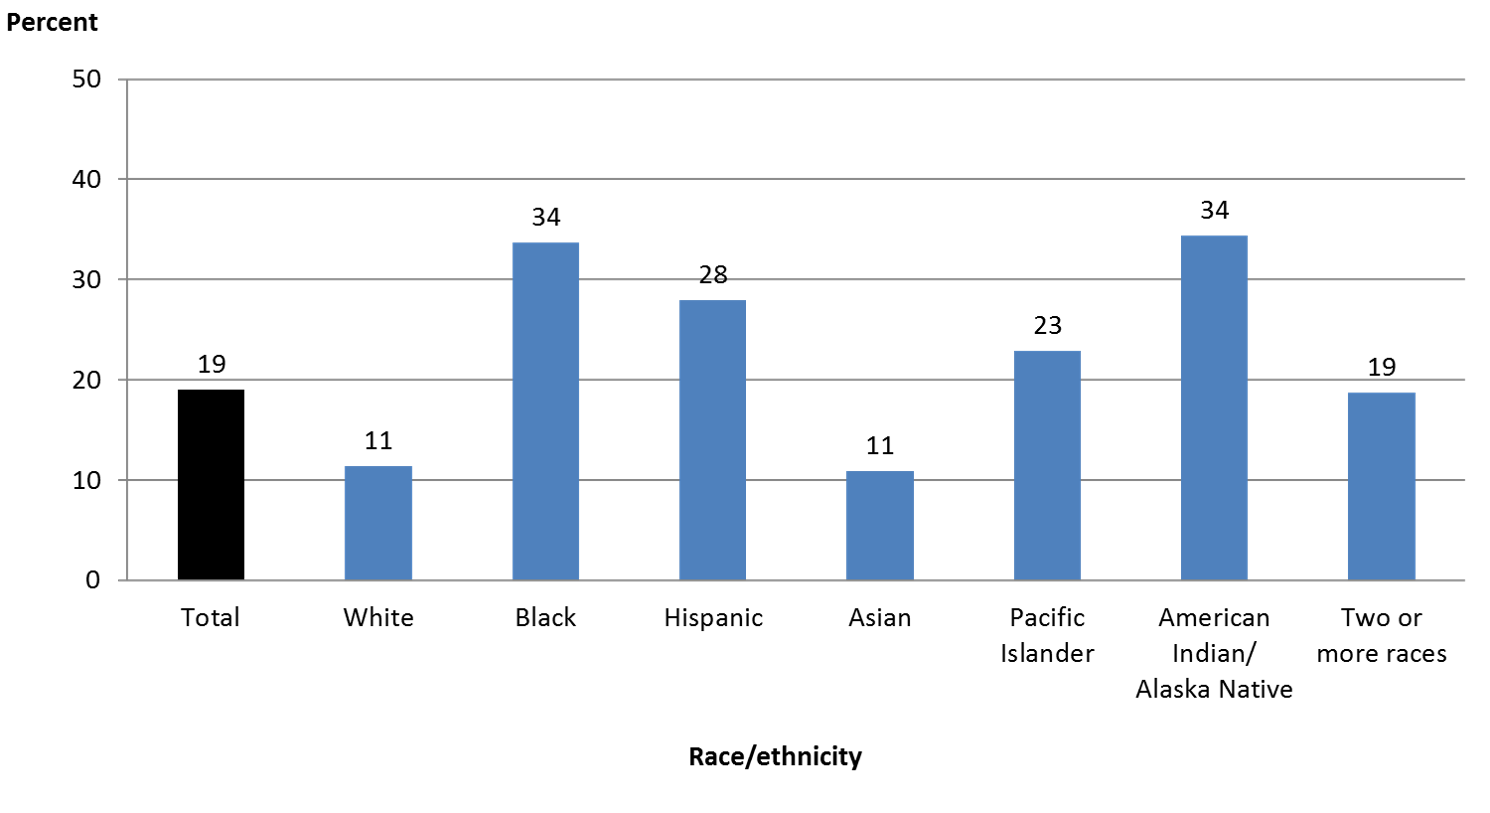
Prior research shows that living in poverty during early childhood is associated with lower-than-average academic performance that begins in kindergarten[1] and extends through high school, leading to lower-than-average rates of school completion.[2] In 2016, the percentages of children living in poverty were highest for Black and American Indian/Alaska Native children and lowest for White and Asian children.
Figure 2. Percentage of children under age 18 living in poverty, by race/ethnicity: 2016
 NOTE: Data shown are based only on related children in a family; that is, all children in the household who are related to the householder by birth, marriage, or adoption (except a child who is the spouse of the householder).
SOURCE: U.S. Department of Commerce, Census Bureau, American Community Survey (ACS), 2016. See Digest of Education Statistics 2017, table 102.60.
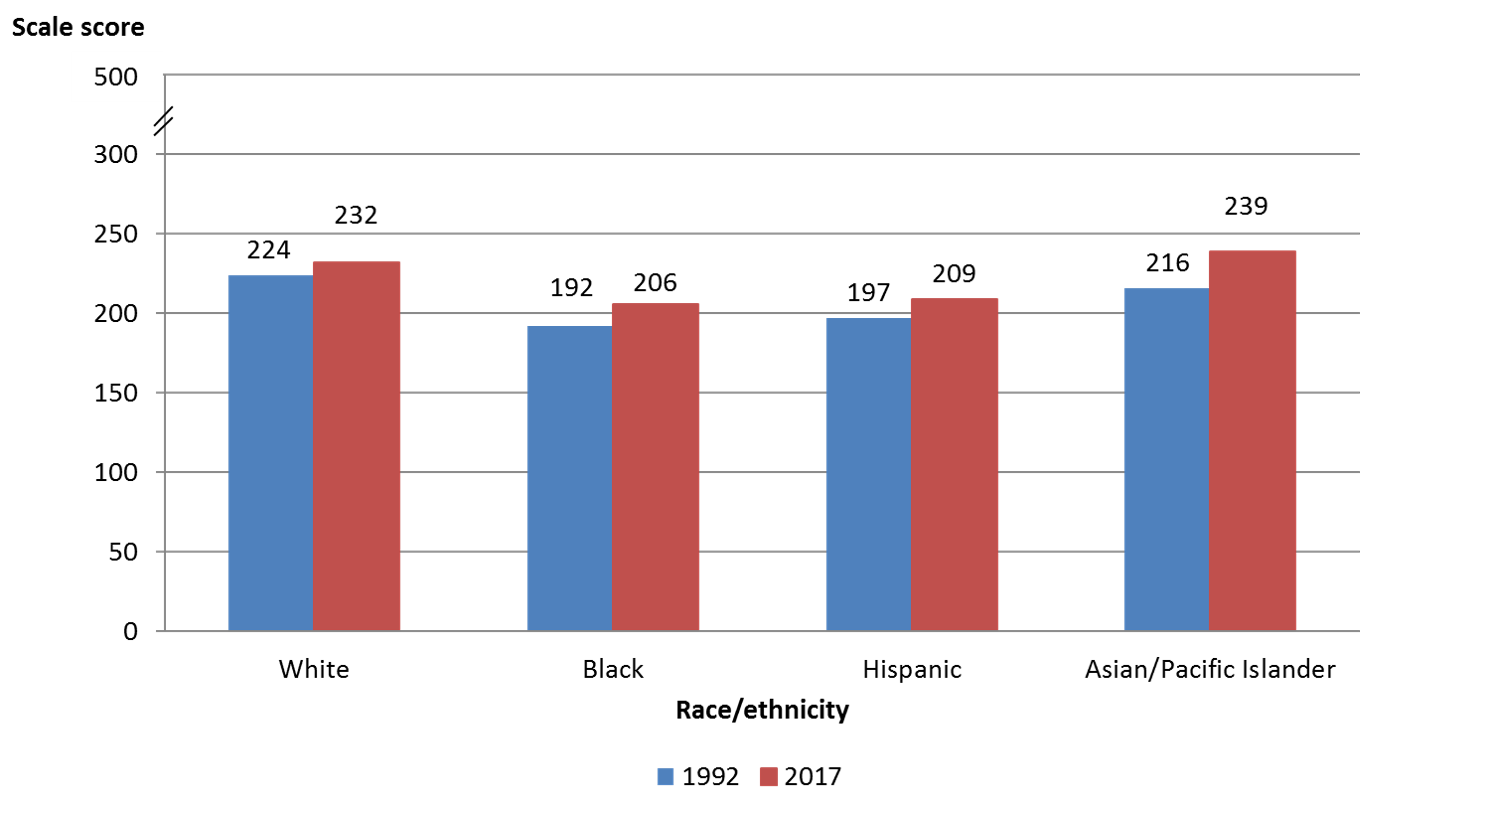
The National Assessment of Educational Progress (NAEP)—given to a representative sample of students across the United States—measures student performance over time in various subjects (including reading, math, and science) at grades 4, 8, and 12. Average grade 4 reading scores were higher in 2017 than in 1992 for the racial/ethnic groups with available data. Between 1992 and 2017, the White-Black score gap narrowed from 32 points in 1992 to 26 points in 2017. However, the White-Hispanic gap in 2017 was not measurably different from the corresponding gap in 1992.
Figure 3. Average National Assessment of Educational Progress (NAEP) reading scale scores of grade 4 students, by selected race/ethnicity: 1992 and 2017
 NOTE: Includes public and private schools. Testing accommodations (e.g., extended time, small group testing) for children with disabilities and English language learners were not permitted in 1992.
SOURCE: U.S. Department of Education, National Center for Education Statistics, National Assessment of Educational Progress (NAEP), 1992 and 2017 Reading Assessments, NAEP Data Explorer. See Digest of Education Statistics 2017, table 221.10.
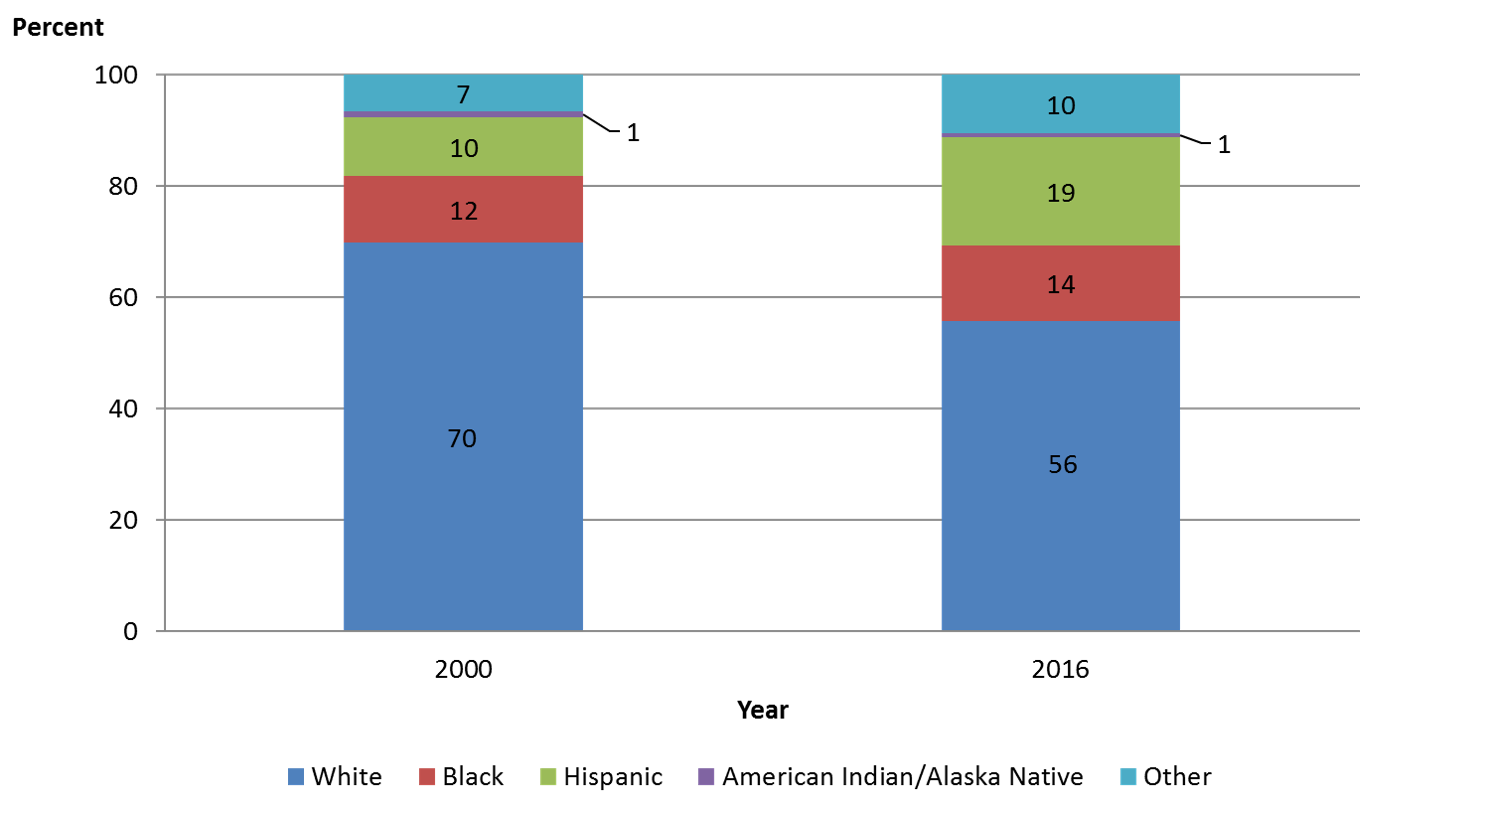
Looking at higher education, between 2000 and 2016, the largest changes in the racial/ethnic composition of undergraduate students were for White students and Hispanic students. The share of undergraduates who were White decreased from 70 to 56 percent, and the share who were Hispanic increased from 10 to 19 percent.
Figure 4. Percentage of total undergraduate student enrollment in degree-granting institutions, by race/ethnicity: Fall 2000 and fall 2016
 NOTE: Other includes Asian students, Pacific Islander students, and students of Two or more races.
SOURCE: U.S. Department of Education, National Center for Education Statistics, Integrated Postsecondary Education Data System (IPEDS), Spring 2001 and Spring 2017, Fall Enrollment component. See Digest of Education Statistics 2017, table 306.10.
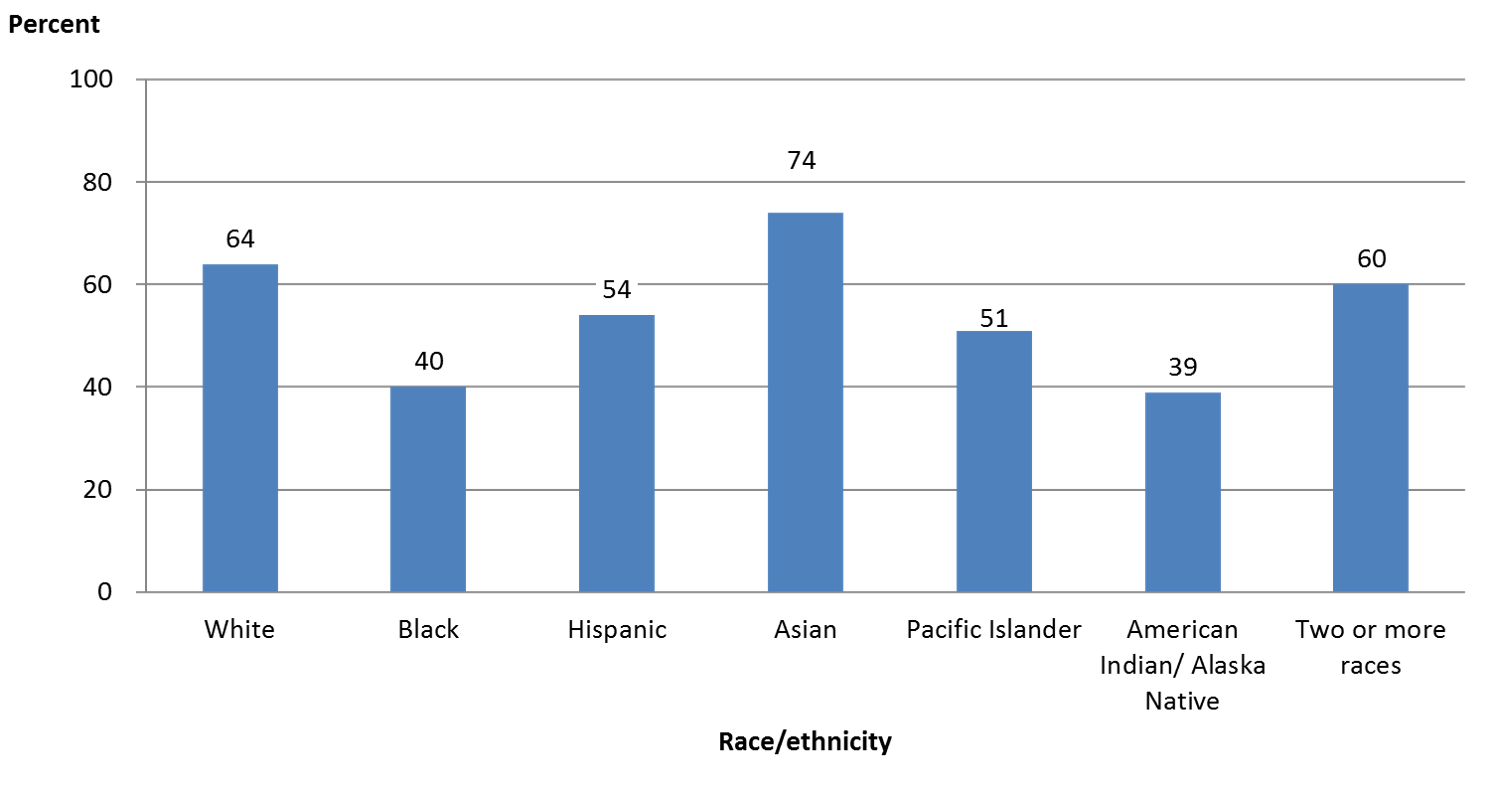
Postsecondary graduation rates vary widely by racial/ethnic group. For instance, among first-time students at 4-year institutions who enrolled in 2010, 74 percent of Asian students had graduated within 6 years. This was approximately 35 percentage points higher than the graduation rates for American Indian/Alaska Native students and Black students.
Figure 5: Graduation rates within 6 years from first institution attended for first-time, full-time bachelor's degree-seeking students at 4-year postsecondary institutions, by race/ethnicity: Cohort entry year 2010
 SOURCE: U.S. Department of Education, National Center for Education Statistics, Integrated Postsecondary Education Data System (IPEDS), Winter 2016–17, Graduation Rates component. See Digest of Education Statistics 2017, table 326.10.
The report also includes a new spotlight indicator, which highlights institutions that serve a large number of students from minority racial and ethnic groups. For instance, historically Black colleges and universities (HBCUs) are defined as “any historically Black college or university that was established prior to 1964, whose principal mission was, and is, the education of Black Americans.” In fall 2016, there were 102 HBCUs that enrolled over 292,000 students, 77 percent of whom were Black.
.png)
The spotlight also highlights other groups of minority-serving institutions—Hispanic-serving institutions, Tribally controlled colleges and universities, and Asian American and Native American Pacific Islander-serving institutions—describes how an institution is recognized as belonging to one of these groups, and discusses other institution characteristics, such as enrollment and degrees conferred.
For more information, visit the report’s website, where you can browse the indicators or download the full report.
By Cris de Brey
[1] Mulligan, G.M., Hastedt, S., and McCarroll, J.C. (2012). First-Time Kindergartners in 2010–11: First Findings From the Kindergarten Rounds of the Early Childhood Longitudinal Study, Kindergarten Class of 2010–11 (ECLS-K:2011) (NCES 2012-049). U.S. Department of Education. Washington, DC: National Center for Education Statistics. Retrieved from https://nces.ed.gov/pubsearch/pubsinfo.asp?pubid=2012049.
[2] Ross, T., Kena, G., Rathbun, A., KewalRamani, A., Zhang, J., Kristapovich, P., and Manning, E. (2012). Higher Education: Gaps in Access and Persistence Study (NCES 2012-046). U.S. Department of Education. Washington, DC: National Center for Education Statistics. Retrieved from https://nces.ed.gov/pubsearch/pubsinfo.asp?pubid=2012046.