As the school year comes to a close, many families are considering opportunities to continue learning over the summer months. Summer learning has often been seen as a way to supplement instruction during the regular school year. The U.S. Department of Education’s “COVID-19 Handbook” notes that summer learning “can offer another opportunity to accelerate learning, especially for those students most impacted by disruptions to learning during the school year.” Data from the Household Pulse Survey (HPS), which NCES developed in partnership with the U.S. Census Bureau and other federal statistical agencies, explores access to summer learning opportunities by school type, racial/ethnic group, household educational attainment level, and income level.
Among adults with children enrolled in public or private school or homeschooled, 26 percent reported children were enrolled in any summer education activities after the end of the normal school year in spring of 2021 (figure 1). The most reported summer education activity was attending a summer school program to catch up on lost learning time during the pandemic (10 percent). Eight percent reported children attended school-led summer camps for subjects like math, science, or reading and 7 percent each reported children attended a traditional summer school program because of poor grades or worked with private tutors to catch up with lost learning time during the pandemic.
1 Does not equal the total of the subcategories because respondents could report multiple types of summer education activities.
NOTE: Data in this figure are considered experimental and do not meet NCES standards for response rates. The 2021 Household Pulse Survey, an experimental data product, is an Interagency Federal Statistical Rapid Response Survey to Measure Household Experiences during the coronavirus pandemic, conducted by the U.S. Census Bureau in partnership with 16 other federal agencies and offices. The number of respondents and response rate for the period reported in this table were 59,833 and 5.6 percent. The final weights are designed to produce estimates for the total persons age 18 and older living within housing units. These weights were created by adjusting the household level sampling base weights by various factors to account for nonresponse, adults per household, and coverage. For more information, see https://www.census.gov/programs-surveys/household-pulse-survey/technical-documentation.html. Although rounded numbers are displayed, the figures are based on unrounded data.
SOURCE: U.S. Department of Commerce, Census Bureau, Household Pulse Survey, September 15 to 27, 2021. See Digest of Education Statistics 2021, table 227.60.
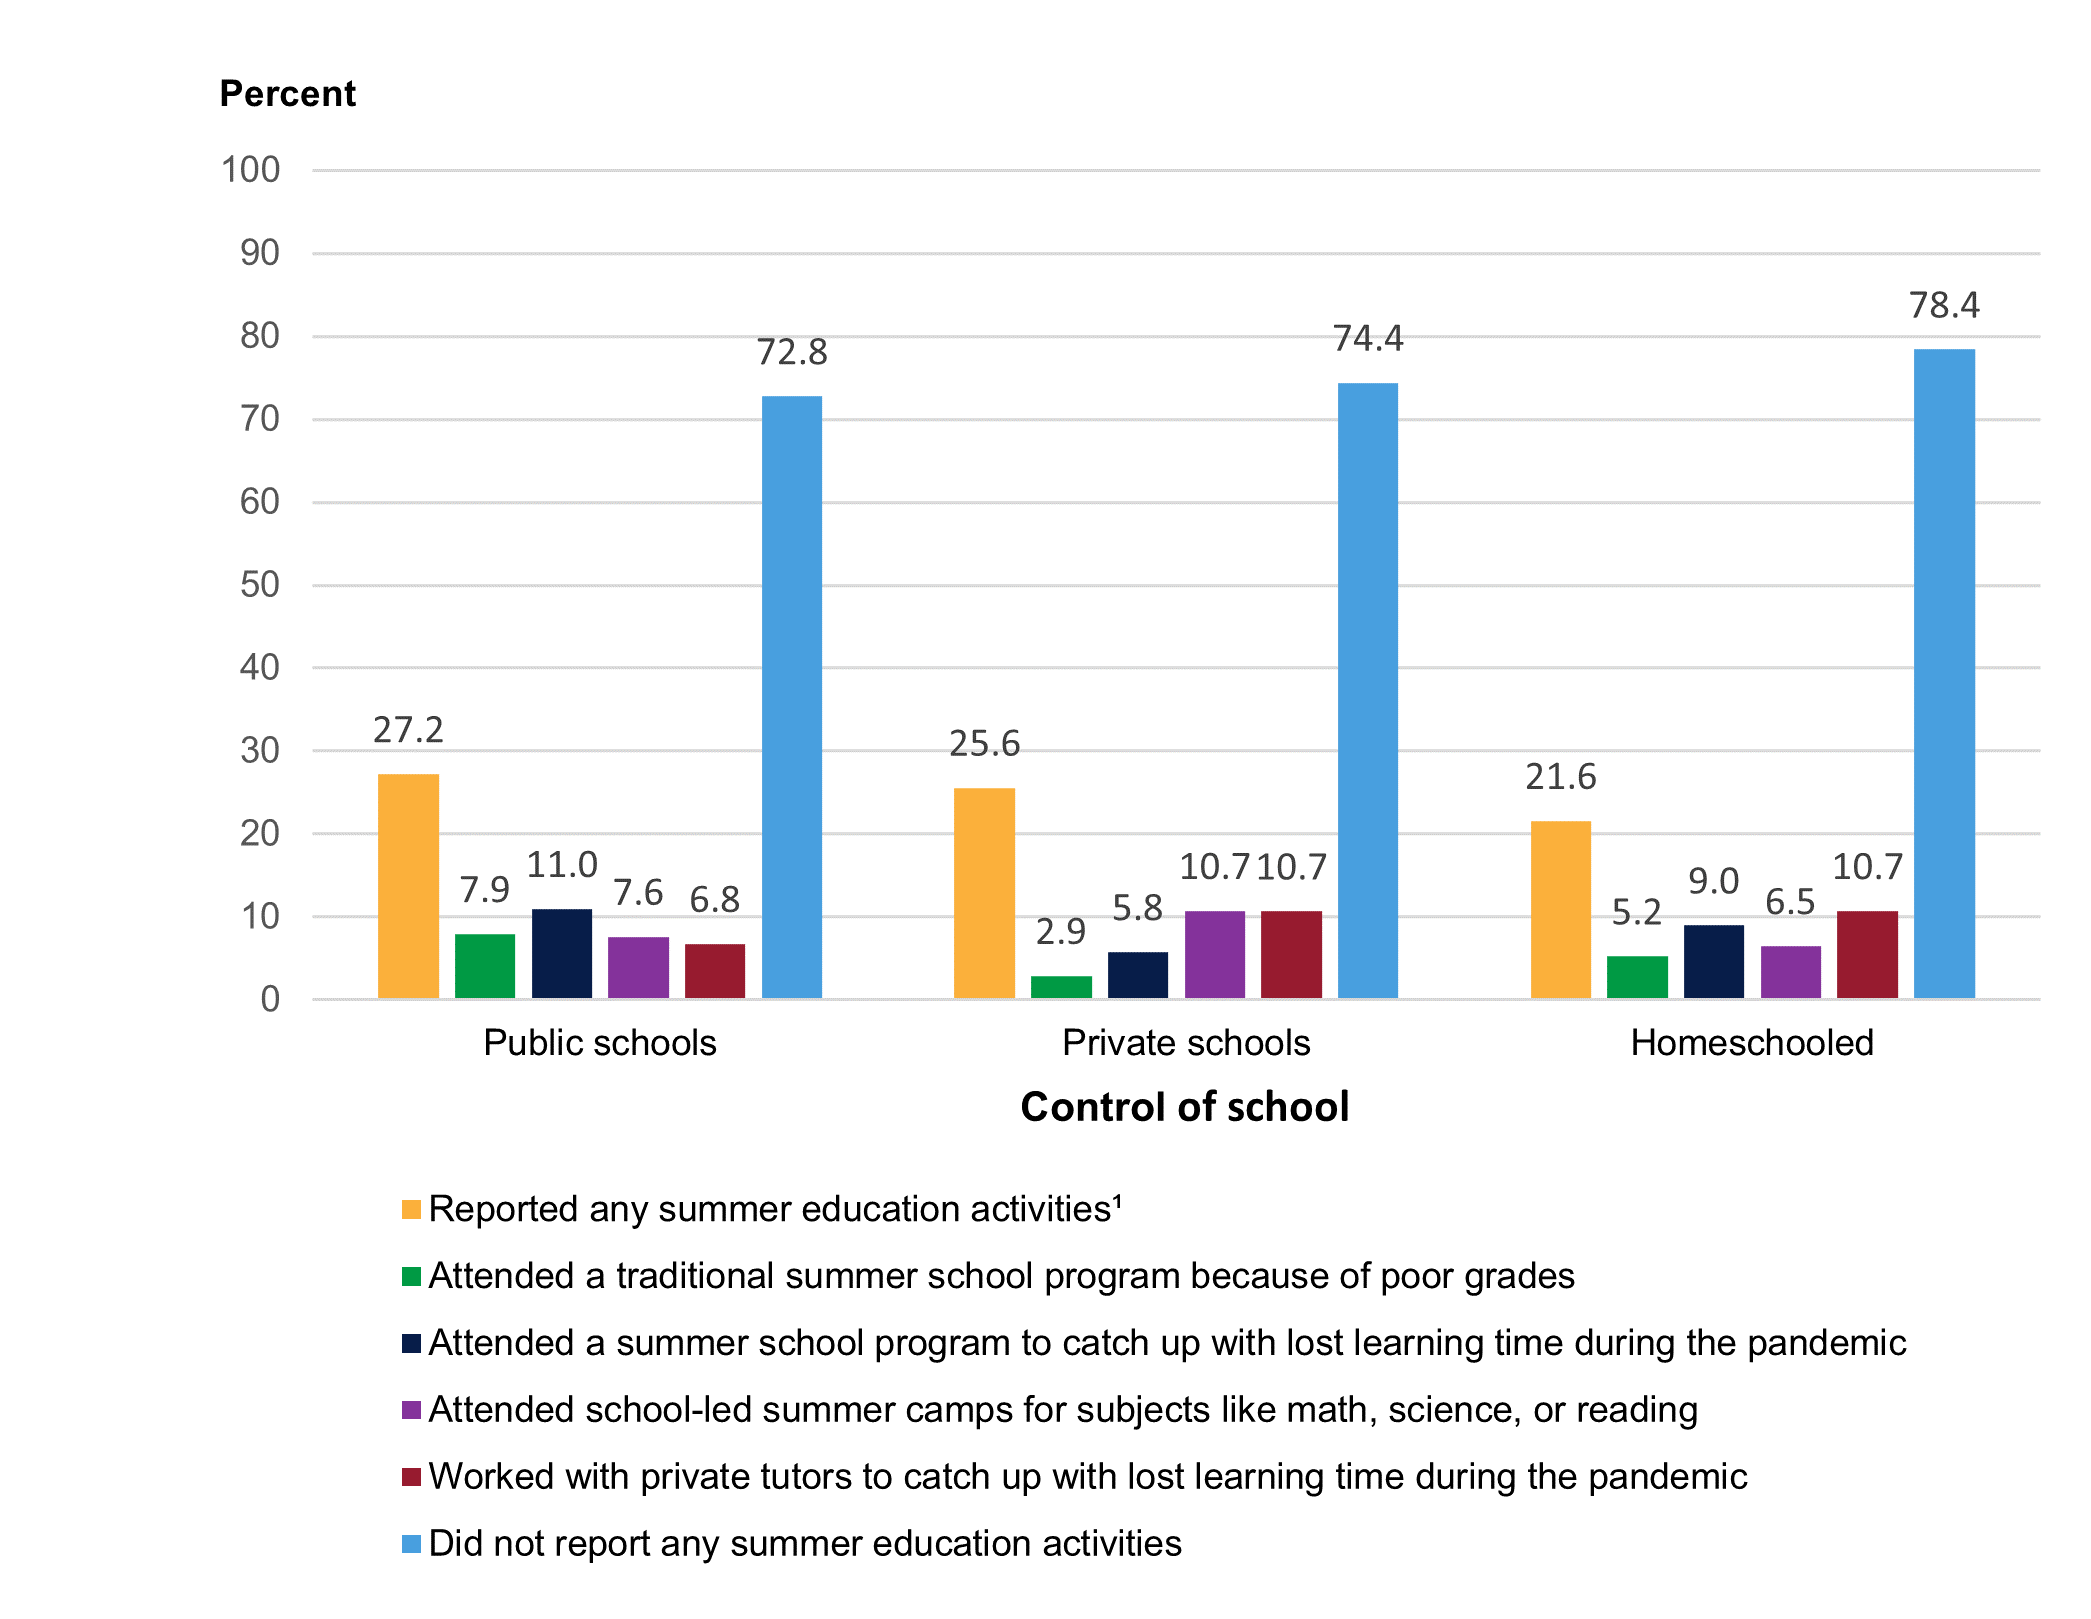
There were no significant differences in the overall percentage of adults reporting any summer education activities for their children by school type (public school, private school, or homeschooled). However, there were differences in the most common type of summer education activity reported for those with children in public school versus private school. Among adults with children in public school, the most reported summer activity was attending a summer school program to catch up with lost learning during the pandemic (11 percent) (figure 2). Among adults with children in private school, higher percentages reported children attended school-led summer camps for subjects like math, science, or reading or worked with private tutors to catch up with lost learning time during the pandemic (11 percent, each), compared with the percentage who reported children attended a traditional summer school program because of poor grades (3 percent). There were no significant differences among adults with homeschooled children by type of summer education activity.
Figure 2. Among adults 18 years old and over who had children under age 18 in the home enrolled in school, percentage reporting participation in summer education activities after the end of the normal school year in spring of 2021, by control of school and type of summer activity: September 15 to 27, 2021

NOTE: Figure excludes percentage of adults reporting any summer education activities for their children or that their children did not participate in any summer activities. Data in this figure are considered experimental and do not meet NCES standards for response rates. The 2021 Household Pulse Survey, an experimental data product, is an Interagency Federal Statistical Rapid Response Survey to Measure Household Experiences during the coronavirus pandemic, conducted by the U.S. Census Bureau in partnership with 16 other federal agencies and offices. The number of respondents and response rate for the period reported in this table were 59,833 and 5.6 percent. The final weights are designed to produce estimates for the total persons age 18 and older living within housing units. These weights were created by adjusting the household level sampling base weights by various factors to account for nonresponse, adults per household, and coverage. For more information, see https://www.census.gov/programs-surveys/household-pulse-survey/technical-documentation.html. Although rounded numbers are displayed, the figures are based on unrounded data.
SOURCE: U.S. Department of Commerce, Census Bureau, Household Pulse Survey, September 15 to 27, 2021. See Digest of Education Statistics 2021, table 227.60.
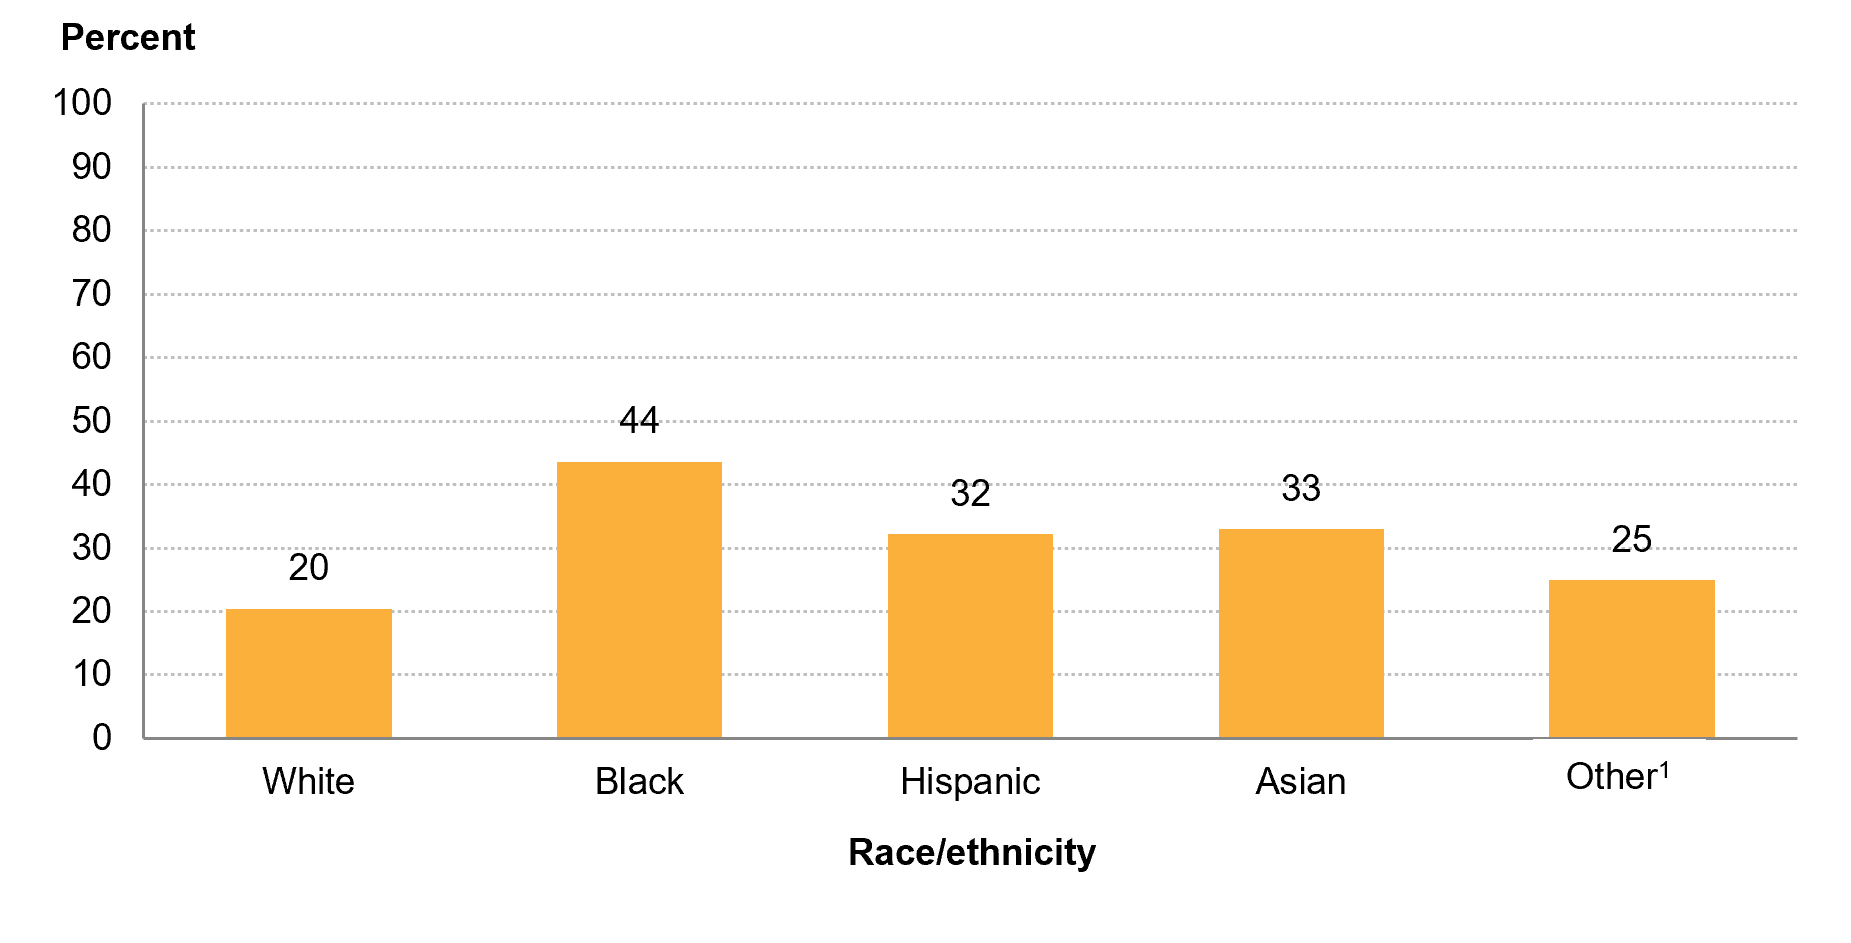
Children’s participation in any summer education activities in the summer of 2021 varied across racial/ethnic groups. The percentage of adults reporting any summer activities for their children was higher for Black adults (44 percent) than for all other racial/ethnic groups (figure 3). While lower than the percentage of Black adults reporting any summer activities for their children, the percentages of Asian and Hispanic adults (33 and 32 percent, respectively) were both higher than the percentage of White adults (20 percent).
Figure 3. Among adults 18 years old and over who had children under age 18 in the home enrolled in school, percentage reporting participation in any summer education activities after the end of the normal school year in spring of 2021, by adult’s race/ethnicity: September 15 to 27, 2021

1 Includes persons reporting Pacific Islander alone, persons reporting American Indian/Alaska Native alone, and persons of Two or more races.
NOTE: Data in this figure are considered experimental and do not meet NCES standards for response rates. The 2021 Household Pulse Survey, an experimental data product, is an Interagency Federal Statistical Rapid Response Survey to Measure Household Experiences during the coronavirus pandemic, conducted by the U.S. Census Bureau in partnership with 16 other federal agencies and offices. The number of respondents and response rate for the period reported in this table were 59,833 and 5.6 percent. The final weights are designed to produce estimates for the total persons age 18 and older living within housing units. These weights were created by adjusting the household level sampling base weights by various factors to account for nonresponse, adults per household, and coverage. For more information, see https://www.census.gov/programs-surveys/household-pulse-survey/technical-documentation.html. Race categories exclude persons of Hispanic ethnicity.
SOURCE: U.S. Department of Commerce, Census Bureau, Household Pulse Survey, September 15 to 27, 2021. See Digest of Education Statistics 2021, table 227.60.
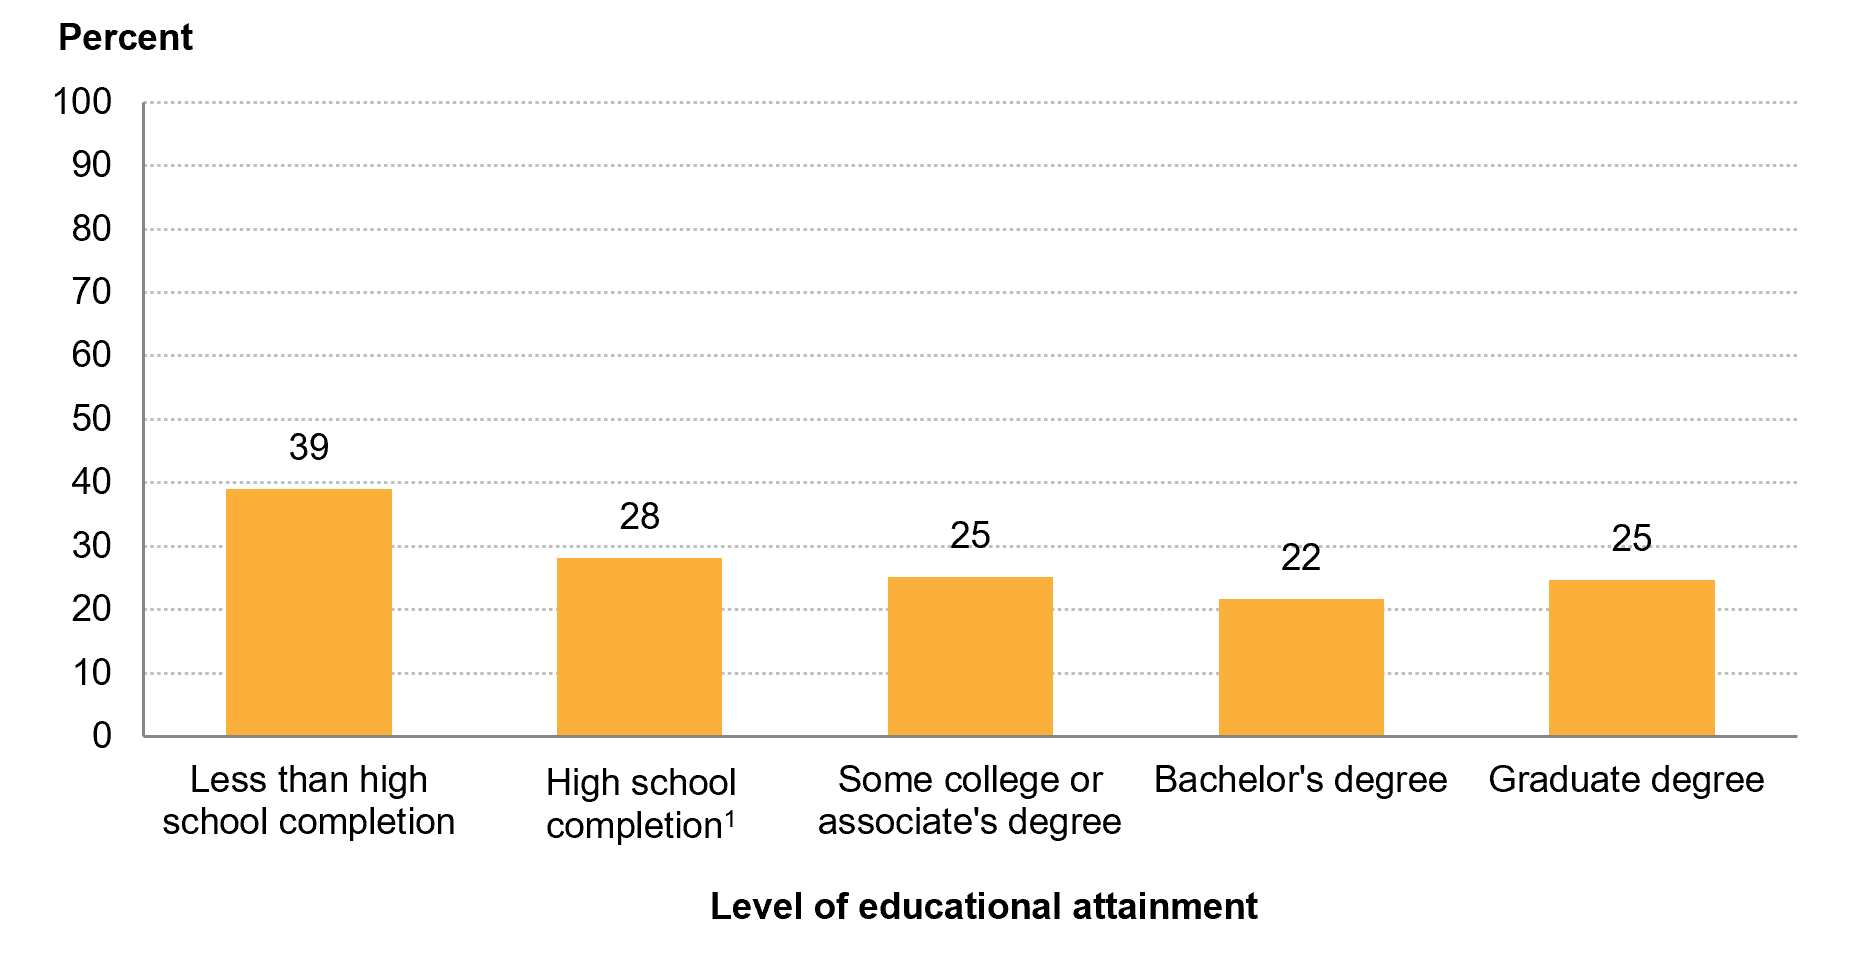
There were also some differences observed in reported participation rates in summer education activities by the responding adult’s highest level of educational attainment. Children in households where the responding adult had completed less than high school were more likely to participate in summer education activities (39 percent) than were those in households where the responding adult had completed some college or an associate’s degree (25 percent), a bachelor’s degree (22 percent), or a graduate degree (25 percent) (figure 4). Similarly, children in households where the responding adult had completed high school2 were more likely to participate in summer education activities (28 percent) than were those in households where the responding adult had completed a bachelor’s degree (22 percent). There were no significant differences in children’s participation rates between other adult educational attainment levels.
Figure 4. Among adults 18 years old and over who had children under age 18 in the home enrolled in school, percentage reporting participation in any summer education activities after the end of the normal school year in spring of 2021, by adult’s highest level of educational attainment: September 15 to 27, 2021

1 High school completers include those with a high school diploma as well as those with an alternative credential, such as a GED.
NOTE: Data in this figure are considered experimental and do not meet NCES standards for response rates. The 2021 Household Pulse Survey, an experimental data product, is an Interagency Federal Statistical Rapid Response Survey to Measure Household Experiences during the coronavirus pandemic, conducted by the U.S. Census Bureau in partnership with 16 other federal agencies and offices. The number of respondents and response rate for the period reported in this table were 59,833 and 5.6 percent. The final weights are designed to produce estimates for the total persons age 18 and older living within housing units. These weights were created by adjusting the household level sampling base weights by various factors to account for nonresponse, adults per household, and coverage. For more information, see https://www.census.gov/programs-surveys/household-pulse-survey/technical-documentation.html. Although rounded numbers are displayed, the figures are based on unrounded data.
SOURCE: U.S. Department of Commerce, Census Bureau, Household Pulse Survey, September 15 to 27, 2021. See Digest of Education Statistics 2021, table 227.60.
The percentage of adults reporting that children participated in summer education activities also varied across households with different levels of income in 2020. The percentages of adults reporting that children participated in any summer education activities were higher for those with a 2020 household income of less than $25,000 (34 percent) and $25,000 to $49,999 (33 percent) than for all other higher household income levels. There were no significant differences in reported participation rates among adults with 2020 household income levels of $50,000 to $74,999, $75,000 to $99,999, $100,000 to $149,999, and $150,000 or more.
Learn more about the Household Pulse Survey and access data tables, public use files, and an interactive data tool. For more detailed data on the summer education activities discussed in this blog post, explore the Digest of Education Statistics, table 227.60. To access other data on how the COVID-19 pandemic has impacted education, explore our School Pulse Panel dashboard.
Be sure to follow us on Twitter, Facebook, LinkedIn, and YouTube to stay up-to-date on the latest findings and trends in education, including those on summer learning activities.
By Ashley Roberts, AIR
[1] The speed of the survey development and the pace of the data collection efforts led to policies and procedures for the experimental HPS that were not always consistent with traditional federal survey operations. For example, the timeline for the surveys meant that opportunities to follow up with nonrespondents were very limited. This has led to response rates of 1 to 10 percent, which are much lower than the typical target response rate set in most federal surveys. While the responses have been statistically adjusted so that they represent the nation and states in terms of geographic distribution, sex, race/ethnicity, age, and educational attainment, the impact of survey bias has not been fully explored.
[2] High school completers include those with a high school diploma as well as those with an alternative credential, such as a GED.