Inside IES Research

Notes from NCER & NCSER

Recommendations for Using Social Media for Effective Dissemination of Education Research

When it comes to using research to inform practice, teachers tend to want succinct tips and strategies that can work in their own classrooms. Researchers can use social media channels to tailor their messages from their research findings and disseminate where teachers are already active. In this guest blog, Dr. Sam Van Horne, University of Delaware, describes the work that researchers conducted as part of the originally IES-funded Center for Research Use in Education. The goal of the center was to understand the gaps between researcher and practitioner perspectives on the usefulness of research in practice so that the center can address issues around how researcher communicate about their research, how practitioners can use research more effectively in their classrooms, and how to build stronger connections between the two communities.

Using a large cross-sectional survey of school-based practitioners, we found that practitioners report consuming research through multiple channels, and more than half of reported using social media in the last year with the goal of improving their practice. Social media channels, therefore, provide education researchers with an opportunity to connect with practitioners, but where are researchers likely to find teachers on social media? And how can researchers distill their findings for sharing in mediums that are vastly different than traditional academic forms? Here are some recommendations based on our research.

  • Finding and Connecting with Educators on Social Media: One review of research about social media use among teachers found that Facebook and Twitter are some of the main sites that teachers use. But teachers also use Pinterest and Instagram as methods for learning from other teachers about teaching strategies. Posting in multiple channels may make it more likely that a message can reach educators. To find educators, researchers can search for public lists on education-focused topics or see who is using hashtags like #edtwitter, #TeachersofInstagram, or #EduTooters. By following lists, researchers can efficiently find educators to follow and tag (i.e., add the educator’s username to a social media message) with their messages about research-informed practice. This can aid with directly engaging practitioners and beginning conversations about applying research to practice.
  • Using Hashtags or Tagging Specific People on Social Media: Social media networks like Twitter can overwhelm users with the volume of content being shared, so it’s critical to use tools like hashtags to find a practice-focused community who may be interested in applying research findings. Users search for content with hashtags that are discipline specific or likely to reach educators, such as #edutooters on Mastodon, #edutwitter on Twitter, or #teachersofinstagram or #teachersfollowteachers on Instagram. The key is identifying teachers or knowledge brokers (i.e., people or organizations who support practitioners in applying research evidence to teaching practice) that may be interested in the message and who may retweet or boost the message to their own followers.
  • Tailoring Messages to Focus on What Practitioners Can Do: When the audience is identified, researchers can ask themselves, “What do I want this group to consider doing based on these research findings?” Then, social media messages can incorporate those ideas rather than just summarizing research findings. Social media messages describing how research can inform education practice should be economical and capture interest. Links to the original paper can be appended to a post for those who want to read more.
  •  When possible, include links to publications or resources in publicly available repositories and not to versions in subscription-based journals. IES grantees can increase the visibility of their research by submitting their publications as grantee submissions in ERIC. This not only fulfills public-access requirements but also gives practitioners access to important information for improving teaching practice.  
  • Incorporating Visual Elements to Attract Attention to Education Research Findings: Messages that incorporate visual elements or video are better suited for sharing on social media. The visual abstract is a succinct summary of research findings that is well-suited for sharing in social media platforms, and researchers have found that visual abstracts are more often shared on social media platforms than plain text about research. You can find guidance on creating visual abstracts here, though the authors suggest collaborating with a designer. These visual abstracts are suited for visual platforms like Pinterest or Instagram. Some journals make a regular practice of posting brief video messages from authors who explain their research study and the significance of the findings. Animations can also attract more attention to messages about research.

Disseminating education research on social media is not a “one-and-done” practice but should be part of a professional social media presence. Many guides exist for developing a professional social media presence, such as these for Twitter and LinkedIn. In addition to posting about research and its implications for practice, researchers can post about research or general issues in the field. This helps with building a following that will be more likely to see posts about research. There are other benefits to disseminating research on social media channels, including providing researchers with metrics about how many times their messages are shared or retweeted (or boosted, on Mastodon), as well as enabling research about optimal ways to share research to reach the broadest audience. In fact, Dr. Farley-Ripple, a leader of CRUE, and colleagues have received funding from the National Science Foundation for a research study to investigate the effectiveness of different dissemination strategies on social media, including the effectiveness of the translational visual abstract.

Connecting with educators on social media is a process. Researchers can begin by creating a presence on social media networks where educators are found and then post often about education and use hashtags to help make messages visible to educators. Messages can be succinct posts that include recommendations or strategies that are feasible for educators to adopt or include multimedia messages like the translational visual abstract to attract attention in a medium that is suited to visuals. Over time, it’s possible to learn what works and what doesn’t and adapt strategies for reaching educators, while keeping in mind that the tools and networks available now will undoubtedly adapt and change themselves.


Sam Van Horne is a Data Scientist at the Center for Research Use in Education and the Center for Research in Education and Social Policy at the University of Delaware.

This blog was produced by Corinne Alfeld (Corinne.Alfeld@ed.gov), program officer, NCER.

CTE Research Through an Equity Lens

This image depicts six considerations for centering equity in CTE research:  Ensure transparency: Be clear about the why, the what, and the who Involve the community: Obtain feedback from research participants throughout the process Develop diverse teams: Ensure teams represent varied perspectives and are trained in equity-based research perspective Take a systems approach: Be cognizant of historical issues of inequity within vocational education Acknowledge and attend to bias: Consider how bias is present in different parts of research Demonstrate respect: Bring an asset-based perspective

February is Career and Technical Education (CTE) month! As part of our 20th anniversary celebration, we want to highlight the great work our CTE Research Network (CTERN) continues to accomplish. The blog below highlights NCER’s conversation with the Equity Working Group of the IES-funded CTE Research Network

The Equity Working Group (EWG) of the CTE Research Network (CTERN) has published a new resource for researchers on using an equity lens in developing and conducting CTE research: The Equity Framework for CTE Research. CTERN is hosting a free webinar on February 21st at 3:00 Eastern to provide an overview of the framework and how people can use it. In this blog, members of the Equity Working Group answered questions about the framework and why it is important. 

The framework has a focus on equity, but equity can mean different things to different people. How does the EWG define equity in this framework?

We strongly believe that every student should have the opportunity to engage in quality educational experiences. Students who are interested should have access to CTE programs, regardless of their background characteristics. And school systems should invest in students so that they can succeed in these programs. Ultimately, we find ourselves quoting the Wisconsin Department of Public Instruction’s definition because it neatly captures our position: “Every student has access to the educational resources and rigor they need at the right moment in their education across race, gender, ethnicity, language, disability, sexual orientation, family background, and/or family income.”

Why did the EWG members believe that there was a need for an equity framework for CTE research?

CTE has a long and complicated history, including extensive tracking under its previous incarnation as vocational education. The CTE Equity Working Group was very conscious of this history and wanted to take steps to help ensure that CTE research was helping to ameliorate current inequities. As we say in the framework, “We believe that infusing equity throughout our research is critical to ensuring that research can make a difference in promoting equitable learning experiences and outcomes for all students who participate in CTE.”

We also recognized that many researchers (including ourselves) want to use an equity lens to do their research but lack practical guidance in what that looks like. The working group believed that a framework with concrete examples and tips would help CTE researchers have a clearer picture of what to do and would provide a tool for helping them think differently about their work.

How did the EWG create the framework?

This was a collaborative process that grew out of our first CTE Research Network meeting in 2018 or 2019. A group of us realized that incorporating an equity lens into our work would help us better answer questions that matter to communities. We decided to form a working group, which ended up including around 20 or so researchers, practitioners, and policy staff. We read a lot of good frameworks from different organizations on improving our research practices, so we decided to invest our energy in seeing how it may be applied to a CTE context.

How is the framework structured and what are some key takeaways?

It is important to note what this framework is and is not. This framework is not intended as a methodological primer or a replication of existing research guidance; it is intended to encourage researchers to think about their own work through an equity lens.

The framework starts with a brief history of equity in CTE, a description of the process of creating the framework, a list of vocabulary (we believe having a common language is critical), and a statement of the values that underlie the framework.

The rest of the framework is then organized by six stages of research: 1) project management; 2) research design, 3) measurement and data collection, 4) data analysis, 5) cost and resource equity, and 6) reporting and dissemination. In each section, we include a description of how to implement the stage with an equity-focused lens, with questions for researchers to consider and potential barriers. Throughout, we have included examples from current and future CTE research. We are looking for more examples, so people should feel free to reach out to us at jedmunds@serve.org to share how they are doing this work.

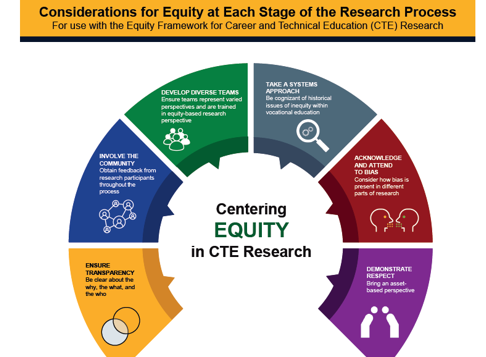
In creating summary products to go along with the framework, we identified six themes that cut across the different stages: ensure transparency, involve the community, develop diverse teams, take a systems approach, acknowledge and attend to bias, and demonstrate respect. These themes are summarized in an infographic.

How do you hope that people will use the framework?

We hope this will help start or further conversations among CTE researchers. We structured the framework around each stage of the research process, so anyone engaging in this work can find elements to incorporate or questions to consider individually and as a team, regardless of where they are in their work right now. For studies just getting off the ground, we did our best to illustrate how researchers can build an equity approach from the start of a project through its completion.

What are some examples of how the framework changed individual EWG members’ research practices?

Julie A. Edmunds (co-facilitator): Working on the framework has crystallized three high-impact equity-focused practices that I now try to infuse throughout my work. First, I pay much more attention to the role of systems in inequities. I try to look at upstream factors that might be causing disparities in educational outcomes as opposed to just documenting gaps that might exist between sub-groups. Second, when presenting those gaps (which we still do because it is useful information), I am much more conscious about how those gaps are displayed. For example, we focus on making sure that “White” is not considered the default category against which all others are compared. Third, we are creating processes to ensure that we share our findings with people who gave us the data. For example, we are sending practitioner-friendly products (such as briefs or infographics) to the school staff we interviewed whose insights formed the basis for some of our findings.

John Sludden (member): The framework has helped us think about our internal processes and keeps us focused on our audience, who we’re doing this for. I’m an analyst on the project, and I’ve been empowered to ask questions, conduct analyses, and present to our research partners at the New York City Department of Education. We’re currently thinking about ways to communicate findings to different audiences. At the moment, we’re working on a plan to share findings with principals of CTE high schools in New York City. Organizationally, we are also working on ways to directly engage students in the city, who know more about the system than we ever will. Similar to Julie, analytically, we have spent a lot of our time and attention on looking at the conditions under which students have not been well-served by the system, and ways that students may be better served by CTE.


This blog was produced by Corinne Alfeld (Corinne.Alfeld@ed.gov), program officer, NCER.

Using Cost Analysis to Inform Replicating or Scaling Education Interventions

A key challenge when conducting cost analysis as part of an efficacy study is producing information that can be useful for addressing questions related to replicability or scale. When the study is a follow up conducted many years after the implementation, the need to collect data retrospectively introduces additional complexities. As part of a recent follow-up efficacy study, Maya Escueta and Tyler Watts of Teachers College, Columbia University worked with the IES-funded Cost Analysis in Practice (CAP) project team to plan a cost analysis that would meet these challenges. This guest blog describes their process and lessons learned and provides resources for other researchers.

What was the intervention for which you estimated costs retrospectively?

We estimated the costs of a pre-kindergarten intervention, the Chicago School Readiness Project (CSRP), which was implemented in nine Head Start Centers in Chicago, Illinois for two cohorts of students in 2004-5 and 2005-6. CSRP was an early childhood intervention that targeted child self-regulation by attempting to overhaul teacher approaches to behavioral management. The intervention placed licensed mental health clinicians in classrooms, and these clinicians worked closely with teachers to reduce stress and improve the classroom climate. CSRP showed signs of initial efficacy on measures of preschool behavioral and cognitive outcomes, but more recent results from the follow-up study showed mainly null effects for the participants in late adolescence.

The IES research centers require a cost study for efficacy projects, so we faced the distinct challenge of conducting a cost analysis for an intervention nearly 20 years after it was implemented. Our goal was to render the cost estimates useful for education decision-makers today to help them consider whether to replicate or scale such an intervention in their own context.

What did you learn during this process?

When enumerating costs and considering how to implement an intervention in another context or at scale, we learned four distinct lessons.

1. Consider how best to scope the analysis to render the findings both credible and relevant given data limitations.

In our case, because we were conducting the analysis 20 years after the intervention was originally implemented, the limited availability of reliable data—a common challenge in retrospective cost analysis—posed two challenges. We had to consider the data we could reasonably obtain and what that would mean for the type of analysis we could credibly conduct. First, because no comprehensive cost analysis was conducted at the time of the intervention’s original implementation (to our knowledge), we could not accurately collect costs on the counterfactual condition. Second, we also lacked reliable measures of key outcomes over time, such as grade retention or special education placement that would be required for calculating a complete cost-benefit analysis. This meant we were limited in both the costs and the effects we could reliably estimate. Due to these data limitations, we could only credibly conduct a cost analysis, rather than a cost-effectiveness analysis or cost-benefit analysis, which generally produce more useful evidence to aid in decisions about replication or scale.

Because of this limitation, and to provide useful information for decision-makers who are considering implementing similar interventions in their current contexts, we decided to develop a likely present-day implementation scenario informed by the historical information we collected from the original implementation. We’ll expand on how we did this and the decisions we made in the following lessons.

2. Consider how to choose prices to improve comparability and to account for availability of ingredients at scale.

We used national average prices for all ingredients in this cost analysis to make the results more comparable to other cost analyses of similar interventions that also use national average prices. This involved some careful thought about how to price ingredients that were unique to the time or context of the original implementation, specific to the intervention, or in low supply. For example, when identifying prices for personnel, we either used current prices (national average salaries plus fringe benefits) for personnel with equivalent professional experience, or we inflation-adjusted the original consulting fees charged by personnel in highly specialized roles. This approach assumes that personnel who are qualified to serve in specialized roles are available on a wider scale, which may not always be the case.

In the original implementation of CSRP, spaces were rented for teacher behavior management workshops, stress reduction workshops, and initial training of the mental health clinicians. For our cost analysis, we assumed that using available school facilities were more likely and tenable when implementing CSRP at large scale. Instead of using rental prices, we valued the physical space needed to implement CSRP by using amortized construction costs of school facilities (for example, cafeteria/gym/classroom). We obtained these from the CAP Project’s Cost of Facilities Calculator.

3. Consider how to account for ingredients that may not be possible to scale.

Some resources are simply not available in similar quality at large scale. For example, the Principal Investigator (PI) for the original evaluation oversaw the implementation of the intervention, was highly invested in the fidelity of implementation, was willing to dedicate significant time, and created a culture that was supportive of the pre-K instructors to encourage buy-in for the intervention. In such cases, it is worth considering what her equivalent role would be in a non-research setting and how scalable this scenario would be. A potential proxy for the PI in this case may be a school principal or leader, but how much time could this person reasonably dedicate, and how similar would their skillset be?  

4. Consider how implementation might work in institutional contexts required for scale.

Institutional settings might necessarily change when taking an intervention to scale. In larger-scale settings, there may be other ways of implementing the intervention that might change the quantities of personnel and other resources required. For example, a pre-K intervention such as CSRP at larger scale may need to be implemented in various types of pre-K sites, such as public schools or community-based centers in addition to Head Start centers. In such cases, the student/teacher ratio may vary across different institutional contexts, which has implications for the per-student cost. If delivered in a manner where the student/ teacher ratio is higher than in the original implementation, the intervention may be less costly, but may also be less impactful. This highlights the importance of the institutional setting in which implementation is occurring, and how this might affect the use and costs of resources.

How can other researchers get assistance in conducting a cost analysis?

In conducting this analysis, we found the following CAP Project tools to be especially helpful (found on the CAP Resources page and the CAP Project homepage):

  • The Cost of Facilities Calculator: A tool that helps estimate the cost of physical spaces (facilities).
  • Cost Analysis Templates: Semi-automated Excel templates that support cost analysis calculations.
  • CAP Project Help Desk: Real-time guidance from a member of the CAP Project team. You will receive help in troubleshooting challenging issues with experts who can share specific resources. Submit a help desk request by visiting this page.

Maya Escueta is a Postdoctoral Associate in the Center for Child and Family Policy at Duke University where she researches the effects of poverty alleviation policies and parenting interventions on the early childhood home environment.

Tyler Watts is an Assistant Professor in the Department of Human Development at Teachers College, Columbia University. His research focuses on the connections between early childhood education and long-term outcomes.

For questions about the CSRP project, please contact the NCER program officer, Corinne.Alfeld@ed.gov. For questions about the CAP project, contact Allen.Ruby@ed.gov.


Unexpected Value from Conducting Value-Added Analysis

This is the second of a two-part blog series from an IES-funded partnership project. The first part described how the process of cost-effectiveness analysis (CEA) provided useful information that led to changes in practice for a school nurse program and restorative practices at Jefferson County Public Schools (JCPS) in Louisville, KY. In this guest blog, the team discusses how the process of conducting value-added analysis provided useful program information over and above the information they obtained via CEA or academic return on investment (AROI).

Since we know you loved the last one, it’s time for another fun thought experiment! Imagine that you have just spent more than a year gathering, cleaning, assembling, and analyzing a dataset of school investments for what you hope will be an innovative approach to program evaluation. Now imagine the only thing your results tell you is that your proposed new application of value-added analysis (VAA) is not well-suited for these particular data. What would you do? Well, sit back and enjoy another round of schadenfreude at our expense. Once again, our team of practitioners from JCPS and researchers from Teachers College, Columbia University and American University found itself in a very unenviable position.

We had initially planned to use the rigorous VAA (and CEA) to evaluate the validity of a practical measure of academic return on investment for improving school budget decisions on existing school- and district-level investments. Although the three methods—VAA, CEA, and AROI—vary in rigor and address slightly different research questions, we expected that their results would be both complementary and comparable for informing decisions to reinvest, discontinue, expand/contract, or make other implementation changes to an investment. To that end, we set out to test our hypothesis by comparing results from each method across a broad spectrum of investments. Fortunately, as with CEA, the process of conducting VAA provided additional, useful program information that we would not have otherwise obtained via CEA or AROI. This unexpected information, combined with what we’d learned about implementation from our CEAs, led to even more changes in practice at JCPS.

Data Collection for VAA Unearthed Inadequate Record-keeping, Mission Drift, and More

Our AROI approach uses existing student and budget data from JCPS’s online Investment Tracking System (ITS) to compute comparative metrics for informing budget decisions. Budget request proposals submitted by JCPS administrators through ITS include information on target populations, goals, measures, and the budget cycle (1-5 years) needed to achieve the goals. For VAA, we needed similar, but more precise, data to estimate the relative effects of specific interventions on student outcomes, which required us to contact schools and district departments to gather the necessary information. Our colleagues provided us with sufficient data to conduct VAA. However, during this process, we discovered instances of missing or inadequate participant rosters; mission drift in how requested funds were actually spent; and mismatches between goals, activities, and budget cycles. We suspect that JCPS is not alone in this challenge, so we hope that what follows might be helpful to other districts facing similar scenarios.

More Changes in Practice 

The lessons learned during the school nursing and restorative practice CEAs discussed in the first blog, and the data gaps identified through the VAA process, informed two key developments at JCPS. First, we formalized our existing end-of-cycle investment review process by including summary cards for each end-of-cycle investment item (each program or personnel position in which district funds were invested) indicating where insufficient data (for example, incomplete budget requests or unavailable participation rosters) precluded AROI calculations. We asked specific questions about missing data to elicit additional information and to encourage more diligent documentation in future budget requests. 

Second, we created the Investment Tracking System 2.0 (ITS 2.0), which now requires budget requesters to complete a basic logic model. The resources (inputs) and outcomes in the logic model are auto-populated from information entered earlier in the request process, but requesters must manually enter activities and progress monitoring (outputs). Our goal is to encourage and facilitate development of an explicit theory of change at the outset and continuous evidence-based adjustments throughout the implementation. Mandatory entry fields now prevent requesters from submitting incomplete budget requests. The new system was immediately put into action to track all school-level Elementary and Secondary School Emergency Relief (ESSER)-related budget requests.

Process and Partnership, Redux

Although we agree with the IES Director’s insistence that partnerships between researchers and practitioners should be a means to (eventually) improving student outcomes, our experience shows that change happens slowly in a large district. Yet, we have seen substantial changes as a direct result of our partnership. Perhaps the most important change is the drastic increase in the number of programs, investments, and other initiatives that will be evaluable as a result of formalizing the end-of-cycle review process and creating ITS 2.0. We firmly believe these changes could not have happened apart from our partnership and the freedom our funding afforded us to experiment with new approaches to addressing the challenges we face.   


Stephen M. Leach is a Program Analysis Coordinator at JCPS and PhD Candidate in Educational Psychology Measurement and Evaluation at the University of Louisville.

Dr. Robert Shand is an Assistant Professor at American University.

Dr. Bo Yan is a Research and Evaluation Specialist at JCPS.

Dr. Fiona Hollands is a Senior Researcher at Teachers College, Columbia University.

If you have any questions, please contact Corinne Alfeld (Corinne.Alfeld@ed.gov), IES-NCER Grant Program Officer.


Congratulations and Thanks to the 2021 Winners of the Nobel Memorial Prize in Economic Sciences

IES would like to congratulate and thank David Card, Joshua D. Angrist, and Guido W. Imbens, who received this year’s Sveriges Riksbank Prize in Economic Sciences in Memory of Alfred Nobel. The work of these laureates has greatly contributed to the ability of researchers to provide causal evidence in support of education practice and policy decision making. IES is proud to have previously supported Card and Angrist in some of their education research work.

Many key issues in education cannot be analyzed using randomized experiments for practical and ethical reasons. Card’s work (with Alan Krueger) on natural experiments helped open up a novel approach to providing causal findings. In natural experiments, outcomes are compared for people who have differential access to a program or policy (or a change in a program or policy) because of real life conditions (for example, institutional or geographic differences) rather than through random assignment by researchers. Natural experiments have been adopted by IES grantees to examine a broad variety of education programs and policies such as PreK expansion, early literacy, school choice, school turnaround programs, high school curriculum change, and changes to postsecondary remediation course requirements. Angrist and Imbens showed how to estimate a causal treatment effect when individuals can choose to participate in a program or policy, which often occurs in natural experiments and can occur in randomized experiments after researchers have randomly assigned participants. IES grantees widely use their instrumental variable approach for both experimental (often involving designs based on school lotteries) and quasi-experimental designs.

In addition to developing evaluation designs and methods that have been broadly applied within education research, Card and Angrist have also directly carried out education research important to the field, sometimes with the support of IES. For example, Card is a principal investigator (PI) on two IES-funded studies on gifted education (elementary school and middle school) and is a co-PI on the National Center for Research on Gifted Education. Angrist is PI on two IES-funded studies, one on charter schools and one evaluating a Massachusetts desegregation program.

Angrist and Imbens have also supported the work of IES. Both researchers served as IES peer reviewers on grants and reports, and Imbens provided the What Works Clearinghouse with advice on standards for regression discontinuity designs (RDD) and co-authored one IES-supported paper regarding RDD (a method that has also become widely used in IES-funded research).

IES thanks Card, Angrist, and Imbens—both for their contributions to causal methods and for their direct participation in education research—and congratulates them for this recognition.