IES Blog

Institute of Education Sciences

NCES Centralizes State-Level Data in New Digest State Dashboard

With hundreds of tables to explore, the Digest of Education Statistics offers a wide array of education data. For the first time, NCES is visualizing Digest data in a new Digest State Dashboard. The Dashboard provides a centralized location for state-level Digest data, so users can easily find it all in one place. As the first-ever Digest data tool, the Dashboard helps you not only find and use NCES data but also better understand the education landscape of an individual state.

In alignment with NCES’s goal to promote diversity, equity, and inclusion in our products, the Dashboard provides data for all entities that are part of the United States: the 50 states, the District of Columbia, the Bureau of Indian Education, and outlying areas—i.e., American Samoa, Guam, Northern Marianas, Puerto Rico, and U.S. Virgin Islands.

Digest Dashboard Topics

  • Public school enrollment
  • Public school student characteristics
  • Public school teachers
  • Public schools
  • Private school education
  • Reading and mathematics assessments
  • 4-year adjusted cohort graduation rate (ACGR)
  • Public school expenditures
  • Postsecondary enrollment
  • Postsecondary institution and student charges

For each of these entities, the Dashboard highlights the most recently published Digest data on topics of interest (see textbox). The selected topics represent key indicators of a state’s education landscape, and data are presented for each entity and topic whenever available.

To help make data interpretation easier, the Dashboard presents data in figures—like bar charts, line graphs, and brief tables—that allow you to interact with the data in ways not possible with the static tables. If you’ve ever explored the Condition of Education—which will be updated next month (May 2024)—the Dashboard’s figures should look very familiar, as they were designed to mirror the appearance and functionality of the Condition’s interactive figures. Similarly, in the Dashboard, you can

  1. modify the figure by selecting characteristics and years to include;
  2. share the figure on various platforms; and
  3. download the figure and the data used in the figure. 

The Dashboard also provides links to other NCES state-level data tools, centralizing these resources and providing a more detailed picture of each state’s educational landscape. You can find state-specific links to NAEP State Profiles, the NTPS State Dashboard, and the PIAAC Skills Map on each state’s page. Plus, you can find links to other NCES data tools, like the EDGE ACS Dashboard and the IPEDS Trend Generator, on the Dashboard’s homepage.

The Dashboard will be continuously updated throughout the year—as data become available in the Digest—making it a great source of up-to-date information for policymakers, researchers, practitioners, and parents/families. In May 2024, several figures will be updated, including two postsecondary figures on enrollment and institutions and student charges. Be sure to check back and follow NCES on XFacebookLinkedIn, and YouTube and subscribe to the NCES News Flash to stay informed when these and other updates are made. You can also continue to explore the Digest tables to find even more state-level data.

Celebrating the ECLS-K:2024: Providing Key National Data on Our Country’s Youngest Learners

It’s time to celebrate!

This spring, the Early Childhood Longitudinal Study, Kindergarten Class of 2023–24 (ECLS-K:2024) is wrapping up its first school year of data collection with tens of thousands of children in hundreds of schools across the nation. You may not know this, but NCES is congressionally mandated to collect data on early childhood. We meet that charge by conducting ECLS program studies like the ECLS-K:2024 that follow children through the early elementary grades. Earlier studies looked at children in the kindergarten classes of 1998–99 and 2010–11. We also conducted a study, the Early Childhood Longitudinal Study, Birth Cohort (ECLS-B), that followed children from birth through kindergarten entry.

As the newest ECLS program study, the ECLS-K:2024 will collect data from both students and adults in these students’ lives (e.g., parents, teachers, school administrators) to help us better understand how different factors at home and at school relate to children’s development and learning. In fact, the ECLS-K:2024 allows us to provide data not only on the children in the cohort but also on kindergarten teachers and the schools that educate kindergartners.

What we at NCES think is worthy of celebrating is that the ECLS-K:2024—like other ECLS program studies,

  • provides the statistics policymakers need to make data-driven decisions to improve education for all;
  • contributes data that researchers need to answer today’s most pressing questions related to early childhood and early childhood education; and
  • allows us to produce resources for parents, families, teachers, and schools to better inform the public at large about children’s education and development.

Although smaller-scale studies can answer numerous questions about education and development, the ECLS-K:2024 allows us to provide answers at a national level. For example, you may know that children arrive to kindergarten with different skills and abilities, but have you ever wondered how those skills and abilities vary for children who come from different areas of the country? How they vary for children who attended prekindergarten programs versus those who did not? How they vary for children who come from families of different income levels? The national data from the ECLS-K:2024 allow us to dive into these—and other—issues.

The ECLS-K:2024 is unique in that it’s the first of our early childhood studies to provide data on a cohort of students who experienced the coronavirus pandemic. How did the pandemic affect these children’s early development and how did it change the schooling they receive? By comparing the experiences of the ECLS-K:2024 cohort to those of children who were in kindergarten nearly 15 and 25 years ago, we’ll be able to answer these questions.

What’s more, the ECLS-K:2024 will provide information on a variety of topics not fully examined in previous national early childhood studies. The study is including new items on families’ kindergarten selection and choice; availability and use of home computers and other digital devices; parent-teacher association/organization contributions to classrooms; equitable school practices; and a myriad of other constructs.

Earlier ECLS program studies have had a huge impact on our understanding of child development and early education, with hundreds of research publications produced using their data (on topics such as academic skills and school performance; family activities that promote learning; and children’s socioemotional development, physical health, and well-being). ECLS data have also been referenced in media outlets and in federal and state congressional reports. With the launch of the ECLS-K:2024, we cannot wait to see the impact of research using the new data.

Want to learn more? 

Plus, be on the lookout late this spring for the next ECLS blog post celebrating the ECLS-K:2024, which will highlight children in the study. Future blog posts will focus on parents and families and on teachers and schools. Stay tuned!


By Jill McCarroll and Korrie Johnson, NCES

Using IPEDS Data: Available Tools and Considerations for Use

The Integrated Postsecondary Education Data System (IPEDS) contains comprehensive data on postsecondary institutions. IPEDS gathers information from every college, university, and technical and vocational institution that participates in federal student financial aid programs. The Higher Education Act of 1965, as amended, requires institutions that participate in federal student aid programs to report data on enrollments, program completions, graduation rates, faculty and staff, finances, institutional prices, and student financial aid.

These data are made available to the public in a variety of ways via the IPEDS Use the Data webpage. This blog post provides a description of available IPEDS data tools as well as considerations for determining the appropriate tool to use.


Available Data Tools

College Navigator

College Navigator is a free consumer information tool designed to help students, parents, high school counselors, and others access information about postsecondary institutions.

Note that this tool can be found on the Find Your College webpage (under "Search for College"), along with various other resources to help users plan for college.

IPEDS provides data tools for a variety of users that are organized into three general categories: (1) Search Existing Data, (2) Create Custom Data Analyses, and (3) Download IPEDS Data.

Search Existing Data

Users can search for aggregate tables, charts, publications, or other products related to postsecondary education using the Data Explorer or access IPEDS data via NCES publications like the Digest of Education Statistics or the Condition of Education.

Create Custom Data Analyses

Several data tools allow users to create their own custom analyses with frequently used and derived variables (Data Trends) or all available data collected within IPEDS (Statistical Tables). Users can also customize tables for select subgroups of institutions (Summary Tables). Each of these options allows users to generate analyses within the limitations of the tool itself.

For example, there are three report types available under the Data Feedback Report (DFR) tool. User can

  1. select data from the most recent collection year across frequently used and derived variables to create a Custom DFR;
     
  2. create a Statistical Analysis Report using the variables available for the Custom DFR; and
     
  3. access the NCES developed DFR for any institution.

Download IPEDS Data

Other data tools provide access to raw data through a direct download (Complete Data Files) or through user selections in the IPEDS Custom Data Files tool. In addition, IPEDS data can be downloaded for an entire collection year for all survey components via the Access Database.

IPEDS Data Tools Help

The IPEDS Data Tools User Manual is designed to help guide users through the various functions, processes, and abundant capabilities of IPEDS data tools. The manual contains a wealth of information, hints, tips, and insights for using the tools.


Data Tool Considerations

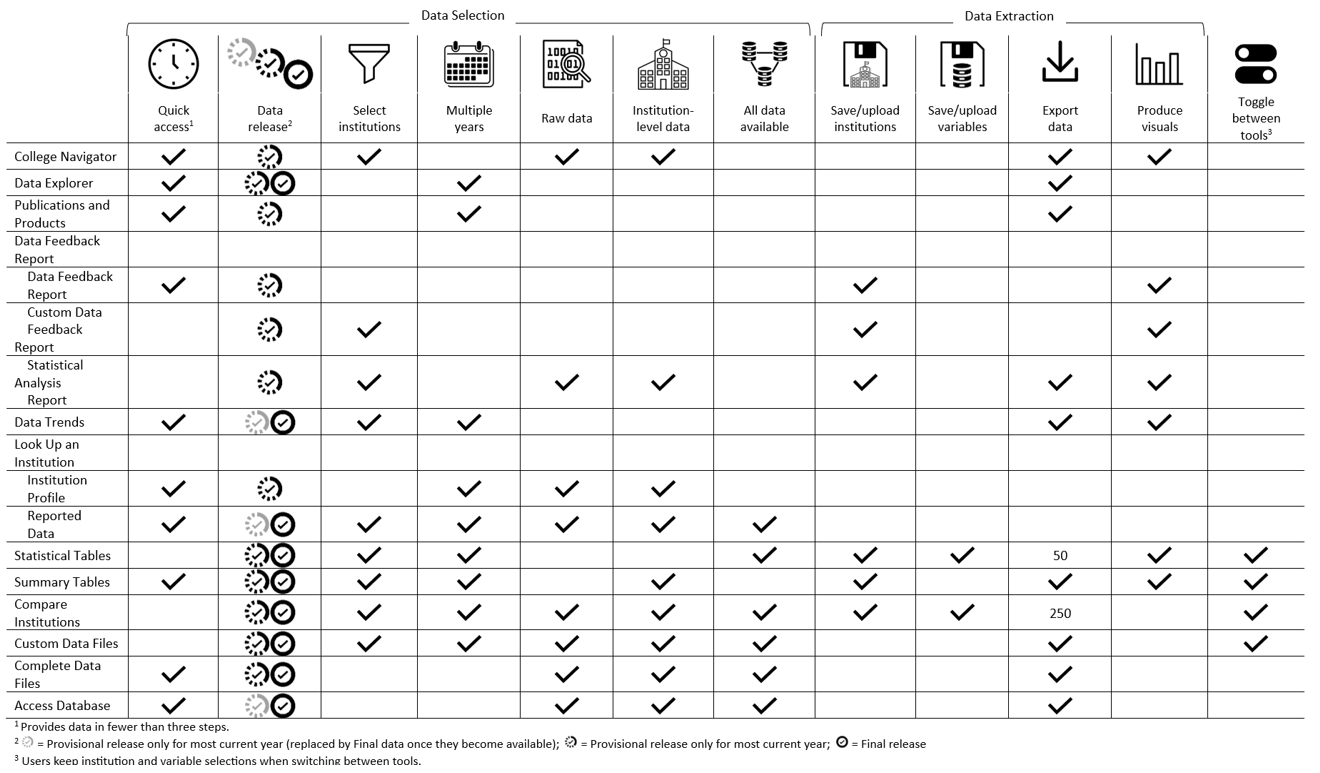
Users may consider several factors—related to both data selection and data extraction—when determining the right tool for a particular question or query.

Data Selection

  1. Quick access – Accessing data in a few steps may be helpful for users who want to find data quickly. Several data tools provide data quickly but may be limited in their selection options or customizable output.

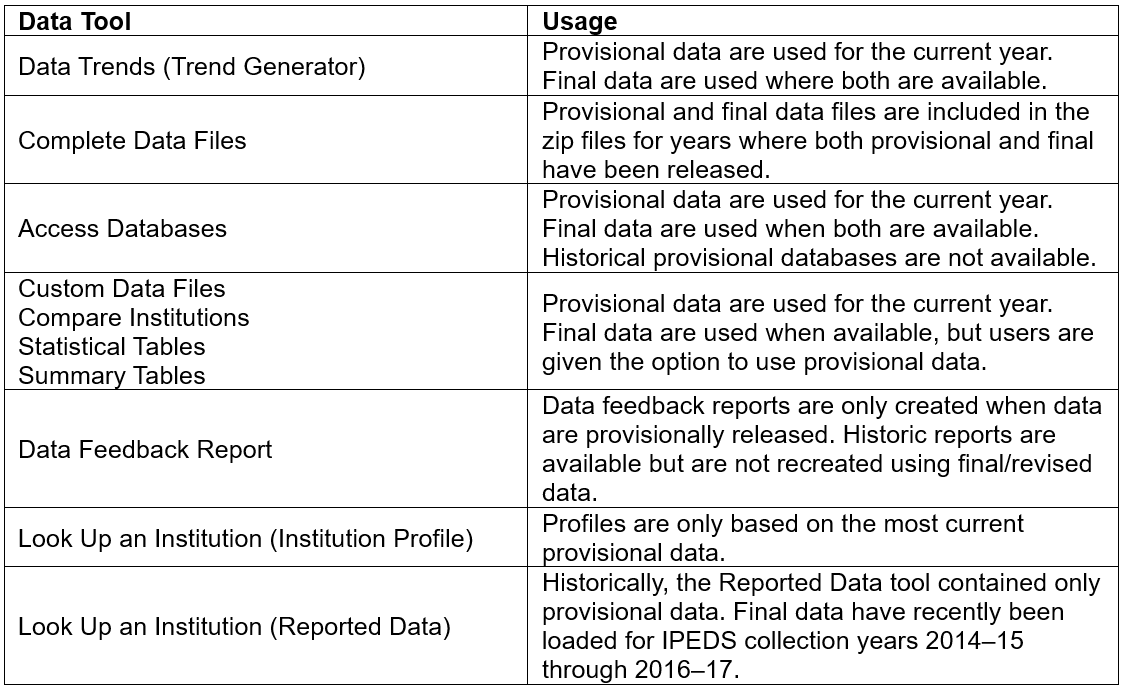
  2. Data release – IPEDS data are released to the public in two phases: Provisional and Final. Provisional data have undergone quality control procedures and imputation for missing data but have not been updated based on changes within the Prior Year Revision System. Final data reflect changes made within the Prior Year Revision System and additional quality control procedures and will not change. Some tools allow users to access only final data. Table 1 summarizes how provisional and final data are used by various data tools. The IPEDS resource page “Timing of IPEDS Data Collection, Coverage, and Release Cycle” provides more information on data releases.


    Table 1. How provisional and final data are used in various data tools

  1. Select institutions – Users may want to select specific institutions for their analyses. Several tools allow users to limit the output for a selected list of institutions while others include all institutions in the output.
     
  2. Multiple years – While some tools provide a single year of data, many tools provide access to multiple years of data in a single output.
     
  3. Raw data – Some data tools provide access to the raw data as submitted to IPEDS. For example, Look Up an Institution allows users access to survey forms submitted by an institution.
     
  4. Institution-level data – Many data tools provide data at the institution level, since this is the unit of analysis within the IPEDS system.
     
  5. All data available – Many data tools provide access to frequently used and derived variables, but others provide access to the entirety of variables collected within the IPEDS system.

Data Extraction

  1. Save/upload institutions – Several data tools allow a user to create and download a list of institutions, which can be uploaded in a future session.

  2. Save/upload variables – Two data tools allow a user to save the variables selected and upload in a future session.
     
  3. Export data – Many data tools allow a user to download data into a spreadsheet, while others provide information within a PDF. Note that several tools have limitations on the number of variables that can be downloaded in a session (e.g., Compare Institutions has a limit of 250 variables).
     
  4. Produce visuals – Several data tools produce charts, graphs, or other visualizations. For example, Data Trends provides users with the opportunity to generate a bar or line chart and text table.


Below is a graphic that summarizes these considerations for each IPEDS data tool (click the image to enlarge it). 


To find training opportunities—including video tutorials, workshops, and keyholder courses—check out the IPEDS Training Center. Plus, access the IPEDS Distance Learning Dataset Training modules for more guidance on how to use IPEDS data. For additional questions, call the IPEDS Data Use Help Desk at (866) 558-0658 or e-mail ipedstools@rti.org.


By Tara B. Lawley, NCES, and Eric S. Atchison, Arkansas State University System and Association for Institutional Research IPEDS Educator

Measuring Student Safety: New Data on Bullying Rates at School

NCES is committed to providing reliable and up-to-date national-level estimates of bullying. As such, a new set of web tables focusing on bullying victimization at school was just released.  

These tables use data from the School Crime Supplement to the National Crime Victimization Survey, which collects data on bullying by asking a nationally representative sample of students ages 12–18 who were enrolled in grades 6–12 in public and private schools if they had been bullied at school. This blog post highlights data from these newly released web tables.

Some 19 percent of students reported being bullied during the 2021–22 school year. More specifically, bullying was reported by 17 percent of males and 22 percent of females and by 26 percent of middle school students and 16 percent of high school students. Moreover, among students who reported being bullied, 14 percent of males and 28 percent of females reported being bullied online or by text.

Students were also asked about the recurrence and perpetrators of bullying and about the effects bullying has on them. During the 2021–22 school year, 12 percent of students reported that they were bullied repeatedly or expected the bullying to be repeated and that the bullying was perpetrated by someone who was physically or socially more powerful than them and who was not a sibling or dating partner. When these students were asked about the effects this bullying had on them,

  • 38 percent reported negative feelings about themselves;
  • 27 percent reported negative effects on their schoolwork;
  • 24 percent reported negative effects on their relationships with family and friends; and
  • 19 percent reported negative effects on their physical health.

Explore the web tables for more data on how bullying victimization varies by student characteristics (e.g., sex, race/ethnicity, grade, household income) and school characteristics (e.g., region, locale, enrollment size, poverty level) and how rates of bullying victimization vary by crime-related variables such as the presence of gangs, guns, drugs, alcohol, and hate-related graffiti at school; selected school security measures; student criminal victimization; personal fear of attack or harm; avoidance behaviors; fighting; and the carrying of weapons.

Find additional information on this topic in the Condition of Education indicator Bullying at School and Electronic Bullying. Plus, explore more School Crime and Safety data and browse the Report on Indicators of School Crime and Safety: 2022.

How Often Do High School Students Meet With Counselors About College? Differences by Parental Education and Counselor Caseload

There are many factors that can affect students’ decisions to apply to college, such as income, school engagement, and coursework.1 Similarly, previous research has reported that students whose parents did not hold a college degree (i.e., first-generation college students) enrolled in college at a lower rate than did peers whose parents held a college degree.2 However, high school counselors may help students choose colleges and apply to them, meaning that students who meet with a counselor about college could be more likely to attend college.3 Counselors may help potential first-generation college students plan for college by providing information that continuing-generation students already have access to via their parents who had attained college degrees themselves. Despite the potential benefits of meeting with a counselor, a school's counselor caseloads may affect its students' counseling opportunities.4

What percentage of high school students met with a counselor about college? How did this percentage vary by parental education and counselor caseload?

Around 47 percent of 2009 ninth-graders were potential first-generation college students whose parents did not hold a college degree (table U1). These students met with a counselor at a lower rate than did students whose parents held a college degree. Figure 1 shows that 72 percent of students whose parents did not hold a college degree met with a counselor, compared with 76 and 82 percent of students whose parents held an associate’s degree and a bachelor’s degree or higher, respectively.


Figure 1. Percentage of students who met with a counselor about college in 2012–13, by average counselor caseload level at the school and parents' highest education level

NOTE: Caseload is a continuous variable based on counselor reports of the average number of students per counselor at the school. Each caseload category accounts for roughly one-third of the sample in the unweighted data. Low caseload refers to counselors responsible for 40 to 299 students, medium caseload refers to counselors responsible for 300 to 399 students, and high caseload refers to counselors responsible for 400 or more students. The category high school degree or less incudes high school diploma or GED and those who started college but did not complete a degree. Respondents who did not know whether they met with a counselor are excluded from the analyses. These represent approximately 8 percent of weighted cases. 
SOURCE: U.S. Department of Education, National Center for Education Statistics, High School Longitudinal Study of 2009 (HSLS:09) Base year, First Follow-up, and 2013 update.


During the senior year of most of the cohort of 2009 ninth-graders, the average counselor caseload at schools attended by these students5 was 375 students per counselor. The average caseload at public schools was 388, and the average caseload at private schools was 202.

Students attending schools with low counselor caseloads met with a counselor about college at a higher rate than did students at schools with high counselor caseloads, when comparing students whose parents had similar attainment levels. For example, at schools with low caseloads, 79 percent of students whose parents held a high school degree or less met with a counselor about college, compared with 70 percent of these students at schools with high caseloads. This pattern is also true for students at schools with low caseloads compared with medium caseloads (i.e., 86 vs. 76 percent of students whose parents held an associate’s degree and 89 vs. 81 percent of students whose parents held a bachelor’s degree), except among students whose parents held a high school degree or less (79 percent was not statistically different from 74 percent). Finally, students whose parents held a high school degree or less met with a counselor at a lower rate than did students whose parents held a bachelor’s degree or higher in each caseload category (i.e., 79 vs. 89 percent for low caseload schools, 74 vs. 81 percent for medium caseload schools, and 70 vs. 77 percent for high caseload schools).

For more information about counselor meetings and college enrollment, check out this Data Point: High School Counselor Meetings About College, College Attendance, and Parental Education.

This blog post uses data from the High School Longitudinal Study of 2009 (HSLS:09), a national study of more than 23,000 ninth-graders and their school counselors in fall 2009. Student sample members answered surveys between 2009 and 2016. Sample members or their parents reported on whether the student met with a counselor about college during the 2012–13 school year (most students’ 12th-grade year).

While data presented here are the most recent data available on the topic, NCES will have new data on high schoolers’ experiences in the 2020s coming soon. In particular, data from the High School and Beyond Longitudinal Study of 2022 (HS&B:22), which also includes information about students’ visits to school counselors, is forthcoming.

Until those data are released, we recommend you access HSLS:09 student and counselor data to conduct your own analyses via NCES’s DataLab.


By Catharine Warner-Griffin, AnLar, and Elise Christopher, NCES


[1] See, for example, Fraysier, K., Reschly, A., and Appleton, J. (2020). Predicting Postsecondary Enrollment With Secondary Student Engagement Data. Journal of Psychoeducational Assessment, 38(7), 882–899.

[2] Cataldi, E. F., Bennett, C. T., and Chen, X. (2018). First-Generation Students: College Access, Persistence, and Postbachelor’s Outcomes (2018-421). U.S. Department of Education. Washington, DC: National Center for Education Statistics.

[3] Tang, A. K., and Ng, K. M. (2019). High School Counselor Contacts as Predictors of College Enrollment. Professional Counselor, 9(4), 347–357.

[4] Woods, C. S., and Domina, T. (2014). The School Counselor Caseload and the High School-to-College Pipeline. Teachers College Record, 116(10), 1–30.

[5] These schools are only those sampled in the base year (i.e., students’ 2009 schools).