A new NCES report has some good news about overall high school dropout and completion rates, but it also highlights some areas of concern.
Using a broad range of data, the recently released Trends in High School Dropout and Completion Rates in the United States report shows that the educational attainment of young adults has risen in recent decades. The public high school graduation rate is up, and the status dropout rate (the percentage of 16- to 24-year-olds who are not enrolled in school and have not completed high school) is down. Despite these encouraging trends, there are significant disparities in educational attainment among young adults in the United States. The report shines new light on these disparities by analyzing detailed data from the U.S. Census Bureau.
For large population groups, the report provides status dropout rates calculated using annual data from the American Community Survey (ACS), administered by the U.S. Census Bureau. For example, in 2017, some 5.4 percent of 16- to 24-year-olds who were not enrolled in high school lacked a high school diploma or equivalent credential.
For smaller population groups, there are not enough ACS respondents during any given year to allow for precise and reliable estimates of the high school status dropout rate. For these demographic subgroups, NCES pools the data from 5 years of the ACS in order to obtain enough respondents to accurately describe patterns in the dropout rate.
For example, while the overall status dropout rate for Asian 16- to 24-year-olds was below the national average in 2017, the rates for specific subgroups of Asian young adults varied widely. Based on 5 years of ACS data, high school status dropout rates among Asian 16- to 24-year-olds ranged from 1.1 percent for individuals of Korean descent to 23.2 percent for individuals of Burmese descent. These rates represent the “average” status dropout rate for the period from 2013 to 2017. They offer greater precision than the 1-year estimates, but the 5-year time span might make them difficult to interpret at first glance.
Figure 1. Percentage of high school dropouts among persons 16 through 24 years old (status dropout rate), by selected Asian subgroups: 2013–2017
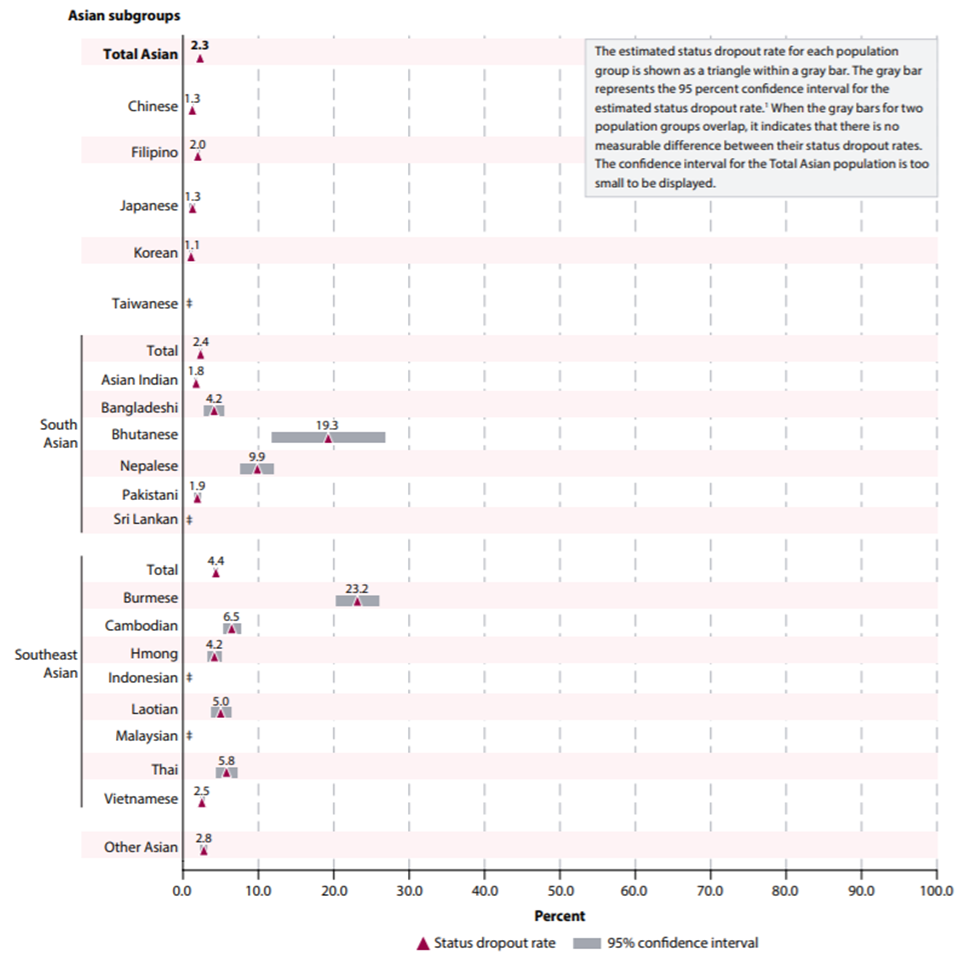
‡ Reporting standards not met. Either there are too few cases for a reliable estimate or the coefficient of variation (CV) is 50 percent or greater.
1 If the estimation procedure were repeated many times, 95 percent of the calculated confidence intervals would contain the true status dropout rate for the population group.
NOTE: “Status” dropouts are 16- to 24-year-olds who are not enrolled in school and who have not completed a high school program, regardless of when they left school. People who received an alternative credential such as a GED are counted as high school completers. This figure presents 5-year average status dropout rates for the period from 2013 to 2017. Use of a 5-year average increases the sample size, thereby reducing the sampling error and producing more stable estimates. Data are based on sample surveys of the entire population of 16- to 24-year-olds residing within the United States, including both noninstitutionalized persons (e.g., those living in households, college housing, or military housing located within the United States) and institutionalized persons (e.g., those living in prisons, nursing facilities, or other healthcare facilities). Estimates may differ from those based on the Current Population Survey (CPS) because of differences in survey design and target populations. Asian subgroups exclude persons of Hispanic ethnicity.
SOURCE: U.S. Department of Commerce, Census Bureau, American Community Survey (ACS), 2013–2017.
The 5-year ACS data can also be used to describe status dropout rates for smaller geographic areas with more precision than the annual ACS data. For example, the average 2013–2017 status dropout rates ranged from 3.8 percent in Massachusetts to 9.6 percent in Louisiana. The 5-year ACS data allowed us to calculate more accurate status dropout rates for each state and, in many cases, for racial/ethnic subgroups within the state. Access the complete state-level dropout rates by race/ethnicity here.
Figure 2. Percentage of high school dropouts among persons 16 through 24 years old (status dropout rate), by state: 2013–2017
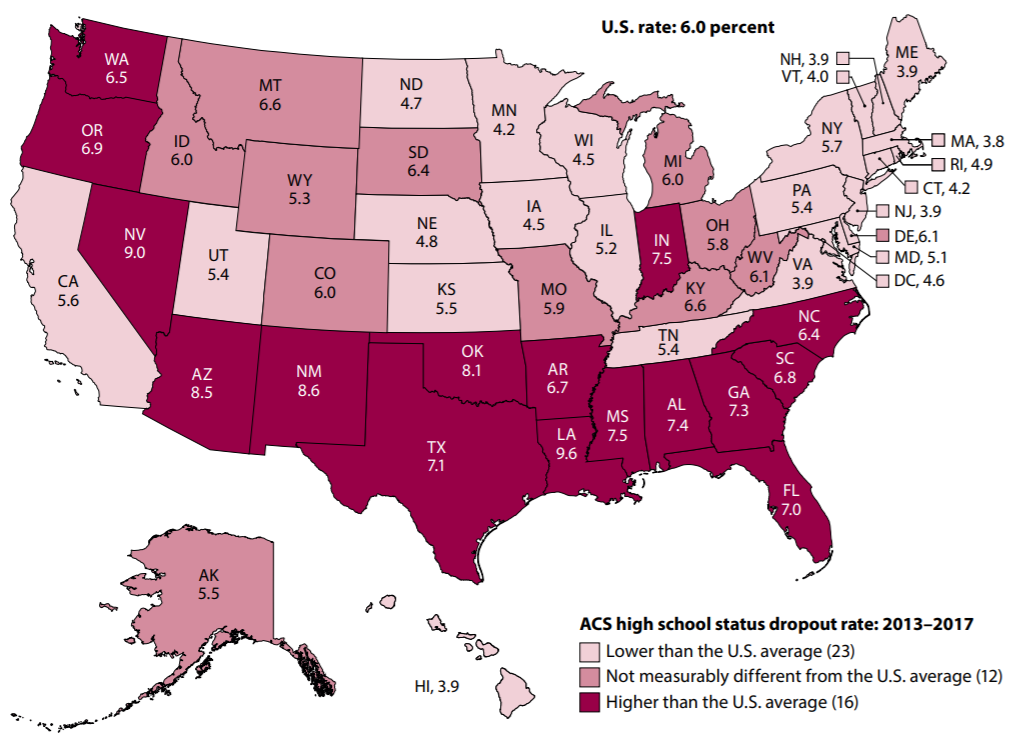
NOTE: “Status” dropouts are 16- to 24-year-olds who are not enrolled in school and who have not completed a high school program, regardless of when they left school. People who received an alternative credential such as a GED are counted as high school completers. This figure presents 5-year average status dropout rates for the period from 2013 to 2017. Use of a 5-year average increases the sample size, thereby reducing the sampling error and producing more stable estimates. Data are based on sample surveys of the entire population of 16- to 24-year-olds residing within the United States, including both noninstitutionalized persons (e.g., those living in households, college housing, or military housing located within the United States) and institutionalized persons (e.g., those living in prisons, nursing facilities, or other healthcare facilities). Estimates may differ from those based on the Current Population Survey (CPS) because of differences in survey design and target populations.
SOURCE: U.S. Department of Commerce, Census Bureau, American Community Survey (ACS), 2013–2017. See table 2.3.
For more information about high school dropout and completion rates, check out the recently released Trends in High School Dropout and Completion Rates in the United States report. For more information about the 5-year ACS datasets, visit https://www.census.gov/programs-surveys/acs/guidance/estimates.html.
By Joel McFarland