NCES Blog

National Center for Education Statistics

Celebrating the ECLS-K:2024: Providing Key National Data on Our Country’s Youngest Learners

It’s time to celebrate!

This spring, the Early Childhood Longitudinal Study, Kindergarten Class of 2023–24 (ECLS-K:2024) is wrapping up its first school year of data collection with tens of thousands of children in hundreds of schools across the nation. You may not know this, but NCES is congressionally mandated to collect data on early childhood. We meet that charge by conducting ECLS program studies like the ECLS-K:2024 that follow children through the early elementary grades. Earlier studies looked at children in the kindergarten classes of 1998–99 and 2010–11. We also conducted a study, the Early Childhood Longitudinal Study, Birth Cohort (ECLS-B), that followed children from birth through kindergarten entry.

As the newest ECLS program study, the ECLS-K:2024 will collect data from both students and adults in these students’ lives (e.g., parents, teachers, school administrators) to help us better understand how different factors at home and at school relate to children’s development and learning. In fact, the ECLS-K:2024 allows us to provide data not only on the children in the cohort but also on kindergarten teachers and the schools that educate kindergartners.

What we at NCES think is worthy of celebrating is that the ECLS-K:2024—like other ECLS program studies,

  • provides the statistics policymakers need to make data-driven decisions to improve education for all;
  • contributes data that researchers need to answer today’s most pressing questions related to early childhood and early childhood education; and
  • allows us to produce resources for parents, families, teachers, and schools to better inform the public at large about children’s education and development.

Although smaller-scale studies can answer numerous questions about education and development, the ECLS-K:2024 allows us to provide answers at a national level. For example, you may know that children arrive to kindergarten with different skills and abilities, but have you ever wondered how those skills and abilities vary for children who come from different areas of the country? How they vary for children who attended prekindergarten programs versus those who did not? How they vary for children who come from families of different income levels? The national data from the ECLS-K:2024 allow us to dive into these—and other—issues.

The ECLS-K:2024 is unique in that it’s the first of our early childhood studies to provide data on a cohort of students who experienced the coronavirus pandemic. How did the pandemic affect these children’s early development and how did it change the schooling they receive? By comparing the experiences of the ECLS-K:2024 cohort to those of children who were in kindergarten nearly 15 and 25 years ago, we’ll be able to answer these questions.

What’s more, the ECLS-K:2024 will provide information on a variety of topics not fully examined in previous national early childhood studies. The study is including new items on families’ kindergarten selection and choice; availability and use of home computers and other digital devices; parent-teacher association/organization contributions to classrooms; equitable school practices; and a myriad of other constructs.

Earlier ECLS program studies have had a huge impact on our understanding of child development and early education, with hundreds of research publications produced using their data (on topics such as academic skills and school performance; family activities that promote learning; and children’s socioemotional development, physical health, and well-being). ECLS data have also been referenced in media outlets and in federal and state congressional reports. With the launch of the ECLS-K:2024, we cannot wait to see the impact of research using the new data.

Want to learn more? 

Plus, be on the lookout late this spring for the next ECLS blog post celebrating the ECLS-K:2024, which will highlight children in the study. Future blog posts will focus on parents and families and on teachers and schools. Stay tuned!


By Jill McCarroll and Korrie Johnson, NCES

Education at a Glance 2023: Putting U.S. Data in a Global Context

International comparisons provide reference points for researchers and policy analysts to understand trends and patterns in national education data and are very important as U.S. students compete in an increasingly global economy.

Education at a Glance (EAG), an annual publication produced by the Organization for Economic Cooperation and Development (OECD), provides data on the structure, finances, and progress of education systems in 38 OECD countries—including the United States—as well as a number of OECD accession and partner countries. Data presented in EAG on topics of high policy interest in the United States are also featured in NCES reports, including the Condition of Education and Digest of Education Statistics.  

The recently released 2023 edition of EAG shows that the United States is above the international average on some measures, such as funding of postsecondary education, but lags behind in others, such as participation in early childhood education and care (ECEC). The 2023 report also features a Spotlight on Vocational Education and Training as well as interactive data dashboards on ECEC systems, upper secondary education systems, and educational support for Ukrainian refugees.


Spotlight on Vocational Education and Training (VET)

Each EAG edition centers on a particular theme of high policy relevance in OECD countries. The focus of this year’s report is VET programs, which look very different in the United States compared with many other OECD countries. Unlike in many OECD countries, most high schools in the United States do not offer a separate, distinct vocational track at the upper secondary (high school) level. Instead, vocational education is available as optional career and technical education (CTE) courses throughout high school. Regardless of whether they choose to take CTE courses, all U.S. students who complete high school have the same potential to access postsecondary programs. In other OECD countries, selecting a vocational track at this level may lead to different postsecondary opportunities. Check out the 2023 EAG Spotlight for an overview of VET programs across OECD countries.


Highlights From EAG 2023

Below is a selection of topics from the EAG report highlighting how key education benchmarks in the United States compare with other OECD countries.


Postsecondary Educational Attainment

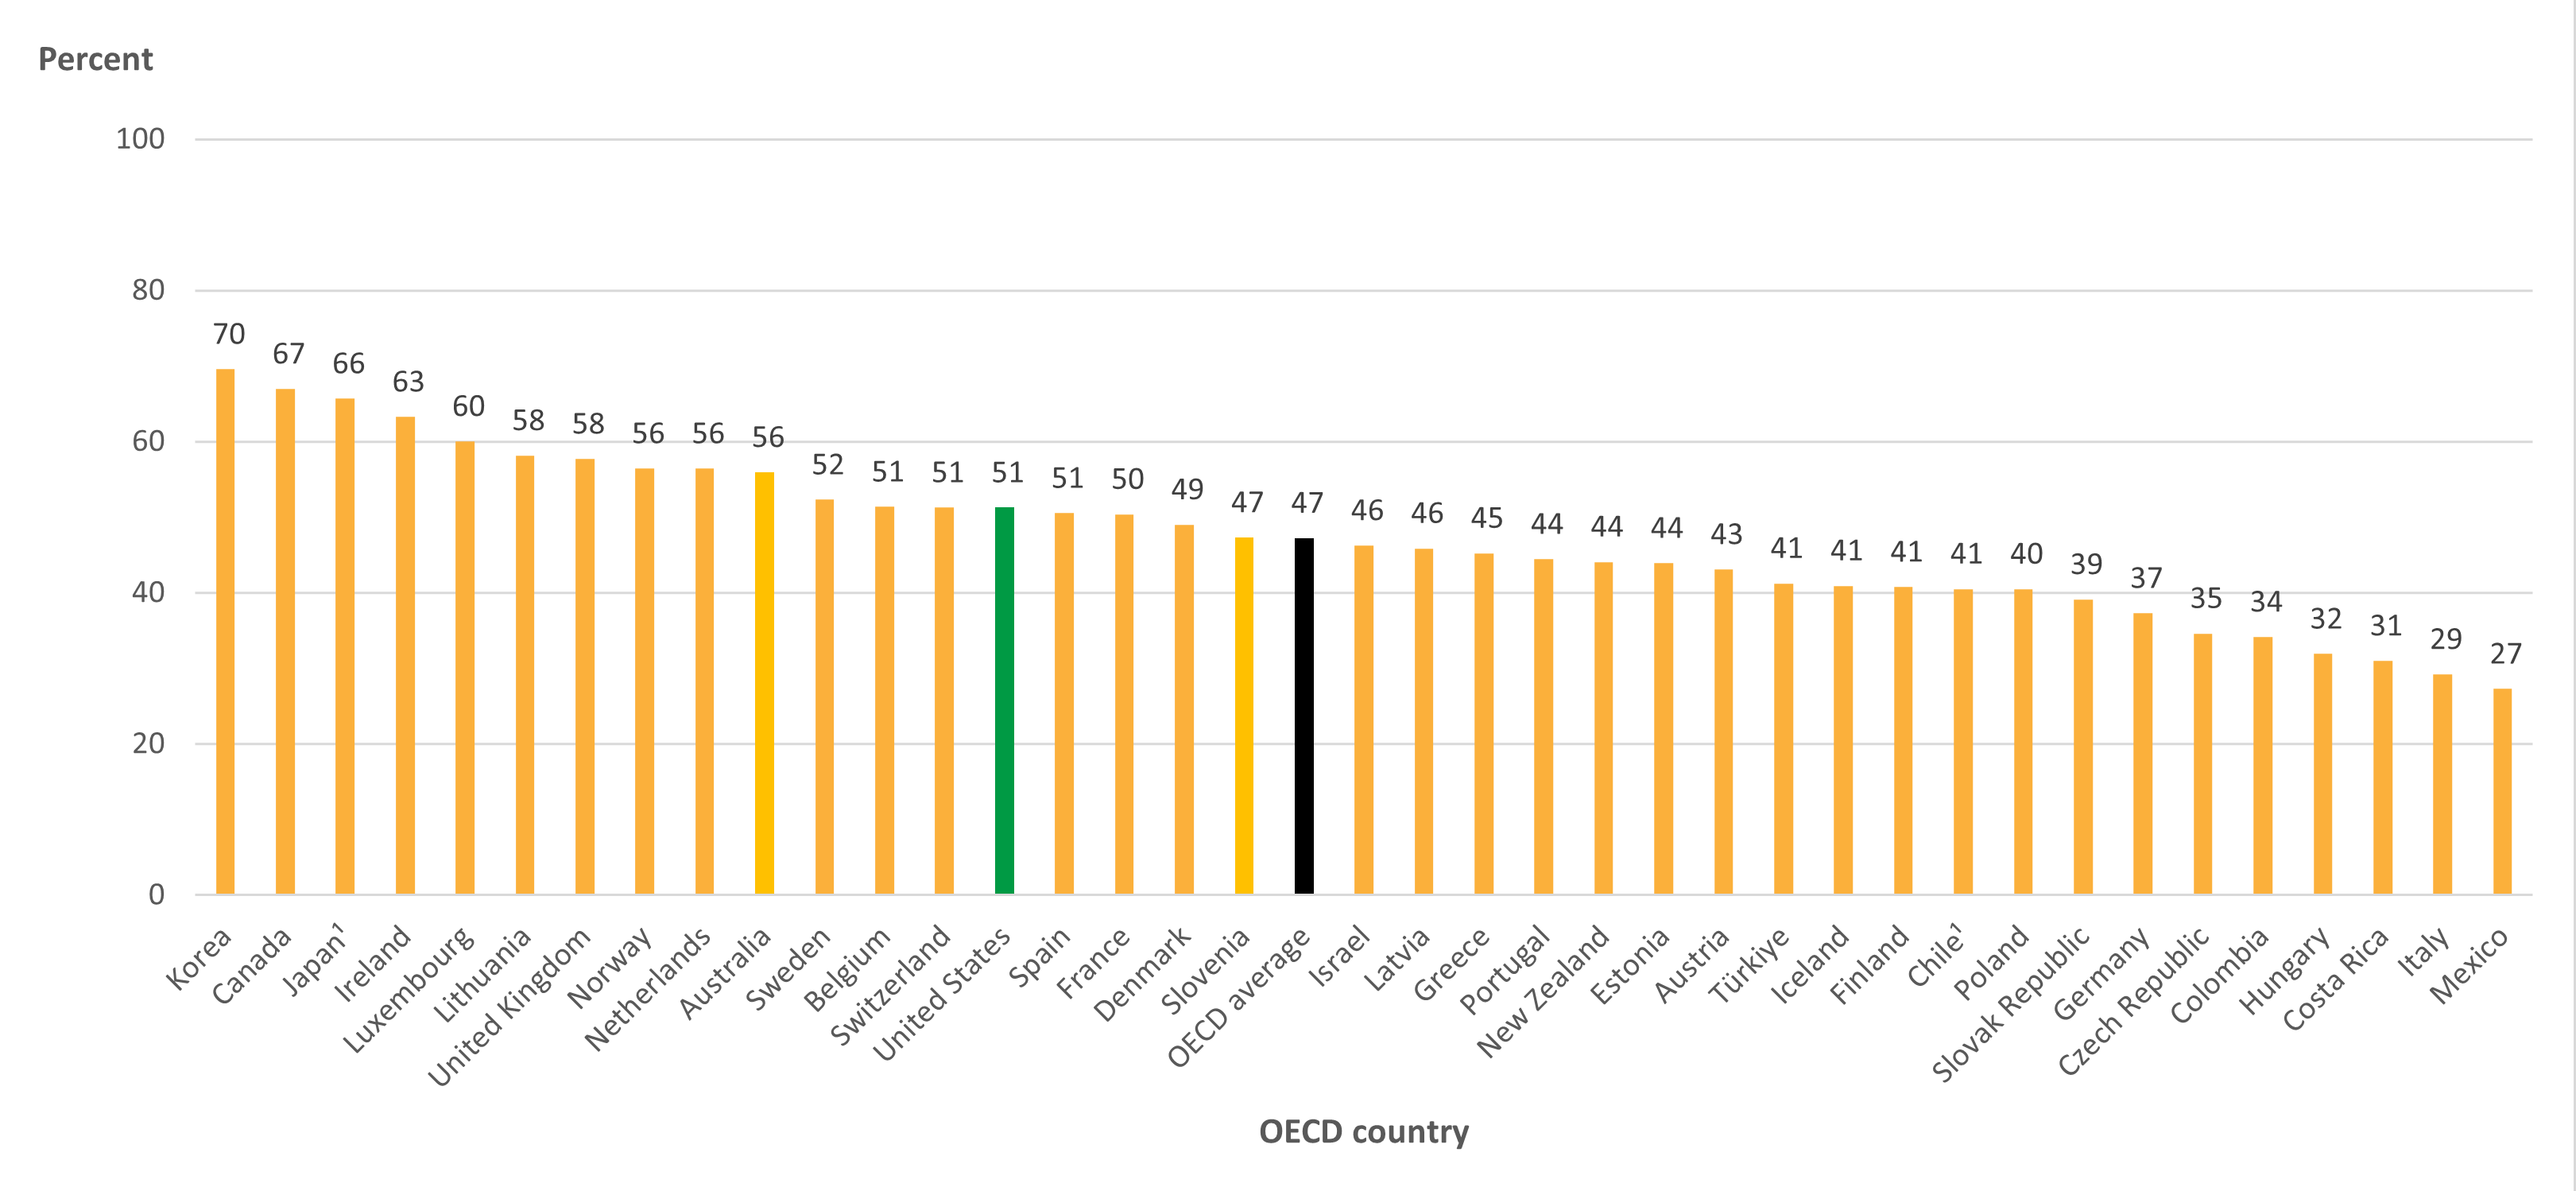
The percentage of U.S. 25- to 34-year-olds with a postsecondary degree increased by 13 percentage points between 2000 and 2022, reaching 51 percent (the OECD average in 2022 was 47 percent) (Table A1.3).1 In this age group in the United States, higher percentages of women than men attained a postsecondary degree (56 vs. 46 percent) (Table A1.2). Across OECD countries, the average postsecondary educational attainment gap between 25- to 34-year-old men and women in 2022 (13 percentage points) was wider than the gap in the United States (10 percentage points). In the United States, the postsecondary attainment rate for 25- to 34-year-old men was 5 percentage points higher than the OECD average, and the attainment rate for women was 3 percentage points higher than the OECD average.


Figure 1. Percentage of 25- to 34-year-olds with a postsecondary degree, by OECD country: 2022

[click to enlarge image]
Data include a small percentage of adults with lower levels of attainment.
Year of reference differs from 2022. Refer to the source table for more details.
SOURCE: OECD (2023), Table A1.3. See Source section for more information and Annex 3 for notes.


International Student Enrollment

The United States is the top OECD destination country for international students enrolling in postsecondary education. In 2021, some 833,204 foreign students were enrolled in postsecondary programs in the United States, representing 13 percent of the international education market share (Table B6.1).2 In comparison, the United Kingdom had the second highest number of international students enrolled in postsecondary education in 2021, representing 9 percent of the international education market share. Interestingly, when examining enrollment trends over the past 3 years (2019 to 2021), foreign student enrollment decreased by 143,649 students (15 percent) in the United States but increased by 111,570 students (23 percent) in the United Kingdom. International student enrollment during these years was likely affected by the coronavirus pandemic, which had large impacts on global travel in 2020 and 2021.


Education Spending

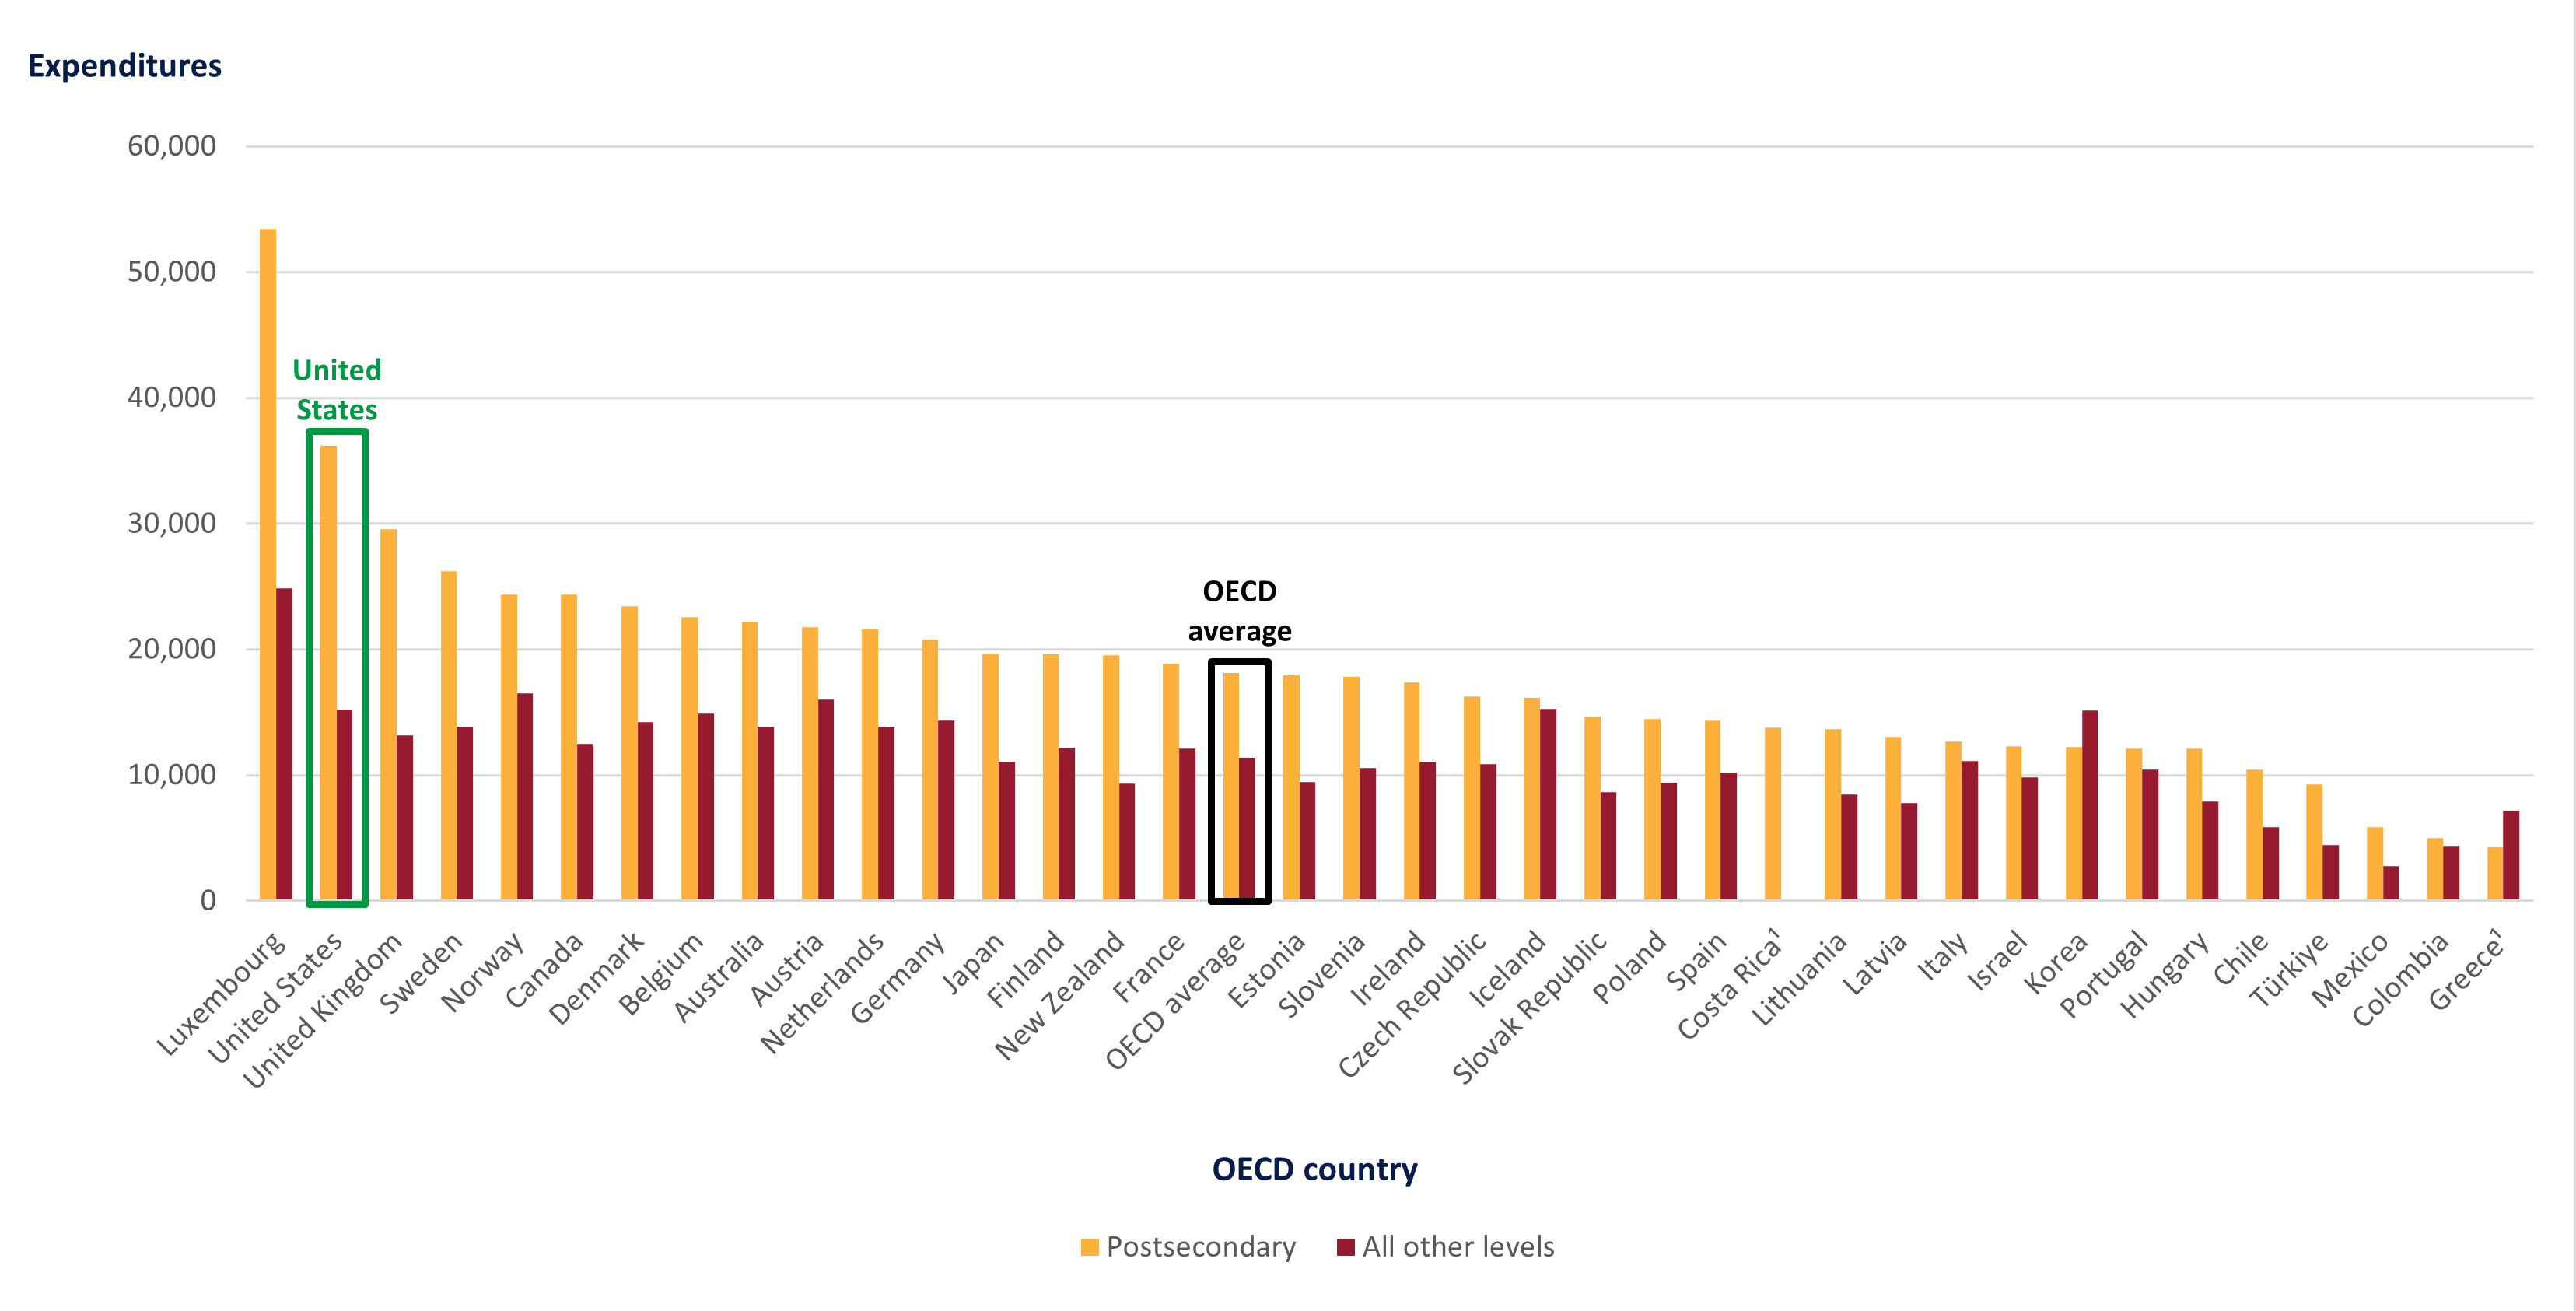
U.S. spending on education is relatively high across all levels of education compared with the OECD average. The largest difference is in postsecondary spending, where the United States spent $36,172 per full-time postsecondary student in 2020, the second highest amount after Luxembourg ($53,421) and nearly double the OECD average ($18,105) (Table C1.1).3 This spending on postsecondary education amounts to 2.5 percent of the U.S. GDP, higher than the OECD average (1.5 percent) (Table C2.1). These total expenditures include amounts received from governments, students, and all other sources.


Figure 2. Expenditures per full-time equivalent student, by education level and OECD country: 2020

[click to enlarge image]
1 Year of reference differs from 2020. Refer to the source table for more details.
SOURCE: OECD (2023), Table C1.1. See Source section for more information and Annex 3 for notes.


High School Completion Rate

The United States has a higher upper secondary (high school) completion rate than most other OECD countries. In 2021, some 87 percent of U.S. students completed their high school program in the expected timeframe, compared with the OECD average of 72 percent (Table B3.1).


Early Childhood Education

The level of participation in early childhood education programs in the United States is below the OECD average. In 2021, average enrollment rates across OECD countries were 72 percent for 3-year-olds, 87 percent for 4-year-olds, and 84 percent for 5-year-olds (Table B2.1). In contrast, enrollment rates for students of these ages in the United States were 30 percent for 3-year-olds, 50 percent for 4-years-olds, and 81 percent for 5-year-olds.  


Browse the full EAG 2023 report to see how the United States compares with other countries on these and other important education-related topics.


By RaeAnne Friesenhahn, AIR, and Cris De Brey, NCES


[1] EAG data for the year 2000 can be accessed via the online OECD Stat database.

[2] Unrounded data in Excel format can be accessed via the StatLink located below each table.

[3] Expenditure in national currencies was converted into equivalent USD by dividing the national currency figure by the purchasing power parity (PPP) index for GDP. For more details on methodology see Annex 2 and Annex 3.

What Do NCES Data Tell Us About America’s Kindergartners?

Happy Get Ready for Kindergarten Month! 

For more than 20 years, the National Center for Education Statistics (NCES) has been collecting information about kindergartners’ knowledge and skills as part of the Early Childhood Longitudinal Studies (ECLS) program.

The first ECLS, the Early Childhood Longitudinal Study, Kindergarten Class of 1998–99 (ECLS-K), focused on children in kindergarten in the 1998–99 school year. At the time the ECLS-K began, no large national study focused on education had followed a cohort of children from kindergarten entry through the elementary school years. Some of today’s commonly known information about young children, such as the information about kindergartners’ early social and academic skills shown in the infographics below, comes out of the ECLS-K. For example, we all know that children arrive at kindergarten with varied knowledge and skills; the ECLS-K was the first study to show at a national level that this was the case and to provide the statistics to highlight the differences in children’s knowledge and skills by various background factors.


The second ECLS kindergarten cohort study, the Early Childhood Longitudinal Study, Kindergarten Class of 2010–11 (ECLS-K:2011), is the ECLS-K’s sister study. This study followed the students who were in kindergarten during the 2010–11 school year. The ECLS-K:2011, which began more than a decade after the inception of the ECLS-K, allows for comparisons of children in two nationally representative kindergarten classes experiencing different policy, educational, and demographic environments. For example, significant changes that occurred between the start of the ECLS-K and the start of the ECLS-K:2011 include the passage of No Child Left Behind legislation, a rise in school choice, and an increase in English language learners. 

From the parents of children in the ECLS-K:2011, we learned how much U.S. kindergartners like school, as shown in the following infographic.


The ECLS program studies also provide information on children’s home learning environments and experiences outside of school that may contribute to learning. For example, we learned from the ECLS-K:2011 what types of activities kindergartners were doing with their parents at least once a month (see the infographic below).


Infographic titled How do kindergarteners like school?


What’s next for ECLS data collections on kindergartners? NCES is excited to be getting ready to launch our next ECLS kindergarten cohort study, the Early Childhood Longitudinal Study, Kindergarten Class of 2023–24 (ECLS-K:2024)

Before the ECLS-K:2024 national data collections can occur, the ECLS will conduct a field test—a trial run of the study to test the study instruments and procedures—in the fall of 2022.

If you, your child, or your school are selected for the ECLS-K:2024 field test or national study, please participate! While participation is voluntary, it is important so that the study can provide information that can be used at the local, state, and national levels to guide practice and policies that increase every child’s chance of doing well in school. The ECLS-K:2024 will be particularly meaningful, as it will provide important information about the experiences of children whose early lives were shaped by the COVID-19 pandemic.

Watch this video to learn more about participation in the ECLS-K:2024. For more information on the ECLS studies and the data available on our nation’s kindergartners, see the ECLS homepage, review our online training modules, or email the ECLS study team.


By Jill Carlivati McCarroll, NCES

Announcing the Condition of Education 2022 Release

NCES is pleased to present the 2022 edition of the Condition of Education. The Condition is part of a 150-year tradition at NCES and provides historical and contextual perspectives on key measures of educational progress to Congress and the American public. This report uses data from across NCES and from other sources and is designed to help policymakers and the public monitor the latest developments and trends in U.S. education.

Cover of Report on the Condition of Education with IES logo and photos of children reading and writing

The foundation of the Condition of Education is a series of online indicators. Fifty-two of these indicators include content that has been updated this year. Each indicator provides detailed information on a unique topic, ranging from prekindergarten through postsecondary education, as well as labor force outcomes and international comparisons. In addition to the online indicator system, a synthesized overview of findings across topics is presented in the Report on the Condition of Education.

This year, we are excited to begin the rollout of interactive figures. These new interactive figures will empower users to explore the data in different ways. A selection of these indicators are highlighted here. They show various declines in enrollment that occurred during the coronavirus pandemic, from early childhood through postsecondary education. (Click the links below to explore the new interactive figures!)

  • From 2019 to 2020, enrollment rates of young children fell by 6 percentage points for 5-year-olds (from 91 to 84 percent) and by 13 percentage points for 3- to 4-year-olds (from 54 to 40 percent).
  • Public school enrollment in prekindergarten through grade 12 dropped from 50.8 million in fall 2019 to 49.4 million students in fall 2020. This 3 percent drop brought total enrollment back to 2009 levels (49.4 million), erasing a decade of steady growth.
  • At the postsecondary level, total undergraduate enrollment decreased by 9 percent from fall 2009 to fall 2020 (from 17.5 million to 15.9 million students). For male and female students, enrollment patterns exhibited similar trends between 2009 and 2019 (both decreasing by 5 percent). However, from 2019 to 2020, female enrollment fell 2 percent, while male enrollment fell 7 percent. Additionally, between 2019 and 2020, undergraduate enrollment fell 5 percent at public institutions and 2 percent at private nonprofit institutions. In contrast, undergraduate enrollment at for-profit institutions was 4 percent higher in fall 2020 than in fall 2019, marking the first positive single year change in enrollments at these institutions since 2010. Meanwhile, at the postbaccalaureate level, enrollment increased by 10 percent between fall 2009 and fall 2020 (from 2.8 million to 3.1 million students).
  • Educational attainment is associated with economic outcomes, such as employment and earnings, as well as with changes in these outcomes during the pandemic. Compared with 2010, employment rates among 25- to 34-year-olds were higher in 2021 only for those with a bachelor’s or higher degree (84 vs 86 percent). For those who had completed high school and those with some college, employment rates increased from 2010 to 2019, but these gains were reversed to 68 and 75 percent, respectively, during the coronavirus pandemic. For those who had not completed high school, the employment rate was 53 percent in 2021, which was not measurably different from 2019 or 2010.

This year’s Condition also includes two spotlight indicators. These spotlights use data from the Household Pulse Survey (HPS) to examine education during the coronavirus pandemic.

  • Homeschooled Children and Reasons for HomeschoolingThis spotlight opens with an examination of historical trends in homeschooling, using data from the National Household Education Survey (NHES). Then, using HPS, this spotlight examines the percentage of adults with students under 18 in the home who were homeschooled during the 2020–21 school year. Some 6.8 percent of adults with students in the home reported that at least one child was homeschooled in 2020–21. The percentage was higher for White adults (7.4 percent) than for Black adults (5.1 percent) and for Asian adults (3.6 percent). It was also higher for Hispanic adults (6.5 percent) than for Asian adults.
  • Impact of the Coronavirus Pandemic on Fall Plans for Postsecondary Education: This spotlight uses HPS data to examine changes in plans for fall 2021 postsecondary education made in response to the coronavirus pandemic. Among adults 18 years old and over who had household members planning to take classes in fall 2021 from a postsecondary institution, 44 percent reported that there was no change for any household member in their fall plans for postsecondary classes. This is compared with 28 percent who reported no change in plans for at least one household member one year earlier in the pandemic, for fall 2020.

The Condition also includes an At a Glance section, which allows readers to quickly make comparisons within and across indicators, as well as a Reader’s Guide, a Glossary, and a Guide to Sources that provide additional information to help place the indicators in context. In addition, each indicator references the source data tables that were used to produce that indicator. Most of these are in the Digest of Education Statistics.

In addition to publishing the Condition of Education, NCES produces a wide range of other reports and datasets designed to help inform policymakers and the public about significant trends and topics in education. More information about the latest activities and releases at NCES may be found on our website or by following us on Twitter, Facebook, and LinkedIn.


By Peggy G. Carr, NCES Commissioner

NCES Releases New Edition of the Digest of Education Statistics

NCES recently released the 2020 edition of the Digest of Education Statistics, the 56th in a series of publications initiated in 1962. The Digest—which provides a centralized location for a wide range of statistical information covering early childhood through adult education—tells the story of American education through data. Digest tables are the foundation of many NCES reports, including the congressionally mandated Condition of Education, which contains key indicators that describe and visualize important developments and trends.

The Digest includes data tables from many sources, both government and private, and draws especially on the results of surveys and activities carried out by NCES. In addition, the Digest serves as one of the only NCES reports where data from across nearly 200 sources—including other statistical agencies like the Bureau of Labor Statistics and the Census Bureau—are compiled. The publication contains data on a variety of subjects in the field of education statistics, including the number of schools and colleges, teachers, enrollments, and graduates, in addition to data on educational attainment, finances, federal funds for education, libraries, and international comparisons. A helpful feature of the Digest is its ability to provide long-term trend data. Several tables include data that were collected more than 50—or even 100—years ago:

  • Poverty status of all persons, persons in families, and related children under age 18, by race/ethnicity: Selected years, 1960 through 2019 (table 102.50)
  • Percentage of the population 3 to 34 years old enrolled in school, by age group: Selected years, 1940 through 2019 (table 103.20)
  • Rates of high school completion and bachelor's degree attainment among persons age 25 and over, by race/ethnicity and sex: Selected years, 1910 through 2020 (table 104.10)
  • Historical summary of faculty, enrollment, degrees conferred, and finances in degree-granting postsecondary institutions: Selected years, 1869-70 through 2018-19 (table 301.20)
  • Federal support and estimated federal tax expenditures for education, by category: Selected fiscal years, 1965 through 2019 (table 401.10)

The Digest is organized into seven chapters: All Levels of Education, Elementary and Secondary Education, Postsecondary Education, Federal Funds for Education and Related Activities, Outcomes of Education, International Comparisons of Education, and Libraries and Use of Technology. Each chapter is divided into a number of topical subsections. The Digest also includes a Guide to Sources and a Definitions section to provide supplemental information to readers. To learn more about how the Digest is structured and how best to navigate it—including how to access the most current tables or tables from a specific year and how to search for key terms—check out the blog post “Tips for Navigating the Digest of Education Statistics.”

In addition to providing updated versions of many statistics that have appeared in previous years, this edition also includes several new tables, many of which highlight data related to the coronavirus pandemic:

  • Percentage of adults with children in the household who reported their child’s classes were moved to a distance learning format using online resources in selected periods during April through December 2020, by selected adult and household characteristics (table 218.80)
  • Percentage of adults with children in the household who reported that computers and internet access were always or usually available for educational purposes in their household in selected periods during April through December 2020, by selected adult and household characteristics (table 218.85)
  • Percentage of adults with children in the household who reported that computers or digital devices and internet access were provided by their child’s schools or districts in selected periods during April through December 2020, by selected adult and household characteristics (table 218.90)
  • Number of school shootings at public and private elementary and secondary schools between 2000-01 and 2019-20, by location and time period (table 228.14)
  • Percentage of adults who reported changes to household members’ fall postsecondary plans in August 2020, by level of postsecondary education planned and selected respondent characteristics (table 302.80)
  • Percentage of adults with at least one household member’s fall attendance plans cancelled who reported on reasons for changes in plans in August 2020, by level of postsecondary education planned and selected respondent characteristics (table 302.85)

Also new this year is the release of more than 200 machine-readable Digest tables, with more to come at a later date. These tables allow the data to be read in a standard format, making them easier for developers and researchers to use. To learn more about machine-readable tables, check out the blog post “Machine-Readable Tables for the Digest of Education Statistics.

Learn more about the Digest in the Foreword to the publication and explore the tables in this edition.


By Megan Barnett, AIR