NCES Blog

National Center for Education Statistics

NCES’s Top Hits of 2019

As 2019 comes to an end, we’re taking stock of NCES’s most downloaded reports, most viewed indicators, Fast Facts, and blog posts, and most engaging tweets over the past year. As you reflect on 2019 and kick off 2020, we encourage you to take a few minutes to explore the wide range of education data NCES produces.


Top Five Reports, by PDF downloads

1. Condition of Education 2019 (8,526)

2. Condition of Education 2018 (5,789)

3Status and Trends in the Education of Racial and Ethnic Groups 2018 (4,743)

4. Student Reports of Bullying: Results From the 2015 School Crime Supplement to the National Crime Victimization Survey (4,587)

5. Digest of Education Statistics 2017 (4,554)


Top Five indicators from the Condition of Education, by number of web sessions

1. Children and Youth With Disabilities (86,084)

2. Public High School Graduation Rates (68,977)

3. Undergraduate Enrollment (58,494)

4. English Language Learners in Public Schools (50,789)

5. Education Expenditures by Country (43,474)


Top Five Fast Facts, by number of web sessions

1. Back to School Statistics (227,510)

2. College Graduate Rates (109,617)

3. Tuition Costs of Colleges and Universities (107,895)

4. College Endowments (71,056)

5. High School Dropout Rates (67,408)


Top Five Blog Posts, by number of web sessions

1. Free or Reduced Price Lunch: A Proxy for Poverty? (5,522)

2. Explore Data on Mental Health Services in K–12 Public Schools for Mental Health Awareness Month (4,311)

3. Educational Attainment Differences by Students’ Socioeconomic Status (3,903)

4. Education and Training Opportunities in America’s Prisons (3,877)

5. Measuring Student Safety: Bullying Rates at School (3,706)


Top Five Tweets, by number of impressions

1. Condition of Education (45,408 impressions)


2. School Choice in the United States (44,097 impressions)


3. NAEP Music and Visual Arts Assessment (32,440 impressions)


4. International Education Week (29,997 impressions)


5. Pop Quiz (25,188 impressions)


Be sure to check our blog site and the NCES website in 2020 to keep up-to-date with NCES’s latest activities and releases. You can also follow NCES on Twitter, Facebook, and LinkedIn for daily updates and content.


By Thomas Snyder

Differences in Postsecondary Enrollment and Employment by Socioeconomic Status

New data suggest that the socioeconomic status of high school freshmen plays a role in their future education and employment.  

The data come from the NCES High School Longitudinal Study of 2009 (HSLS:09), which follows a nationally representative group of ninth-graders. In 2009, NCES measured the socioeconomic status (SES) of these students by collecting data on the income, occupation, and educational attainment of their parents or guardians. In 2016, NCES conducted a follow-up survey with the 2009 ninth-graders, gathering data on their educational and employment status.   

Data show that 2009 ninth-graders who were in the lowest-SES category were 20 percentage points more likely to be neither enrolled in postsecondary education nor working in 2016 than those in the highest-SES category (figure 1). These students were also 50 percentage points less likely to be enrolled in postsecondary institutions than those in the highest-SES category (figure 2).


These findings are just a glimpse into the insights on socioeconomic mobility that HSLS:09 can generate by linking data on parent and child educational attainment and employment.

Check out our recent spotlight indicator in the Condition of Education for more information on how the educational and employment outcomes of young adults varied in relation to family socioeconomic status.


By Joel McFarland


Announcing the Condition of Education 2019 Release

We are pleased to present The Condition of Education 2019, a congressionally mandated annual report summarizing the latest data on education in the United States. This report is designed to help policymakers and the public monitor educational progress. This year’s report includes 48 indicators on topics ranging from prekindergarten through postsecondary education, as well as labor force outcomes and international comparisons.

In addition to the regularly updated annual indicators, this year’s spotlight indicators show how recent NCES surveys have expanded our understanding of outcomes in postsecondary education.

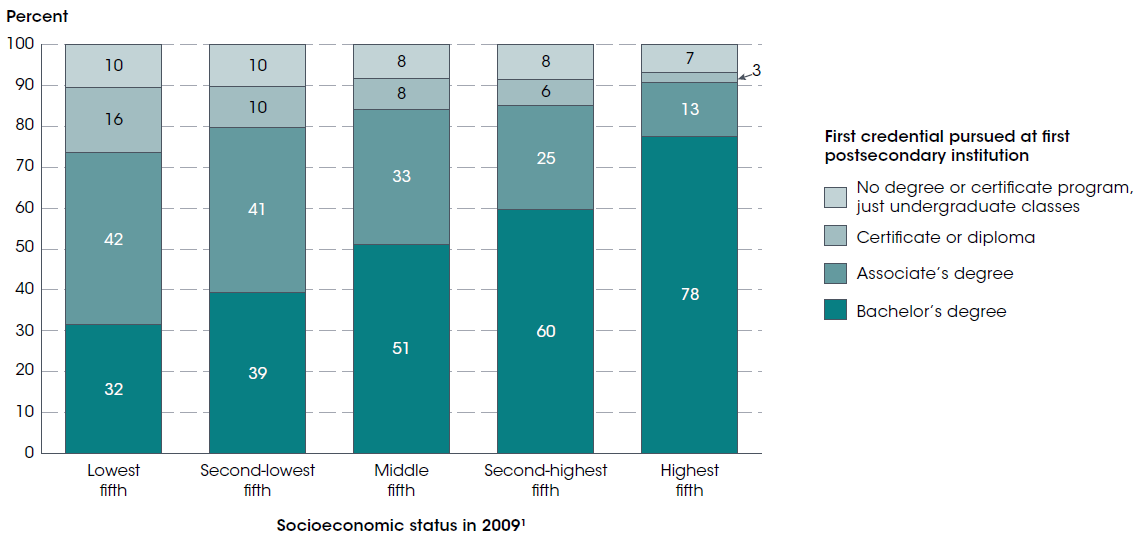
The first spotlight examines the variation in postsecondary enrollment patterns between young adults who were raised in high- and low-socioeconomic status (SES) families. The study draws on data from the NCES High School Longitudinal Study of 2009, which collected data on a nationally representative cohort of ninth-grade students in 2009 and has continued to survey these students as they progress through postsecondary education. The indicator finds that the percentage of 2009 ninth-graders who were enrolled in postsecondary education in 2016 was 50 percentage points larger for the highest SES students (78 percent) than for the lowest SES students (28 percent). Among the highest SES 2009 ninth-graders who had enrolled in a postsecondary institution by 2016, more than three-quarters (78 percent) first pursued a bachelor’s degree and 13 percent first pursued an associate’s degree. In contrast, the percentage of students in the lowest SES category who first pursued a bachelor’s degree (32 percent) was smaller than the percentage who first pursued an associate’s degree (42 percent). In addition, the percentage who first enrolled in a highly selective 4-year institution was larger for the highest SES students (37 percent) than for the lowest SES students (7 percent).

The complete indicator, Young Adult Educational and Employment Outcomes by Family Socioeconomic Status, contains more information about how enrollment, persistence, choice of institution (public, private nonprofit, or private for-profit and 2-year or 4-year), and employment varied by the SES of the family in which young adults were raised.


Among 2009 ninth-graders who had enrolled in postsecondary education by 2016, percentage distribution of students' first credential pursued at first postsecondary institution, by socioeconomic status: 2016
1 Socioeconomic status was measured by a composite score of parental education and occupations and family income in 2009.
NOTE: Postsecondary outcomes are as of February 2016, approximately 3 years after most respondents had completed high school. Although rounded numbers are displayed, the figures are based on unrounded data. Detail may not sum to totals because of rounding.

SOURCE: U.S. Department of Education, National Center for Education Statistics, High School Longitudinal Study of 2009 (HSLS:09), Base Year and Second Follow-up. See Digest of Education Statistics 2018, table 302.44.


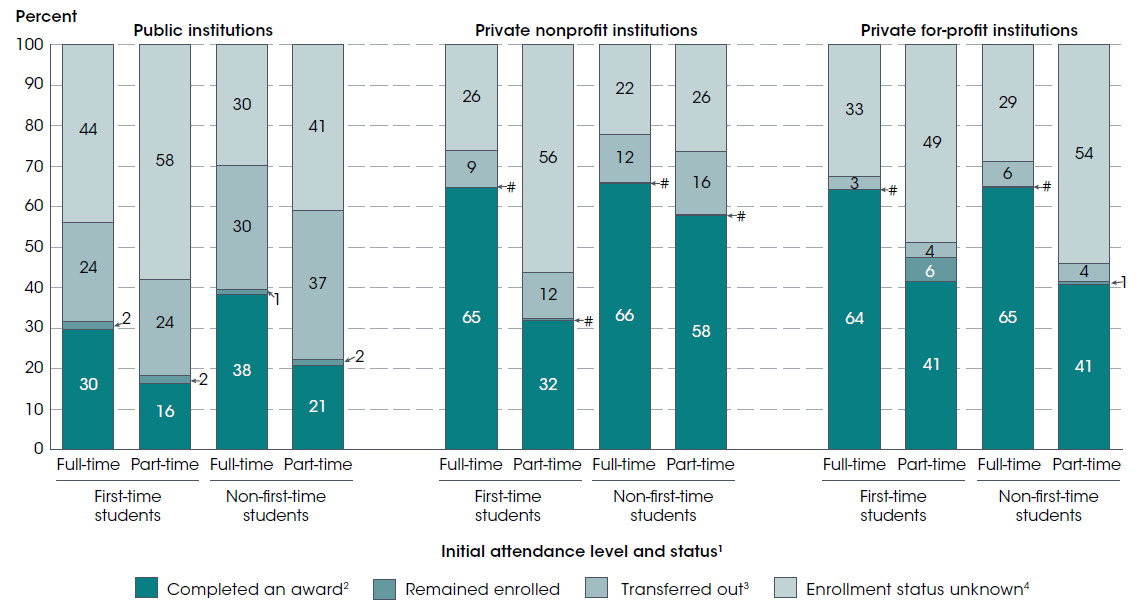
The second spotlight explores new data on postsecondary outcomes, including completion and transfer rates, for nontraditional undergraduate students. While the Integrated Postsecondary Education Data System formerly collected outcomes data only for first-time, full-time students, a new component of the survey includes information on students who enroll part time, transfer among institutions, or leave postsecondary education temporarily but later enroll again. These expanded data are particularly important for 2-year institutions, where higher percentages of students are nontraditional. For example, the indicator finds that, among students who started at public 2-year institutions in 2009, completion rates 8 years after entry were higher among full-time students (30 percent for first-time students and 38 percent for non-first-time students) than among part-time students (16 percent for first-time students and 21 percent for non-first-time students). Also at public 2-year institutions, transfer rates 8 years after entry were higher among non-first-time students (37 percent for part-time students and 30 percent for full-time students) than among first-time students (24 percent for both full-time and part-time students).

For more findings, including information on outcomes for nontraditional students at 4-year institutions, read the complete indicator, Postsecondary Outcomes for Nontraditional Undergraduate Students.


Percentage distribution of students' postsecondary outcomes 8 years after beginning at 2-year institutions in 2009, by initial attendance level and status: 2017
# Rounds to zero.
1 Attendance level (first-time or non-first-time student) and attendance status (full-time or part-time student) are based on the first full term (i.e., semester or quarter) after the student entered the institution. First-time students are those who had never attended a postsecondary institution prior to their 2009–10 entry into the reporting institution.
2 Includes certificates, associate’s degrees, and bachelor’s degrees. Includes only those awards that were conferred by the reporting institution (i.e., the institution the student entered in 2009–10); excludes awards conferred by institutions to which the student later transferred.
3 Refers to the percentage of students who were known transfers (i.e., those who notified their initial postsecondary institution of their transfer). The actual transfer rate (including students who transferred, but did not notify their initial institution) may be higher.
4 Includes students who dropped out of the reporting institution and students who transferred to another institution without notifying the reporting institution.
NOTE: The 2009 entry cohort includes all degree/certificate-seeking undergraduate students who entered a degree-granting institution between July 1, 2009, and June 30, 2010. Student enrollment status and completion status are determined as of August 31 of the year indicated; for example, within 8 years after the student’s 2009–10 entry into the reporting institution means by August 31, 2018. Detail may not sum to totals because of rounding. Although rounded numbers are displayed, the figures are based on unrounded data.

SOURCE: U.S. Department of Education, National Center for Education Statistics, Integrated Postsecondary Education Data System (IPEDS), Winter 2017–18, Outcome Measures component; and IPEDS Fall 2009, Institutional Characteristics component. See Digest of Education Statistics 2018, table 326.27.


The Condition of Education includes an At a Glance section, which allows readers to quickly make comparisons within and across indicators, and a Highlights section, which captures key findings from each indicator. The report also contains a Reader’s Guide, a Glossary, and a Guide to Sources that provide additional background information. Each indicator provides links to the source data tables used to produce the analyses.

As new data are released throughout the year, indicators will be updated and made available on The Condition of Education website. In addition, NCES produces a wide range of reports and datasets designed to help inform policymakers and the public. For more information on our latest activities and releases, please visit our website or follow us on TwitterFacebook, and LinkedIn.


By James L. Woodworth, NCES Commissioner

Challenges, changes, and current practices for measuring student socioeconomic status

By Lauren Musu-Gillette

There is an abundance of data and research that shows a relationship between a student’s socioeconomic status (SES) and their academic outcomes. For example, students from low-SES families are far more likely to drop out and far less likely to complete a bachelor’s degree than their peers from middle- and high-SES families.

As we seek to better interpret and understand these and other findings related to student progress, it important for NCES to try to collect accurate and complete measures of student SES.


Percentage distribution of highest level of educational attainment of spring 2002 high school sophomores in 2012, by socioeconomic status (SES)

SOURCE: U.S. Department of Education, National Center for Education Statistics, Education Longitudinal Study of 2002 (ELS:2002), Base Year and Third Follow-up. See Digest of Education Statistics 2014, table 104.91.


Measures of SES usually combine several different statistics, most commonly family income/wealth, parent educational attainment, and parent occupation.[1] In some surveys, NCES is able to collect data directly from parents in order to measure all these component of SES. However, in many assessments and some surveys, NCES is unable to collect this information directly from parents making it difficult to create a consistent measure of SES across the Center.

NCES staff recognizes both the importance of collecting valid and reliable SES data, and the challenges associated with doing so. For example, between 2010 and 2012, NCES convened a panel of experts in the fields of economics, education, statistics, human development, and sociology who provided information on SES, including theoretical foundations, common components, data collection and measurement approaches, and possible implications of a new measure of SES for the National Assessment of Educational Progress (NAEP). There are several challenges for NAEP when considering the inclusion of survey items that can be used to measure student SES. Since NAEP does not include a parent survey, student or school-level data is currently the only potential source for data. However, data on SES can be difficult to collect directly from students as many are unable to accurately respond to questions about their family income or the highest level of their parent or parents’ education.

In terms of school-level data, student eligibility for free and reduced price meals has historically been an important indicator of household income. However, recent changes in the way schools are required to record eligibility for free and reduced price meals has required researchers to reconsider the use of this data point  as a measure of family income, or as a proxy, more generally, for SES. A recent NAEP blog on this topic provides additional information on NAEP-specific considerations, but these changes impact data collection efforts across the agency. Additionally, the free and reduced price meals data only reflect income, which is only part of a complete SES measure, and does not differentiate between middle and high SES students.

Given these changes, NCES is working to  identify other variables that could serve as more reliable and valid measures of student SES.  For example, several NCES staff members are involved with the Alternative SES Measure Working Group as part of the National Forum on Education Statistics. This group recently released the Forum Guide to Alternative Measures of Socioeconomic Status in Education Data Systems. This publication presents advantages and disadvantages for eight alternative measures of SES.  These resources are intended to serve as reference tools for education agencies engaged in identifying, evaluating, or implementing alternative SES measures. They are not data collection instruments and do not represent federal reporting requirements.

Collecting data on and examining differences in educational outcomes by student SES is important to both researchers and educators. As data systems evolve and measures of SES change over time, NCES is committed to researching and collecting the best data possible with the resources available.


[1] For most NCES surveys, parent educational attainment and parent occupation is based on the highest level achieved by either parent and/or guardian in the household.

Educational attainment differences by students’ socioeconomic status

By Lauren Musu-Gillette

Obtaining higher education can be an important step towards better occupational and economic outcomes. Lower levels of educational attainment are associated with higher unemployment rates and lower earnings. Although an increasing number of students have enrolled in postsecondary institutions over the last several decades, there are still differences in the characteristics of students who complete various levels of postsecondary education.

One particularly important issue to explore is differences in educational attainment by socioeconomic status (SES) to investigate the opportunities for social mobility that education can provide. Recently, NCES published a spotlight indicator on this topic to be included in the annual Condition of Education report. The report uses data from the Education Longitudinal Study of 2002 (ELS:2002), which surveyed students at different points during their secondary and postsecondary years. Students were first surveyed in 2002 when they were sophomores in high school. Then, their highest level of education was assessed ten years later, in 2012.


Percentage distribution of highest level of educational attainment of spring 2002 high school sophomores in 2012, by socioeconomic status (SES)

1 Includes education at any type of postsecondary institution, but with no earned postsecondary credential. 
SOURCE: U.S. Department of Education, National Center for Education Statistics, Education Longitudinal Study of 2002 (ELS:2002). See Digest of Education Statistics 2014table 104.91.


Several key findings highlight differences in educational attainment by SES. For example:

  • Seven percent of low-SES students had not completed high school by 2012, greater than the percentages of middle- and high-SES students who had not completed high school by 2012;
  • By 2012, Fourteen percent of low-SES students who were high school sophomores in 2002 had earned a bachelor’s or higher degree, smaller than 29 percent of middle-SES students and 60 percent of high-SES students who earned a bachelor’s or higher degree; and
  • Compared to high-SES students, smaller percentages of low- and middle-SES students who performed in the highest quartile of math achievement during their sophomore year of high school went on to complete a bachelor’s degree by 2012.

Percentage of spring 2002 high school sophomores who earned a bachelor's degree or higher by 2012, by socioeconomic status (SES) and mathematics achievement quartile in 2002

SOURCE: U.S. Department of Education, National Center for Education Statistics, Education Longitudinal Study of 2002 (ELS:2002). See Digest of Education Statistics 2014table 104.91.


The following video describes additional findings from the report: