NCES Blog

National Center for Education Statistics

Program for the International Assessment of Adult Competencies (PIAAC) 2022–23 Data Collection Begins

Last month, the National Center for Education Statistics (NCES) kicked off a major survey of adults (ages 16–74) across the nation to learn about their literacy skills, education, and work experience. Information collected through this survey—officially known as Cycle 2 of the Program for the International Assessment of Adult Competencies (PIAAC) in the United States—is used by local, state, and national organizations, government entities, and researchers to learn about adult skills at the state and local levels (explore these data in the PIAAC Skills Map, shown below).


Image of PIAAC Skills Map on state and county indicators of adult literacy and numeracy


Specifically, these data are used to support educational and training initiatives organized by local and state programs. For example, the Houston Mayor’s Office for Adult Literacy has used the PIAAC Skills Map data in developing the Adult Literacy Blueprint, a comprehensive plan for coordinated citywide change to address the systemic crisis of low literacy and numeracy in the city. In addition, the Kentucky Career and Technical College System developed a comprehensive data-driven app for workforce pipeline planning using the county-level PIAAC Skills Map data as one of the education pipeline indicators.

This is not the first time NCES is administering PIAAC. NCES collected PIAAC data three times between 2011 and 2017, when the first cycle of this international study was administered in 39 countries. Developed by the Organization for Economic Cooperation and Development (OECD), PIAAC measures fundamental cognitive and workplace skills needed for individuals to participate in society and for economies to prosper. Among these fundamental skills are literacy, numeracy, and digital problem-solving. Data from the first cycle of PIAAC (2011–17) provided insights into the relationships between adult skills and various economic, social, and health outcomes—both across the United States as a whole and for specific populations of interest (e.g., adults who are women, immigrants, older, employed, parents, or incarcerated). The OECD and NCES have published extensively using these data.

The current cycle (Cycle 2) of PIAAC will resemble the first cycle in that interviewers will visit people’s homes to ask if they are willing to answer background questionnaire and take a self-administered test of their skills. However, unlike the first cycle when respondents could respond to the survey on paper or on a laptop, this cycle will be conducted entirely on a tablet. PIAAC is completely voluntary, but each respondent is specifically selected to provide invaluable information that will help us learn about the state of adult skills in the country (participants can also receive an incentive payment for completing the survey).

PIAAC’s background questionnaire includes questions about an individual’s demographics, family, education, employment, skill use, and (new in Cycle 2 and unique to the United States) financial literacy. The PIAAC test or “direct assessment” measures literacy, numeracy, and (new in Cycle 2) adaptive problem-solving skills of adults.1

Each sampled person’s response is not only kept confidential but also “anonymized” before the data are released (so that no one can ever definitively identify an individual from personal characteristics in the datafile).

The international report and data for PIAAC Cycle 2 is scheduled to be released by the OECD in December 2024.

Be sure to follow NCES on TwitterFacebookLinkedIn, and YouTube and subscribe to the NCES News Flash to stay up-to-date on PIAAC report and data releases and resources.


By Saida Mamedova, AIR, Stephen Provasnik, NCES, and Holly Xie, NCES


[1] Data is collected from adults ages 16–74 in the United States and ages 16–65 in the other countries.

Rescaled Data Files for Analyses of Trends in Adult Skills

In January 2022, NCES released the rescaled data files for three adult literacy assessments conducted several decades earlier: the 1992 National Adult Literacy Survey (NALS), the 1994 International Adult Literacy Survey (IALS), and the 2003 Adult Literacy and Lifeskills Survey (ALL). By connecting the rescaled data from these assessments with data from the current adult literacy assessment, the Program for the International Assessment of Adult Competencies (PIAAC), researchers can examine trends on adult skills in the United States going back to 1992. This blog post traces the history of each of these adult literacy assessments, describes the files and explains what “rescaling” means, and discusses how these files can be used in analyses in conjunction with the PIAAC files. The last section of the post offers several example analyses of the data.

A Brief History of International and National Adult Literacy Assessments Conducted in the United States

The rescaled data files highlighted in this blog post update and combine historical data from national and international adult literacy studies that have been conducted in the United States.

NALS was conducted in 1992 by NCES and assessed U.S. adults in households, as well as adults in prisons. IALS—developed by Statistics Canada and ETS in collaboration with 22 participating countries, including the United States—assessed adults in households and was administered in three waves between 1994 and 1998. ALL was administered in 11 countries, including the United States, and assessed adults in two waves between 2003 and 2008.

PIAAC seeks to ensure continuity with these previous surveys, but it also expands on their quality assurance standards, extends the definitions of literacy and numeracy, and provides more information about adults with low levels of literacy by assessing reading component skills. It also, for the first time, includes a problem-solving domain to emphasize the skills used in digital (originally called “technology-rich”) environments.

How Do the Released Data Files From the Earlier Studies of Adult Skills Relate to PIACC?

All three of the released restricted-use data files (for NALS, IALS, and ALL) relate to PIAAC, the latest adult skills assessment, in different ways.

The NALS data file contains literacy estimates and background characteristics of U.S. adults in households and in prisons in 1992. It is comparable to the PIAAC data files for 2012/14 and 2017 through rescaling of the assessment scores and matching of the background variables to those of PIAAC.

The IALS and ALL data files contain literacy (IALS and ALL) and numeracy (ALL) estimates and background characteristics of U.S. adults in 1994 (IALS) and 2003 (ALL). Similar to NALS, they are comparable to the PIAAC restricted-use data (2012/14) through rescaling of the literacy and numeracy assessment scores and matching of the background variables to those of PIAAC. These estimates are also comparable to the international estimates of skills of adults in several other countries, including in Canada, Hungary, Italy, Norway, the Netherlands, and New Zealand (see the recently released Data Point International Comparisons of Adult Literacy and Numeracy Skills Over Time). While the NCES datasets contain only the U.S. respondents, IALS and ALL are international studies, and the data from other participating countries can be requested from Statistics Canada (see the IALS Data Files/Publications and ALL Data pages for more detail). See the History of International and National Adult Literacy Assessments page for additional background on these studies. 

Table 1 provides an overview of the rescaled NALS, IALS, and ALL data files.


Table 1. Overview of the rescaled data files for the National Adult Literacy Survey (NALS), International Adult Literacy Survey (IALS), and Adult Literacy and Lifeskills Survey (ALL) 
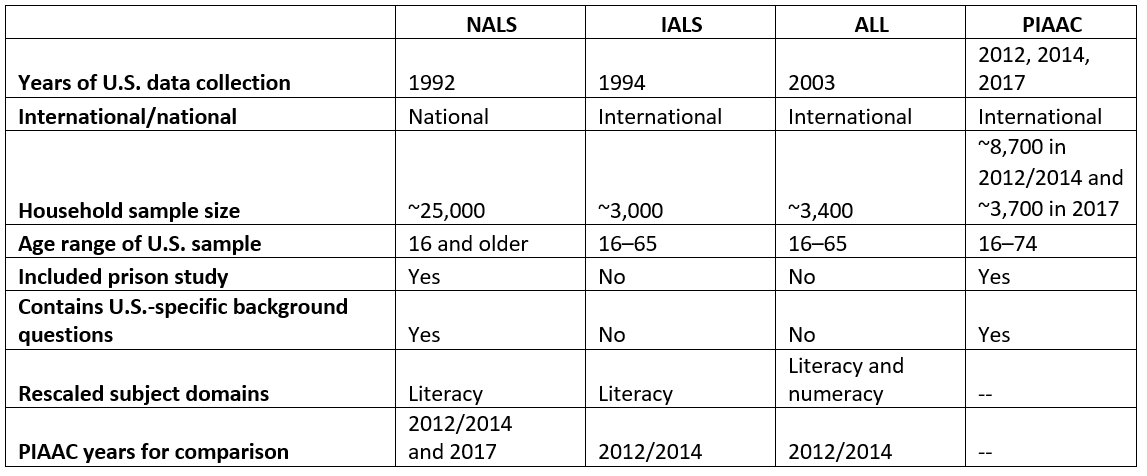
Table showing overview of the rescaled data files for the National Adult Literacy Survey (NALS), International Adult Literacy Survey (IALS), and Adult Literacy and Lifeskills Survey


What Does “Rescaled” Mean?

“Rescaling” the literacy (NALS, IALS, ALL) and numeracy (ALL) domains from these three previous studies means that the domains were put on the same scale as the PIAAC domains through the derivation of updated estimates of proficiency created using the same statistical models used to create the PIAAC skills proficiencies. Rescaling was possible because PIAAC administered a sufficient number of the same test questions used in NALS, IALS, and ALL.1 These rescaled proficiency estimates allow for trend analysis of adult skills across the time points provided by each study.

What Can These Different Files Be Used For?

While mixing the national and international trend lines isn’t recommended, both sets of files have their own distinct advantages and purposes for analysis.

National files

The rescaled NALS 1992 files can be used for national trend analyses with the PIAAC national trend points in 2012/2014 and 2017. Some potential analytic uses of the NALS trend files are to

  • Provide a picture of the skills of adults only in the United States;
  • Examine the skills of adults in prison and compare their skills with those of adults in households over time, given that NALS and PIAAC include prison studies conducted in 1992 and 2014, respectively;
  • Conduct analyses on subgroups of the population (such as those ages 16–24 or those with less than a high school education) because the larger sample size of NALS allows for more detailed breakdowns along with the U.S. PIAAC sample;
  • Focus on the subgroup of older adults (ages 66–74), given that NALS sampled adults over the age of 65, similar to PIAAC, which sampled adult ages 16–74; and
  • Analyze U.S.-specific background questions (such as those on race/ethnicity or health-related practices).

International files

The rescaled IALS 1994 and ALL 2003 files can be used for international trend analyses among six countries with the U.S. PIAAC international trend point in 2012/2014: Canada, Hungary, Italy, Norway, the Netherlands, and New Zealand. Some potential analytic uses of the IALS and ALL trend files are to

  • Compare literacy proficiency results internationally and over time using the results from IALS, ALL, and PIAAC; and
  • Compare numeracy proficiency results internationally and over time using the results from ALL and PIAAC.

Example Analyses Using the U.S. Trend Data on Adult Literacy

Below are examples of a national trend analysis and an international trend analysis conducted using the rescaled NALS, IALS, and ALL data in conjunction with the PIAAC data.

National trend estimates

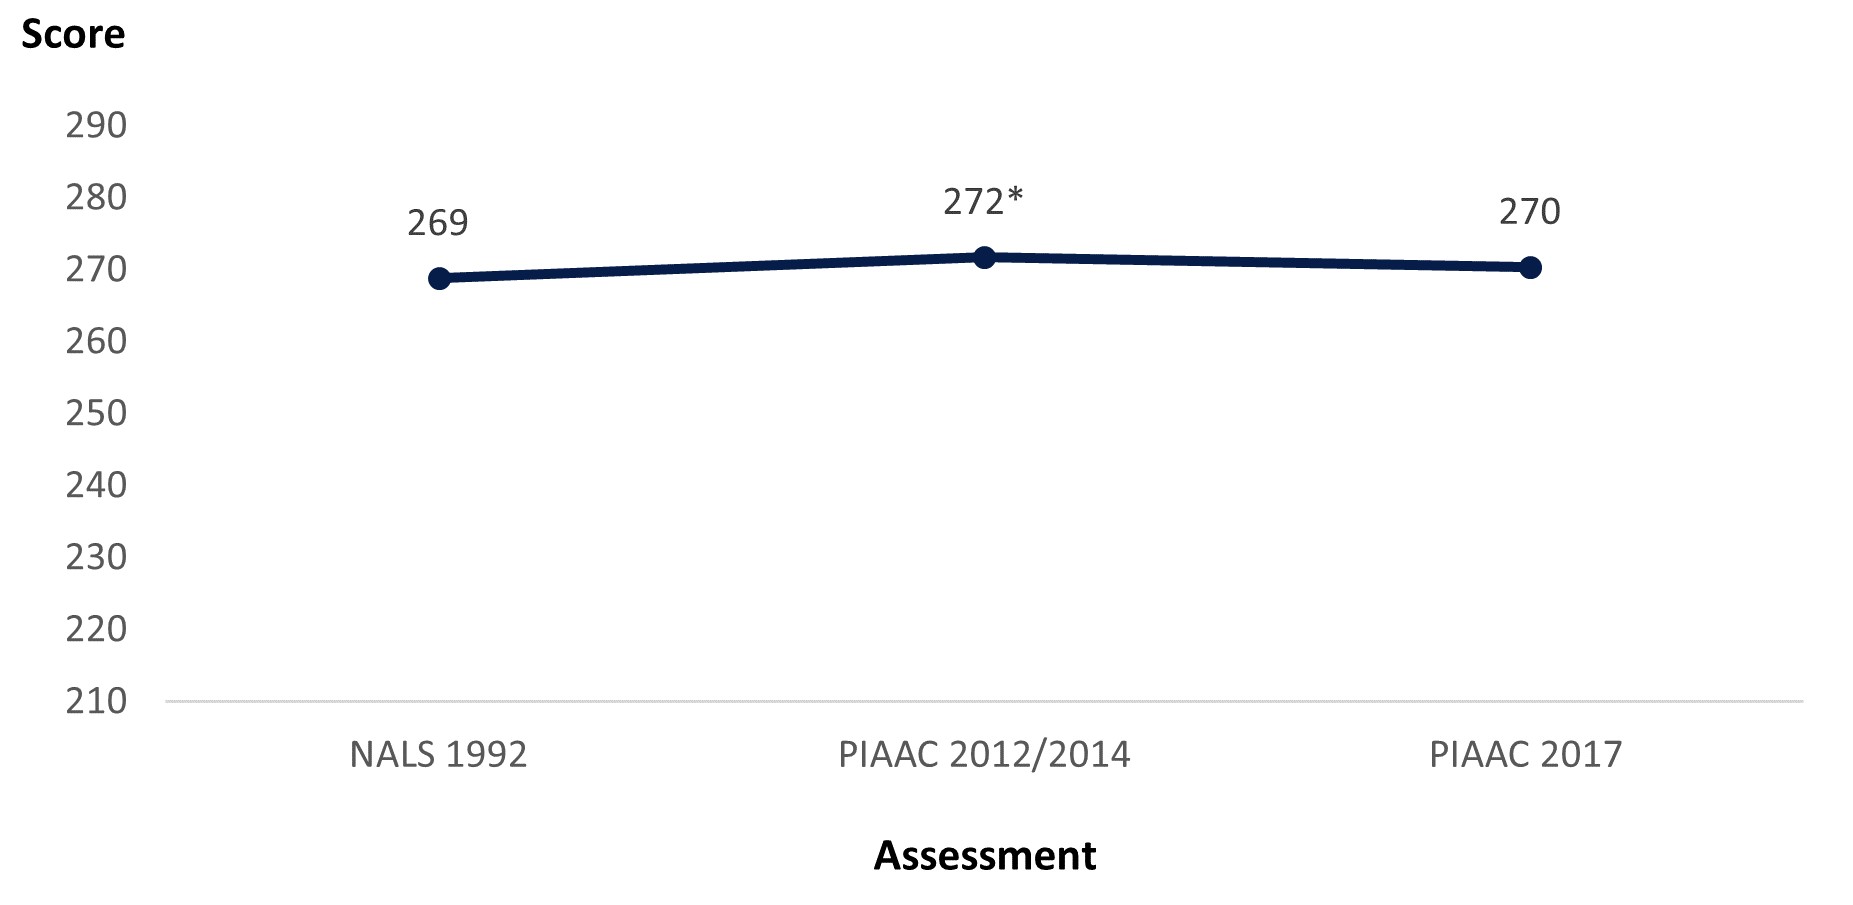
The literacy scores of U.S. adults increased from 269 in NALS 1992 to 272 in PIAAC 2012/2014. However, the PIAAC 2017 score of 270 was not significantly different from the 1992 or 2012/2014 scores.


Figure 1. Literacy scores of U.S. adults (ages 16–65) along national trend line: Selected years, 1992–2017
Line graph showing literacy scores of U.S. adults (ages 16–65) along national trend line for NALS 1992, PIAAC 2012/2014, and PIAAC 2017

* Significantly different (p < .05) from NALS 1992 estimate.
SOURCE: U.S. Department of Education, National Center for Education Statistics, National Adult Literacy Survey (NALS), NALS 1992; and Program for the International Assessment of Adult Competencies (PIAAC), PIAAC 2012–17.


International trend estimates

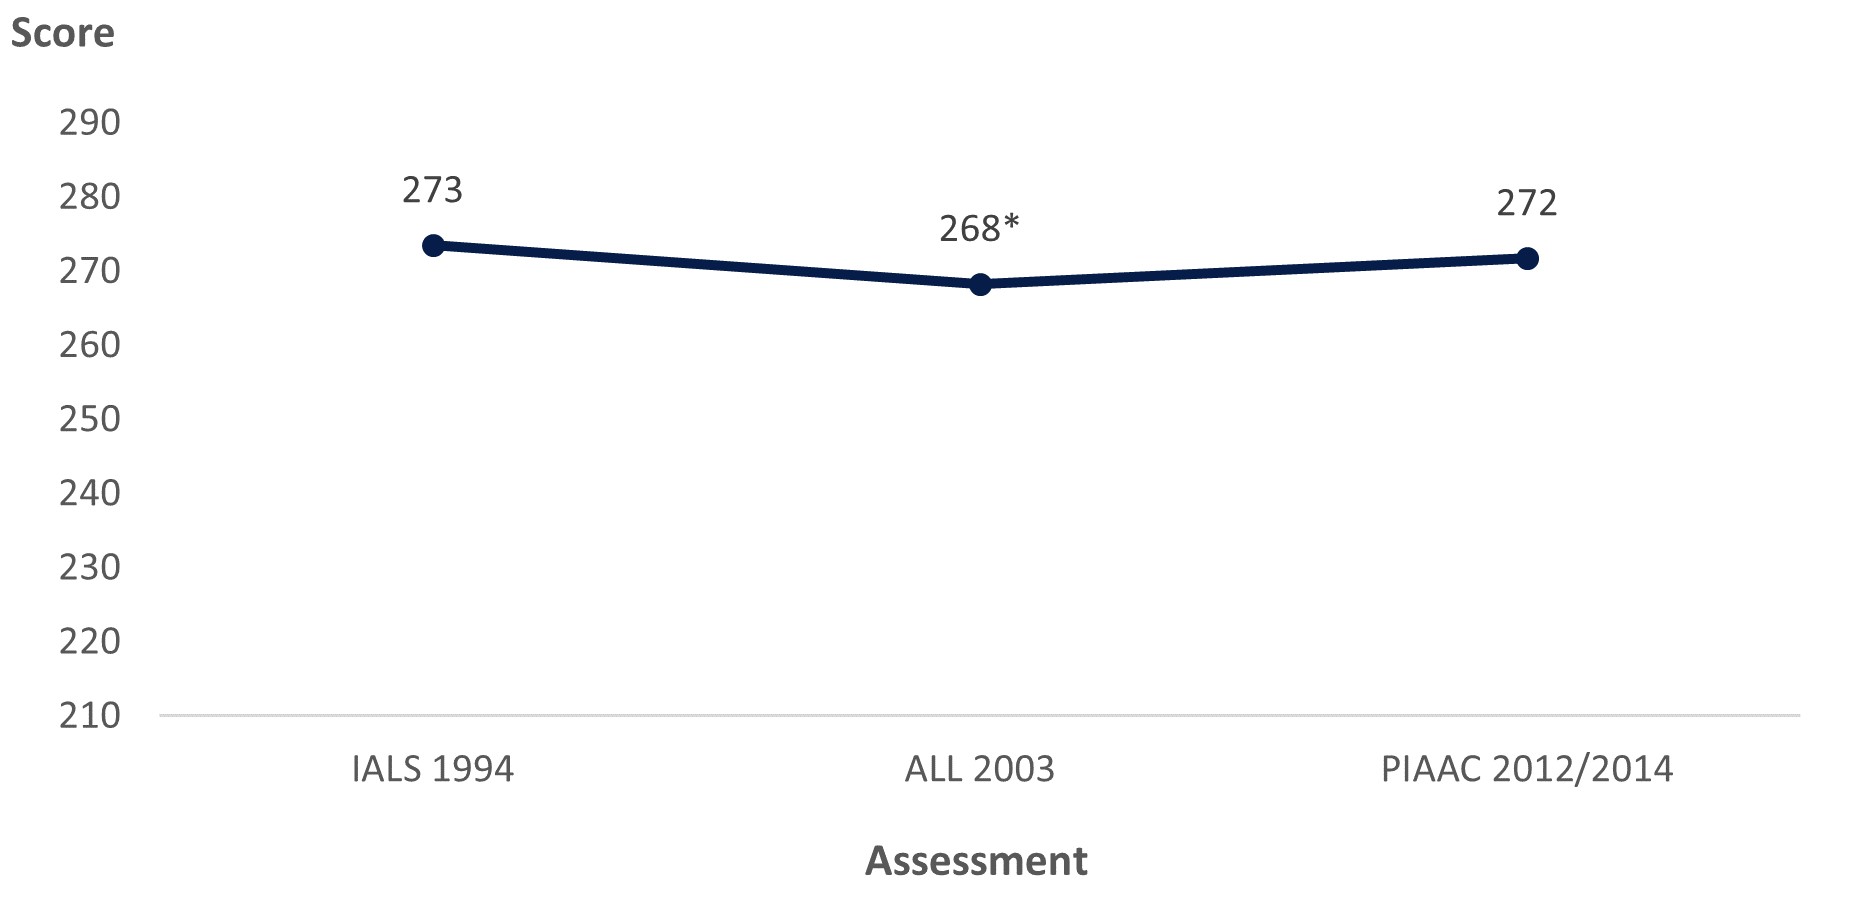
The literacy scores of U.S. adults decreased from 273 in IALS 1994 to 268 in ALL 2003 before increasing to 272 in PIAAC 2012/2014. However, the PIAAC 2012/2014 score was not significantly different from the IALS 1994 score.


Figure 2. Literacy scores of U.S. adults (ages 16–65) along international trend line: Selected years, 1994–2012/14
Line graph showing literacy scores of U.S. adults (ages 16–65) along international trend line for IALS 1994, ALL 2003, and PIAAC 2012/2014

* Significantly different (p < .05) from IALS 1994 estimate.
SOURCE: U.S. Department of Education, National Center for Education Statistics, Statistics Canada and Organization for Economic Cooperation and Development (OECD), International Adult Literacy Survey (IALS), 1994–98; Adult Literacy and Lifeskills Survey (ALL), 2003–08; and Program for the International Assessment of Adult Competencies (PIAAC), PIAAC 2012/14. See figure 1 in the International Comparisons of Adult Literacy and Numeracy Skills Over Time Data Point.


How to Access the Rescaled Data Files

More complex analyses can be conducted with the NALS, IALS, and ALL rescaled data files. These are restricted-use files and researchers must obtain a restricted-use license to access them. Further information about these files is available on the PIAAC Data Files page (see the “International Trend Data Files and Data Resources” and “National Trend Data Files and Data Resources” sections at the bottom of the page).

Additional resources:

By Emily Pawlowski, AIR, and Holly Xie, NCES


[1] In contrast, the 2003 National Assessment of Adult Literacy (NAAL), another assessment of adult literacy conducted in the United States, was not rescaled for trend analyses with PIAAC. For various reasons, including the lack of overlap between the NAAL and PIAAC literacy items, NAAL and PIAAC are thought to be the least comparable of the adult literacy assessments.

Access an NCES Presentation on ECLS Reading Data From the IES Reading Summit

NCES staff presented information on reading data from the Early Childhood Longitudinal Studies (ECLS) Program at the June 2021 Institute of Education Sciences (IES)/Council of the Great City Schools (CGCS) Reading Summit. The ECLS data cover a wide range of reading-related topics, such as children’s reading knowledge and skills, home literacy activities, and teachers’ instructional practices. The presentation included a brief overview of three ECLS program studies and the reading-related data collected by each. In addition, the presentation included a discussion of the resources available to either see what research has been conducted with the data or explore the data independently. As the focus of the presentation was on data available to the public for secondary analysis, its target audience was researchers and others with a data science focus.

Access the Reading Summit presentation—Reading Data Available from the Early Childhood Longitudinal Studies (ECLS)—and handout below to learn more about ECLS reading data.

Be sure to also check out this blog post to learn more about the work highlighted at the IES Reading Summit.


By Jill Carlivati McCarroll, NCES

The Growing Reading Gap: IES Event to Link Knowledge to Action Through Literacy Data

On June 8 and 9, the Institute of Education Sciences (IES) and the Council of the Great City Schools (CGCS) will host a Reading Summit to address one of the most important issues confronting American education today: the declining reading performance of America’s lowest-performing students and the growing gap between low- and high-performing students.

At this 2-day virtual event, participants will explore the results of the National Assessment of Educational Progress (NAEP), as well as other IES data, and learn strategies to help educators and low-performing readers make progress.

Learn more about the summit’s agenda and speakers—including IES Director Mark Schneider, NCES Commissioner James L. Woodworth, and NCES Associate Commissioner Peggy Carr—and register to participate (registration is free).

In the meantime, explore some of the data NCES collects on K–12 literacy and reading achievement, which show that the scores of students in the lowest-performing groups are decreasing over time.

  • The National Assessment of Educational Progress (NAEP) administers reading assessments to 4th-, 8th-, and 12th-grade students. The most recent results from 2019 show that average reading scores for students in the 10th percentile (i.e., the lowest-performing students) decreased between 2017 and 2019 at grade 4 (from 171 to 168) and grade 8 (from 219 to 213) and decreased between 2019 and 2015 at grade 12 (from 233 to 228).
  • The Progress in International Reading Literacy Study (PIRLS) is an international comparative assessment that measures 4th-grade students’ reading knowledge and skills. The most recent findings from 2016 show that the overall U.S. average score (549) was higher than the PIRLS scale centerpoint (500), but at the 25th percentile, U.S. 4th-graders scored lower in 2016 (501) than in 2011 (510).
  • The Program for International Student Assessment (PISA) is a study of 15-year-old students’ performance in several subjects, including reading literacy. The 2018 results show that, although the overall U.S. average reading score (505) was higher than the OECD average score (487), at the 10th percentile, the U.S. average score in 2018 (361) was not measurably different from the score in 2015 and was lower than the score in 2012 (378).

NCES also collects data on young children’s literacy knowledge and activities as well as the literacy competencies of adults. Here are a few data collections and tools for you to explore:

This year, the Condition of Education includes a newly updated indicator on literacy activities that parents reported doing with young children at home. Here are some key findings from this indicator, which features data from the 2019 NHES Early Childhood Program Participation Survey:

In the week before the parents were surveyed,

  • 85 percent of 3- to 5-year-olds were read to by a family member three or more times.
  • 87 percent of 3- to 5-year-olds were told a story by a family member at least once.
  • 96 percent of 3- to 5-year-olds were taught letters, words, or numbers by a family member at least once.

In the month before the parents were surveyed,

  • 37 percent of 3- to 5-year-olds visited a library with a family member at least once.

Be sure to read the full indicator in the 2021 Condition of Education, which was released in May, for more data on young children’s literacy activities, including analyses by race/ethnicity, mother’s educational attainment, and family income.

Don’t forget to follow NCES on Twitter, Facebook, and LinkedIn to stay up-to-date on the latest findings and trends in literacy and reading data and register for the IES Reading Summit to learn more about this topic from experts in the field. 


By Megan Barnett, AIR

New International Comparisons of Reading, Mathematics, and Science Literacy Assessments

The Program for International Student Assessment (PISA) is a study of 15-year-old students’ performance in reading, mathematics, and science literacy that is conducted every 3 years. The PISA 2018 results provide us with a global view of U.S. students’ performance compared with their peers in nearly 80 countries and education systems. In PISA 2018, the major domain was reading literacy, although mathematics and science literacy were also assessed.

In 2018, the U.S. average score of 15-year-olds in reading literacy (505) was higher than the average score of the Organization for Economic Cooperation and Development (OECD) countries (487). Compared with the 76 other education systems with PISA 2018 reading literacy data, including both OECD and non-OECD countries, the U.S. average reading literacy score was lower than in 8 education systems, higher than in 57 education systems, and not measurably different in 11 education systems. The U.S. percentage of top performers in reading was larger than in 63 education systems, smaller than in 2 education systems, and not measurably different in 11 education systems. The average reading literacy score in 2018 (505) was not measurably different from the average score in 2000 (504), the first year PISA was administered. Among the 36 education systems that participated in both years, 10 education systems reported higher average reading literacy scores in 2018 compared with 2000, and 11 education systems reported lower scores.

The U.S. average score of 15-year-olds in mathematics literacy in 2018 (478) was lower than the OECD average score (489). Compared with the 77 other education systems with PISA 2018 mathematics literacy data, the U.S. average mathematics literacy score was lower than in 30 education systems, higher than in 39 education systems, and not measurably different in 8 education systems. The average mathematics literacy score in 2018 (478) was not measurably different from the average score in 2003 (483), the earliest year with comparable data. Among the 36 education systems that participated in both years, 10 systems reported higher mathematics literacy scores in 2018 compared with 2003, 13 education systems reported lower scores, and 13 education systems reported no measurable changes in scores.  

The U.S. average score of 15-year-olds in science literacy (502) was higher than the OECD average score (489). Compared with the 77 other education systems with PISA 2018 science literacy data, the U.S. average science literacy score was lower than in 11 education systems, higher than in 55 education systems, and not measurably different in 11 education systems. The average science literacy score in 2018 (502) was higher than the average score in 2006 (489), the earliest year with comparable data. Among the 52 education systems that participated in both years, 7 education systems reported higher average science literacy scores in 2018 compared with 2006, 22 education systems reported lower scores, and 23 education systems reported no measurable changes in scores.

PISA is conducted in the United States by NCES and is coordinated by OECD, an intergovernmental organization of industrialized countries. Further information about PISA can be found in the technical notes, questionnaires, list of participating OECD and non-OECD countries, released assessment items, and FAQs.


By Thomas Snyder