NCES Blog

National Center for Education Statistics

NCES Presentation at National HBCU Week Conference

In NCES’s recently released Strategic Plan, Goal 3 identifies our commitment to foster and leverage beneficial partnerships. To fulfill that goal, NCES participates in multiple conferences and meetings throughout the year. Recently, NCES participated in the National Historically Black Colleges and Universities (HBCU) Week Conference. NCES’s presentation at this conference helps us to establish a dialogue with HBCUs and develop partnerships to address critical issues in education.

NCES Commissioner Peggy G. Carr kicked off the presentation with an overview of HBCU data—such as student characteristics, enrollment, and financial aid. Then, NCES experts explored how data from various NCES surveys can help researchers, educators, and policymakers better understand the condition and progress of HBCUs. Read on to learn about these surveys.


Integrated Postsecondary Education Data System (IPEDS)

The Integrated Postsecondary Education Data System (IPEDS) is an annual administrative data collection that gathers information from more than 6,000 postsecondary institutions, including 99 degree-granting, Title IV–eligible HBCUs (in the 2021–22 academic year).

The data collected in IPEDS includes information on institutional characteristics and resources; admissions and completions; student enrollment; student financial aid; and human resources (i.e., staff characteristics). These data are disaggregated, offering insights into student and employee demographics by race/ethnicity and gender, students’ age categories, first-time/non-first-time enrollment statuses, and full-time/part-time attendance intensity.

Data from IPEDS can be explored using various data tools—such as Data Explorer, Trend Generator, and College Navigator—that cater to users with varying levels of data knowledge and varying data needs.


National Postsecondary Student Aid Study (NPSAS)

The National Postsecondary Student Aid Study (NPSAS) is a nationally representative study that examines the characteristics of students in postsecondary institutions—including HBCUs—with a special focus on how they finance their education. NPSAS collects data on the percentage of HBCU students receiving financial aid and the average amounts received from various sources (i.e., federal, state, and institution) by gender and race/ethnicity.

Conducted every 3 or 4 years, this study combines data from student surveys, student-level school records, and other administrative sources and is designed to describe the federal government’s investment in financing students’ postsecondary education.

Data from NPSAS can be explored using DataLab and PowerStats.


National Teacher and Principal Survey (NTPS)

The National Teacher and Principal Survey (NTPS) is the U.S. Department of Education’s primary source of information on K–12 public and private schools from the perspectives of teachers and administrators. NTPS consists of coordinated surveys of schools, principals, and teachers and includes follow-up surveys to study principal and teacher attrition.

Among many other topics, NTPS collects data on the race/ethnicity of teachers and principals. These data—which show that Black teachers and principals make up a relatively small portion of the K–12 workforce—can be used to explore the demographics and experiences of teachers and principals. NTPS provides postsecondary institutions, like HBCUs, a snapshot of the preK–12 experiences of students and staff.

Data from NTPS can be explored using DataLab and PowerStats.


National Assessment of Educational Progress (NAEP)

The National Assessment of Educational Progress (NAEP)—also known as the Nation’s Report Card—is the the largest nationally representative and continuing assessment of what students in public and private schools in the United States know and are able to do in various subjects.

Main NAEP assesses students in grades 4, 8, and 12 in subjects like reading, mathematics, science, and civics, while NAEP Long-Term Trend assesses 9-, 13-, and 17-year-olds in reading and mathematics.

Among many other topics, NAEP collects data on students by race/ethnicity. These data can help to shed light on students’ experiences, academic performance, and level of preparedness before they enroll in HBCUs.

Data from NAEP can be explored using the NAEP Data Explorer.


To explore more HBCU data from these and other NCES surveys—including enrollment trends from 1976 to 2021—check out this annually updated Fast Fact. Be sure to follow NCES on X, Facebook, LinkedIn, and YouTube and subscribe to the NCES News Flash to stay up to date on the latest from NCES.


By Megan Barnett, AIR

Education at a Glance 2023: Putting U.S. Data in a Global Context

International comparisons provide reference points for researchers and policy analysts to understand trends and patterns in national education data and are very important as U.S. students compete in an increasingly global economy.

Education at a Glance (EAG), an annual publication produced by the Organization for Economic Cooperation and Development (OECD), provides data on the structure, finances, and progress of education systems in 38 OECD countries—including the United States—as well as a number of OECD accession and partner countries. Data presented in EAG on topics of high policy interest in the United States are also featured in NCES reports, including the Condition of Education and Digest of Education Statistics.  

The recently released 2023 edition of EAG shows that the United States is above the international average on some measures, such as funding of postsecondary education, but lags behind in others, such as participation in early childhood education and care (ECEC). The 2023 report also features a Spotlight on Vocational Education and Training as well as interactive data dashboards on ECEC systems, upper secondary education systems, and educational support for Ukrainian refugees.


Spotlight on Vocational Education and Training (VET)

Each EAG edition centers on a particular theme of high policy relevance in OECD countries. The focus of this year’s report is VET programs, which look very different in the United States compared with many other OECD countries. Unlike in many OECD countries, most high schools in the United States do not offer a separate, distinct vocational track at the upper secondary (high school) level. Instead, vocational education is available as optional career and technical education (CTE) courses throughout high school. Regardless of whether they choose to take CTE courses, all U.S. students who complete high school have the same potential to access postsecondary programs. In other OECD countries, selecting a vocational track at this level may lead to different postsecondary opportunities. Check out the 2023 EAG Spotlight for an overview of VET programs across OECD countries.


Highlights From EAG 2023

Below is a selection of topics from the EAG report highlighting how key education benchmarks in the United States compare with other OECD countries.


Postsecondary Educational Attainment

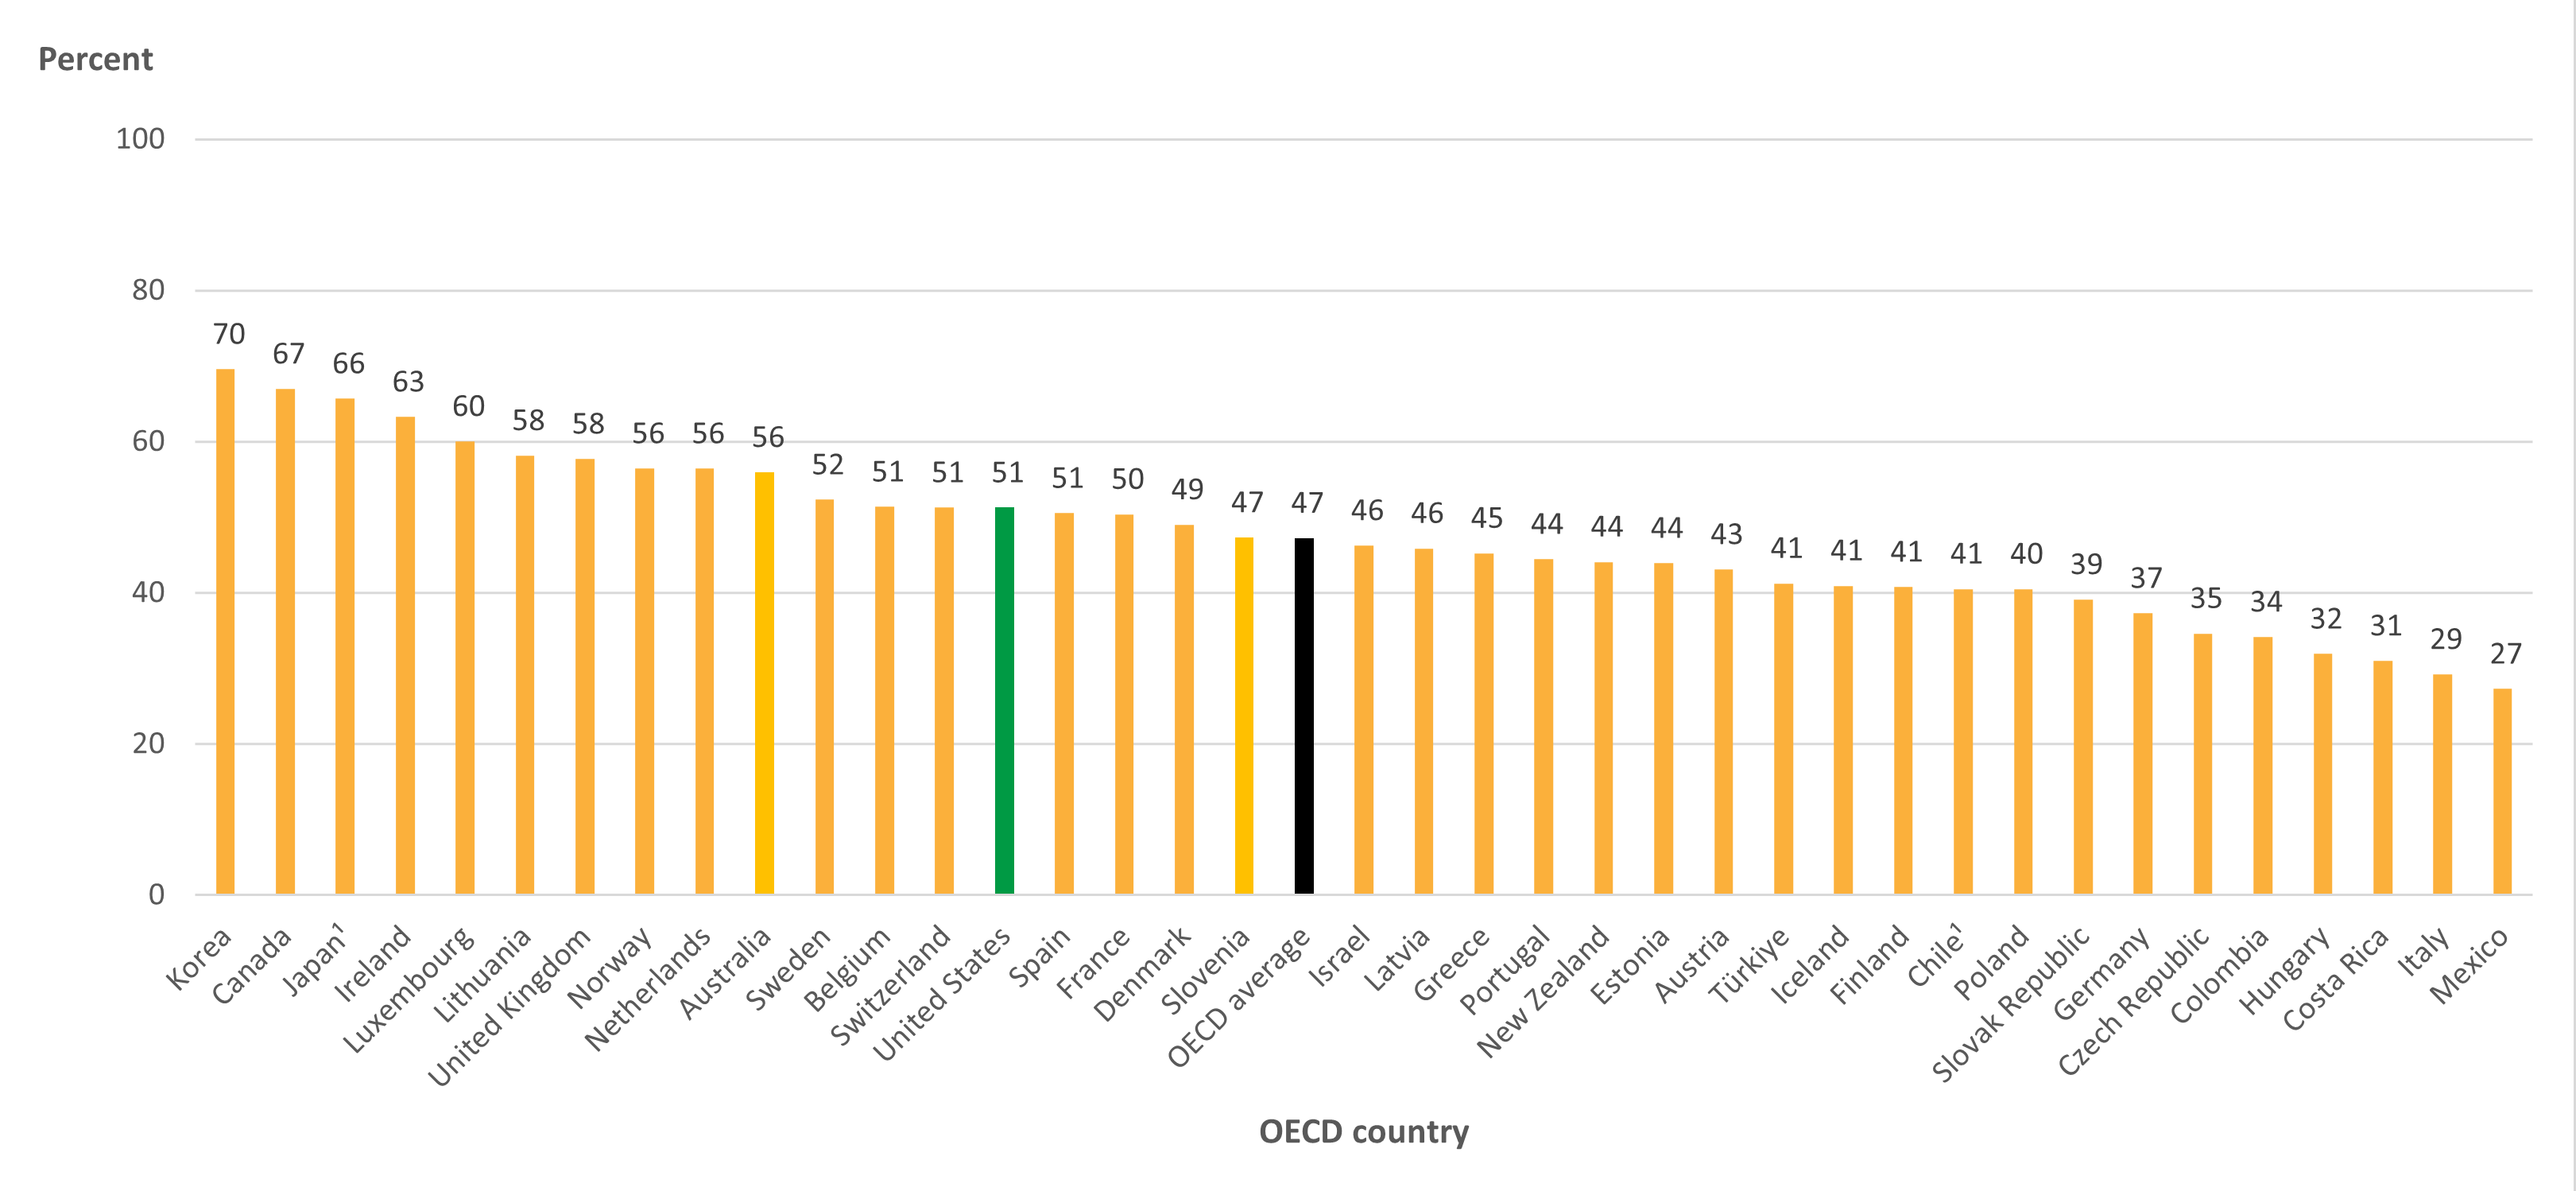
The percentage of U.S. 25- to 34-year-olds with a postsecondary degree increased by 13 percentage points between 2000 and 2022, reaching 51 percent (the OECD average in 2022 was 47 percent) (Table A1.3).1 In this age group in the United States, higher percentages of women than men attained a postsecondary degree (56 vs. 46 percent) (Table A1.2). Across OECD countries, the average postsecondary educational attainment gap between 25- to 34-year-old men and women in 2022 (13 percentage points) was wider than the gap in the United States (10 percentage points). In the United States, the postsecondary attainment rate for 25- to 34-year-old men was 5 percentage points higher than the OECD average, and the attainment rate for women was 3 percentage points higher than the OECD average.


Figure 1. Percentage of 25- to 34-year-olds with a postsecondary degree, by OECD country: 2022

[click to enlarge image]
Data include a small percentage of adults with lower levels of attainment.
Year of reference differs from 2022. Refer to the source table for more details.
SOURCE: OECD (2023), Table A1.3. See Source section for more information and Annex 3 for notes.


International Student Enrollment

The United States is the top OECD destination country for international students enrolling in postsecondary education. In 2021, some 833,204 foreign students were enrolled in postsecondary programs in the United States, representing 13 percent of the international education market share (Table B6.1).2 In comparison, the United Kingdom had the second highest number of international students enrolled in postsecondary education in 2021, representing 9 percent of the international education market share. Interestingly, when examining enrollment trends over the past 3 years (2019 to 2021), foreign student enrollment decreased by 143,649 students (15 percent) in the United States but increased by 111,570 students (23 percent) in the United Kingdom. International student enrollment during these years was likely affected by the coronavirus pandemic, which had large impacts on global travel in 2020 and 2021.


Education Spending

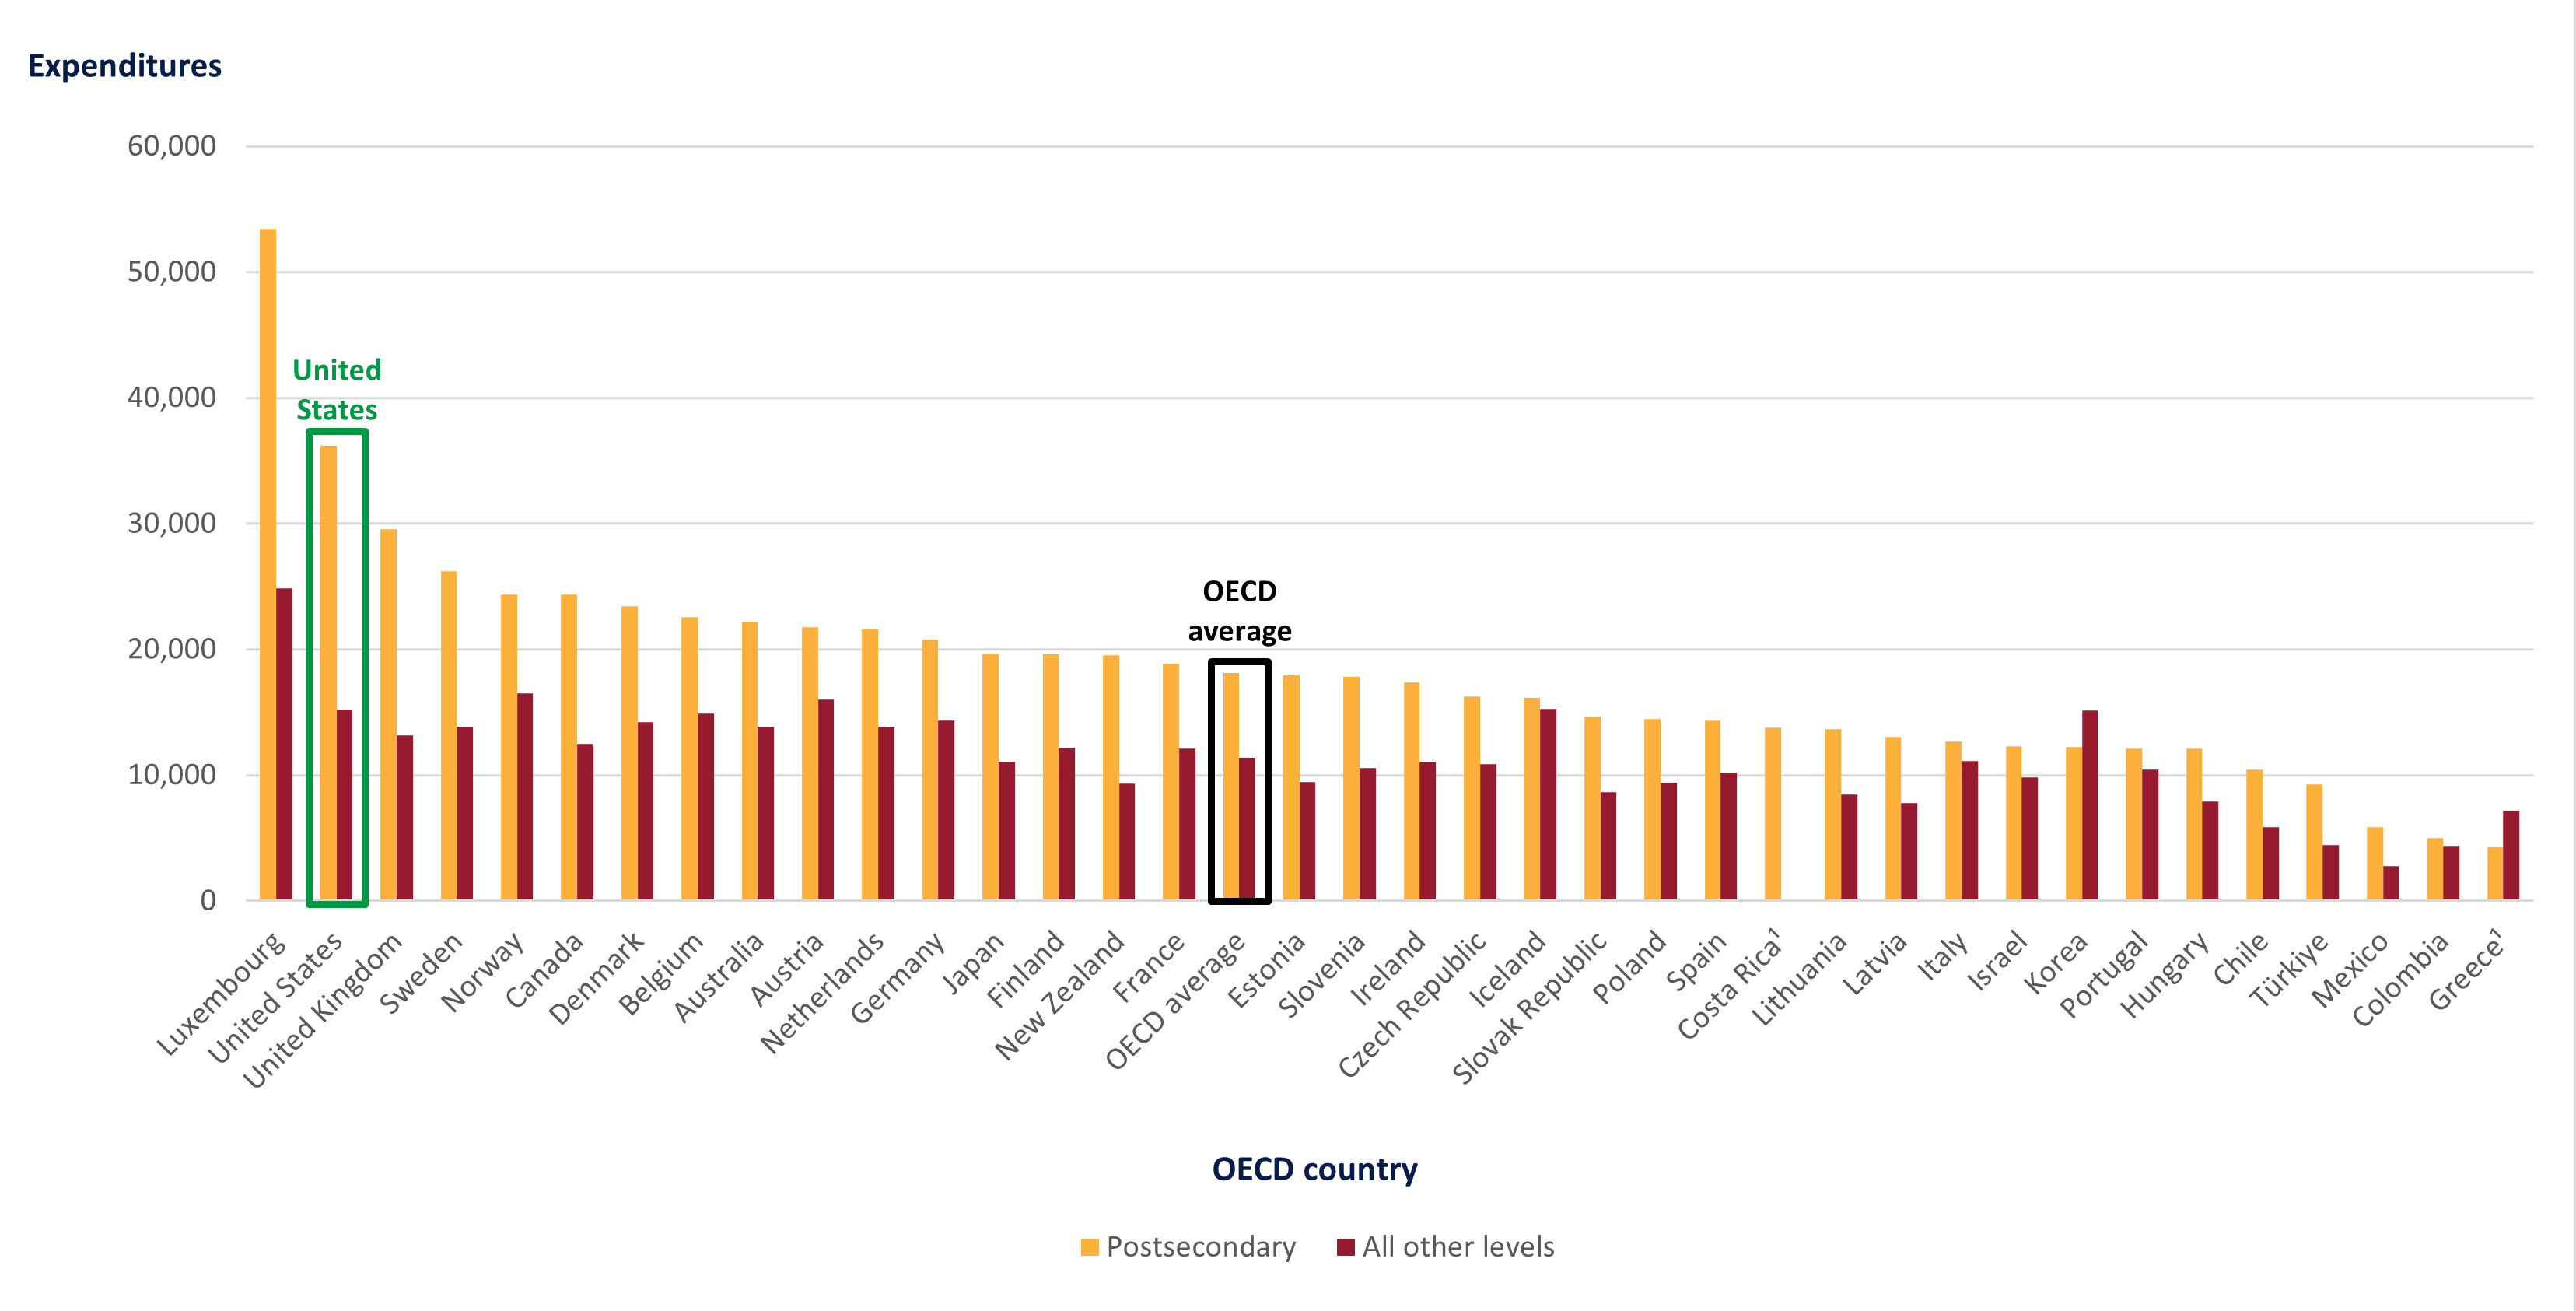
U.S. spending on education is relatively high across all levels of education compared with the OECD average. The largest difference is in postsecondary spending, where the United States spent $36,172 per full-time postsecondary student in 2020, the second highest amount after Luxembourg ($53,421) and nearly double the OECD average ($18,105) (Table C1.1).3 This spending on postsecondary education amounts to 2.5 percent of the U.S. GDP, higher than the OECD average (1.5 percent) (Table C2.1). These total expenditures include amounts received from governments, students, and all other sources.


Figure 2. Expenditures per full-time equivalent student, by education level and OECD country: 2020

[click to enlarge image]
1 Year of reference differs from 2020. Refer to the source table for more details.
SOURCE: OECD (2023), Table C1.1. See Source section for more information and Annex 3 for notes.


High School Completion Rate

The United States has a higher upper secondary (high school) completion rate than most other OECD countries. In 2021, some 87 percent of U.S. students completed their high school program in the expected timeframe, compared with the OECD average of 72 percent (Table B3.1).


Early Childhood Education

The level of participation in early childhood education programs in the United States is below the OECD average. In 2021, average enrollment rates across OECD countries were 72 percent for 3-year-olds, 87 percent for 4-year-olds, and 84 percent for 5-year-olds (Table B2.1). In contrast, enrollment rates for students of these ages in the United States were 30 percent for 3-year-olds, 50 percent for 4-years-olds, and 81 percent for 5-year-olds.  


Browse the full EAG 2023 report to see how the United States compares with other countries on these and other important education-related topics.


By RaeAnne Friesenhahn, AIR, and Cris De Brey, NCES


[1] EAG data for the year 2000 can be accessed via the online OECD Stat database.

[2] Unrounded data in Excel format can be accessed via the StatLink located below each table.

[3] Expenditure in national currencies was converted into equivalent USD by dividing the national currency figure by the purchasing power parity (PPP) index for GDP. For more details on methodology see Annex 2 and Annex 3.

Highlights From the FY 21 Revenues and Expenditures for Public Elementary and Secondary Education Report

NCES recently released a finance tables report, Revenues and Expenditures for Public Elementary and Secondary Education: FY 21 (NCES 2023-301), which draws from data in the National Public Education Financial Survey (NPEFS). To accompany the report, NCES has updated the interactive data visualization tool to highlight the per pupil revenues and expenditures (adjusted for inflation) and average daily attendance (ADA) trends from the fiscal year 2021 (FY 21) NPEFS.

This tool allows users to see national or state-specific per pupil amounts and year-to-year percentage changes for both total revenue and current expenditures by using a slider to toggle between the two variables. Total revenues are shown by source, and total current expenditures are shown by function and subfunction. Clicking on a state in the map will display data for the selected state in the bar charts.

The tool also allows users to see the ADA for each state. It is sortable by state, ADA amount, and percentage change. It may also be filtered to easily compare selected states. Hovering over the ADA of a state will display another bar graph with the last 3 years of ADA data.

Overall, the results show that spending1 on elementary and secondary education increased in school year 2020–21 (FY 21). This is the eighth consecutive year that year-over-year education spending increased (since FY 13), after adjusting for inflation. This increase follows declines in year-over-year spending for the prior 4 years (FY 10 through FY 13).


Revenues

The 50 states and the District of Columbia reported $837.3 billion in revenues collected for public elementary and secondary education in FY 21. State and local governments provided $748.9 billion, or 89.4 percent of all revenues. The federal government contributed $88.4 billion, or 10.6 percent of all revenues. Total revenues increased by 3.0 percent after adjusting for inflation2 (from $812.8 to $837.3 billion) from FY 20 to FY 21; local revenues remained relatively unchanged (from $365.1 to $365.1 billion); state revenues decreased by 0.6 percent (from $385.9 to $383.8 billion); and federal revenues increased by 43.2 percent (from $61.8 to $88.4 billion).

Total revenues per pupil averaged $17,015 on a national basis in FY 21. This reflects an increase of 5.9 percent between FY 20 and FY 21 and follows an increase of 1.5 percent from FY 19 to FY 20. The percentage change in revenues per pupil from FY 20 to FY 21 ranged from an increase of 15.3 percent in Maine to a decrease of 4.2 percent in Hawaii.


Image of NPEFS data visualization site showing revenues per pupil for public elementary and secondary schools in FY 20 and FY 21


Revenues from COVID-19 Federal Assistance Funds for public elementary and secondary education totaled $25.3 billion, or 28.6 percent of all federal revenues.

  • Revenues from the Federal Coronavirus Relief Fund accounted for $8.9 billion, or 35.2 percent of total revenues from COVID-19 Federal Assistance Funds.
     
  • Revenues from the Elementary and Secondary School Emergency Relief (ESSER I) Fund accounted for $8.5 billion, or 33.7 percent of total revenues from COVID-19 Federal Assistance Funds.
     
  • Revenues from the Elementary and Secondary School Emergency Relief (ESSER II) Fund accounted for $6.5 billion, or 25.8 percent of total revenues from COVID-19 Federal Assistance Funds.


Expenditures

Current expenditures for public elementary and secondary education across the nation increased by 0.7 percent between FY 20 and FY 21 (from $698.3 to $703.5 billion). Within that increase, expenditures for instruction increased by 1.1 percent between FY 20 and FY 21 (from $422.4 to $427.1 billion), and student support expenditures increased by 3.6 percent between FY 20 and FY 21 (from $44.0 to $45.6 billion).

Current expenditures per pupil for the day-to-day operation of public elementary and secondary schools was $14,295 in FY 21, an increase of 3.5 percent from FY 20.3 In FY 21, education spending was 16.7 percent higher than at the lowest point of the Great Recession in FY 13.


Figure 1. National inflation-adjusted current expenditures per public for public elementary and secondary education: Fiscal years 2012 through 2021


NOTE: Spending is reported in constant FY 21 dollars, based on the Consumer Price Index (CPI). National totals include the 50 states and the District of Columbia. California did not report prekindergarten membership in the State Nonfiscal Survey of Public Elementary/Secondary Education. California reported prekindergarten expenditures separately, and these expenditures were excluded from the amounts reported in this figure.
SOURCE: U.S. Department of Education, National Center for Education Statistics, Common Core of Data (CCD), “National Public Education Financial Survey,” fiscal years 2012 through 2020, Final Version 2a; and fiscal year 2021, Provisional Version 1a; and Digest of Education Statistics 2021, table 106.75. Retrieved March 9, 2023, from nces.ed.gov/programs/digest/d21/tables/dt21_106.75.asp.


Without making adjustments for geographic cost differences, current expenditures per pupil ranged from $9,014 in Utah to $26,097 in New York. In addition to New York, current expenditures per pupil were highest in the District of Columbia ($25,113), Vermont ($24,050), New Jersey ($22,784), and Connecticut ($22,216). In addition to Utah, current expenditures per pupil were lowest in Idaho ($9,054), Arizona ($9,571), Mississippi ($10,060), and Nevada ($10,073). The states with the largest increases in current expenditures per pupil from FY 20 to FY 21 were Maine (11.9 percent), Arizona (7.6 percent), Montana (7.4 percent), Louisiana (7.3 percent), and Massachusetts (6.6 percent).


Image of NPEFS data visualization site showing current expenditures per pupil for public elementary and secondary schools in FY 20 and FY 21


In FY 21, salaries and wages ($389.2 billion) in conjunction with employee benefits ($169.7 billion) accounted for 79.4 percent ($558.8 billion) of current expenditures for public elementary and secondary education. Expenditures for instruction and instructional staff support services comprised 65.8 percent ($462.9 billion) of total current expenditures.

Between FY 20 and FY 21, total expenditures increased by 0.2 percent (from $812.3 to $813.6 billion). Of the $813.6 billion in total expenditures in FY 21, 86.5 percent were current expenditures, 9.8 percent were capital outlay expenditures, 2.7 percent were interest on debt, and 1.1 percent were expenditures for other programs.

Current expenditures from federal Title I grants for economically disadvantaged students (including carryover expenditures) accounted for $16.3 billion, or 2.3 percent of current expenditures for public elementary and secondary education at the national level in FY 21. Nationally, Title I expenditures per pupil averaged $331 and ranged from $123 in Utah to $874 in New York.

Current expenditures paid from COVID-19 Federal Assistance Funds for public elementary and secondary education totaled $24.2 billion for the 50 states and the District of Columbia. Of these, instructional expenditures accounted for $13.7 billion, or 56.5 percent of current expenditures paid from COVID-19 Federal Assistance Funds, and support services expenditures accounted for $9.1 billion, or 37.6 percent of current expenditures paid from COVID-19 Federal Assistance Funds.

To explore data on public elementary and secondary revenues, expenditures, and ADA, check out our new data visualization tool.

Be sure to follow NCES on TwitterFacebookLinkedIn, and YouTube and subscribe to the NCES News Flash to stay up-to-date on the latest from the National Public Education Financial Survey.


By Stephen Q. Cornman, NCES, and Malia Howell and Jeremy Phillips, U.S. Census Bureau


[1] Spending refers to current expenditures. Current expenditures are composed of expenditures for the day-to-day operation of schools and school districts for public elementary and secondary education, including expenditures for staff salaries and benefits, supplies, and purchased services. Current expenditures include instruction, instruction-related, support services (e.g., social work, health, and psychological services), and other elementary/secondary current expenditures but exclude expenditures on capital outlay, other programs, and interest on long-term debt.

[2] Throughout this blog post, all comparisons between years are adjusted for inflation by converting the figures to constant dollars. Inflation adjustments utilize the Consumer Price Index (CPI) published by the U.S. Department of Labor, Bureau of Labor Statistics. For comparability to fiscal education data, NCES adjusts the CPI from a calendar year to a school fiscal year basis (July through June). See Digest of Education Statistics 2021, table 106.70.

[3] Per pupil expenditures are calculated using student membership derived from the State Nonfiscal Survey of Public Elementary/Secondary Education. In some states, adjustments are made to ensure consistency between membership and reported fiscal data. More information on these adjustments can be found in the data file documentation.

Public State and Local Education Job Openings, Hires, and Separations for January 2023

As the primary statistical agency of the U.S. Department of Education, the National Center for Education Statistics (NCES) is mandated to report complete statistics on the condition of American education. While the condition of an education system is often assessed through indicators of achievement and attainment, NCES is also mandated to report on the conditions of the education workplace.

As such, NCES has reported timely information from schools. For example, this past December, NCES released data that indicated that public schools have experienced difficulty filling positions throughout the COVID-19 pandemic.1 In order to understand the broader labor situation, NCES is utilizing the Job Openings and Labor Turnover Survey to describe the tightness of the job market.

JOLTS Design

The Job Openings and Labor Turnover Survey (JOLTS), conducted by the U.S. Bureau of Labor Statistics (BLS), provides monthly estimates of job openings, hires, and total separations. The purpose of JOLTS data is to serve as demand-side indicators of labor shortages at the national level.2

The JOLTS program reports labor demand and turnover estimates by industry, including education.3 As such, this analysis focuses on the public state and local education industry (“state and local government education” as referred to by JOLTS),4 which includes all persons employed by public elementary and secondary school systems and postsecondary institutions.

The JOLTS program does not produce estimates by Standard Occupational Classification.5 When reviewing these findings, please note occupations6 within the public state and local education industry vary7 (e.g., teachers and instructional aides, administrators, cafeteria workers, transportation workers). Furthermore, as the JOLTS data are tabulated at the industry level, the estimates are inclusive of the elementary, secondary, and postsecondary education levels.

Analysis

In this blog post, we present selected estimates on the number and rate of job openings, hires, and total separations (quits, layoffs and discharges, and other separations). The job openings rate is computed by dividing the number of job openings by the sum of employment and job openings. All other metric rates (hires, total separations, quits, layoffs and discharges, and other separations) are defined by taking the number of each metric and dividing it by employment. Fill rate is defined as the ratio of the number of hires to the number of job openings, and the churn rate is defined as the sum of the rate of hires and the rate of total separations.8


Table 1. Number of job openings, hires, and separations and net change in employment in public state and local education, in thousands: January 2020 through January 2023

*Significantly different from January 2023 (p < .05).
1 Net employment changes are calculated by taking the difference between the number of hires and the number of separations. When the number of hires exceeds the number of separations, employment rises—even if the number of hires is steady or declining. Conversely, when the number of hires is less than the number of separations, employment declines—even if the number of hires is steady or rising.
NOTE: Data are not seasonally adjusted. Detail may not sum to totals because of rounding.
SOURCE: U.S. Department of Labor, Bureau of Labor Statistics, Job Openings and Labor Turnover Survey (JOLTS), 2020–2023, based on data downloaded April 5, 2023, from https://data.bls.gov/cgi-bin/dsrv?jt.


Table 2. Rate of job openings, hires, and separations in public state and local education and fill and churn rates: January 2020 through January 2023

*Significantly different from January 2023 (p < .05).
NOTE: Data are not seasonally adjusted. Detail may not sum to totals because of rounding.
SOURCE: U.S. Department of Labor, Bureau of Labor Statistics, Job Openings and Labor Turnover Survey (JOLTS), 2020–2023, based on data downloaded April 5, 2023, from https://data.bls.gov/cgi-bin/dsrv?jt.


Overview of January 2023 Estimates

The number of job openings in public state and local education was 303,000 on the last business day of January 2023, which was higher than in January 2020 (239,000) (table 1). In percentage terms, 2.8 percent of jobs had openings in January 2023, which was higher than in January 2020 (2.2 percent) (table 2). The number of hires in public state and local education was 218,000 in January 2023, which was higher than in January 2020 (177,000) (table 1). This suggests there was a greater demand for public state and local education employees in January 2023 than before the pandemic (January 2020), and there were more people hired in January 2023 than before the pandemic (January 2020). The number of job openings at the end of January 2023 (303,000) was nearly 1.4 times the number of staff hired that month (218,000). In addition, the fill rate for that month was less than 1, which suggests a need for public state and local government education employees that was not being filled completely by January 2023.

The number of total separations in the state and local government education industry in January 2023 was not measurably different from the number of separations observed in January 2020 or January 2022. However, there was a higher number of total separations in January 2023 (127,000) than in January 2021 (57,000), which was nearly a year into the pandemic. In January 2023, the number of quits (76,000) was higher than the number of layoffs and discharges (36,000). Layoffs and discharges accounted for 28 percent of total separations in January 2023 (which was not measurably different from the percentage of layoffs and discharges out of total separations in January 2021), while quits accounted for 60 percent of total separations (which was not measurably different from the percentage of quits out of total separations in January 2021). These data suggest that there were similar distributions in the reasons behind the separations within the state and local government education industry between 2021 and 2023 in the month of January.


By Josue DeLaRosa, NCES


[1] U.S. Department of Education, National Center for Education Statistics. Forty-Five Percent of Public Schools Operating Without a Full Teaching Staff in October, New NCES Data Show. Retrieved March 28, 2023, from https://nces.ed.gov/whatsnew/press_releases/12_6_2022.asp.
 

[2] U.S. Bureau of Labor Statistics. Job Openings and Labor Turnover Survey. Retrieved March 28, 2023, from https://www.bls.gov/jlt/jltover.htm.

[3] For more information about these estimates, see https://www.bls.gov/news.release/jolts.tn.htm.

[4] JOLTS refers to this industry as state and local government education, which is designated as ID 92.

[5] For more information on the reliability of JOLTS estimates, see https://www.bls.gov/jlt/jltreliability.htm.

[6] North American Industry Classification System (NAICS) is a system for classifying establishments (individual business locations) by type of economic activity. The Standard Occupational Classification (SOC) classifies all occupations for which work is performed for pay or profit. To learn more on the differences between NAICS and SOC, see https://www.census.gov/topics/employment/industry-occupation/about/faq.html.

[7] JOLTS data are establishment based, and there is no distinction between occupations within an industry. If a teacher and a school nurse were hired by an establishment coded as state and local government education, both would fall under that industry. (From email communication with JOLTS staff, April 7, 2023.)

[8] Skopovi, S., Calhoun, P., and Akinyooye, L. Job Openings and Labor Turnover Trends for States in 2020. Beyond the Numbers: Employment & Unemployment, 10(14). Retrieved March 28, 2023, from https://www.bls.gov/opub/btn/volume-10/jolts-2020-state-estimates.htm.

NCES Celebrates LGBTQ+ Pride Month

June is LGBTQ+ Pride Month, and NCES is proud to share some of the work we have undertaken to collect data on the characteristics and well-being of sexual and gender minority populations.

Inclusion of questions about sexual orientation and gender identity on federal surveys allows for better understanding of sexual and gender minority populations relative to the general population. These sexual orientation and gender identity (SOGI) data meet a critical need for information to understand trends within larger population groups, and insights gained from analysis of the data can lead to potential resources and needed interventions being provided to better serve the community. Giving respondents the opportunity to describe themselves and bring their “whole self” to a questionnaire helps them to be seen and heard by researchers and policymakers.

Sometimes, NCES is asked why questions like this appear on an education survey. They can be sensitive questions for some people, after all. NCES asks these questions to be able to understand the different experiences, equity, and outcomes related to education for sexual and gender minorities, just as NCES does for groups identified by other demographic characteristics like race, ethnicity, household income, and what part of the country someone lives in. By sexual minorities, we mean people who report their sexual orientation to be something other than straight or heterosexual, and by gender minorities, we mean people whose sex as recorded at birth is different from their gender.

Over the past 10 years, NCES has researched how to best ask respondents about their sexual orientation and gender identity, how respondents react to these questions, and the quality of data that NCES has collected on these characteristics.

At NCES, several studies include background questions for adults about their sexual orientation and gender identity. These are the High School Longitudinal Study: 2009 (HSLS:09) Second Follow-up in 2016, the Baccalaureate and Beyond Longitudinal Study (B&B) 08/18 and 16/21 collections, the National Postsecondary Student Aid Study (NPSAS) in 2020, and the Beginning Postsecondary Students Longitudinal Study (BPS) 2020/22 (see table below for more details about these surveys).


The collection of these data allows NCES to describe the experiences of gender and sexual minority individuals. For example:

  • In 2020, postsecondary students who identified as genderqueer, gender nonconforming, or a different identity had difficulty finding safe and stable housing at three times the rate (9 percent) of students who identified as male or female (3 percent each).1
     
  • In 2018, about 10 years after completing a 2007–08 bachelor’s degree, graduates who were gender minorities2 described their financial situations. Graduates who were gender minorities were less likely to own a home (31 percent) or hold a retirement account (74 percent) than graduates who were not gender minorities (63 percent and 87 percent, respectively) (figure 1).3  

Figure 1. Percentage of 2007–08 bachelor’s degree recipients who owned a home, had a retirement account, reported negative net worth, and did not meet essential expenses in the past 12 months, by gender minority status in 2018

NOTE: “Retirement account” includes both employer-based retirement accounts such as 401(k), 403(b), and pensions, and non-employer-based retirement accounts such as individual retirement accounts. Respondents are considered to have negative net worth if they would still be in debt after selling all their major possessions, turning all their investments and other assets into cash, and paying off as many debts as they could. “Did not meet essential expenses” refers to being unable to meet essential living expenses such as mortgage or rent payments, utility bills, or important medical care. “Past 12 months” refers to any of the 12 months preceding the interview. Gender minority indicates whether the respondent’s gender identity differed from the sex assigned at birth. Gender identity categories include male; female; transgender, male-to-female; transgender, female-to-male; genderqueer or gender nonconforming; a different gender identity; and more than one gender identity.
SOURCE: U.S. Department of Education, National Center for Education Statistics, 2008/18 Baccalaureate and Beyond Longitudinal Study (B&B:08/18).


  • In the 2017–18 school year, 18 percent of public schools had a recognized student group that promoted the acceptance of students’ sexual orientation and gender identity, such as a Gay-Straight Alliance (GSA). This was an increase from the 2015–16 school year, in which 12 percent of schools reported having a GSA.4
     
  • For 2008 bachelor’s degree graduates with a full-time job in 2018, straight people reported higher average salaries than either lesbian/gay or bisexual people.  

NCES is committed to collecting data about equity in education and describing the experiences of SGM students, graduates, and educators.

To learn more about the research conducted at NCES and across the federal statistical system on the measurement of SOGI, please visit the Federal Committee on Statistical Methodology (FCSM) website and check out these two presentations from the FCSM 2022 Research and Policy Conference: How do you Describe Yourself in the Workplace? Asking Teachers about their Sexual Orientation and Gender Identity in a School Survey and Assessing Open-Ended Self-Reports of Sexual Orientation and Gender Identity: Is There Room For Improvement?.


By Maura Spiegelman and Elise Christopher, NCES


[1] U.S. Department of Education, National Center for Education Statistics, 2019–20 National Postsecondary Student Aid Study (NPSAS:20, preliminary data).

[2] On the NCES surveys mentioned above, gender identity categories include male; female; transgender, male-to-female; transgender, female-to-male; genderqueer or gender nonconforming; a different gender identity; and more than one gender identity.

[3] U.S. Department of Education, National Center for Education Statistics, 2008/18 Baccalaureate and Beyond Longitudinal Study (B&B:08/18).

[4] U.S. Department of Education, National Center for Education Statistics, 2015–16 and 2017–18 School Survey on Crime and Safety (SSOCS).