The Integrated Postsecondary Education Data System (IPEDS) contains comprehensive data on postsecondary institutions. IPEDS gathers information from every college, university, and technical and vocational institution that participates in federal student financial aid programs. The Higher Education Act of 1965, as amended, requires institutions that participate in federal student aid programs to report data on enrollments, program completions, graduation rates, faculty and staff, finances, institutional prices, and student financial aid.
These data are made available to the public in a variety of ways via the IPEDS Use the Data webpage. This blog post provides a description of available IPEDS data tools as well as considerations for determining the appropriate tool to use.
Available Data Tools
|
College Navigator
College Navigator is a free consumer information tool designed to help students, parents, high school counselors, and others access information about postsecondary institutions.
Note that this tool can be found on the Find Your College webpage (under "Search for College"), along with various other resources to help users plan for college.
|
IPEDS provides data tools for a variety of users that are organized into three general categories: (1) Search Existing Data, (2) Create Custom Data Analyses, and (3) Download IPEDS Data.
Search Existing Data
Users can search for aggregate tables, charts, publications, or other products related to postsecondary education using the Data Explorer or access IPEDS data via NCES publications like the Digest of Education Statistics or the Condition of Education.
Create Custom Data Analyses
Several data tools allow users to create their own custom analyses with frequently used and derived variables (Data Trends) or all available data collected within IPEDS (Statistical Tables). Users can also customize tables for select subgroups of institutions (Summary Tables). Each of these options allows users to generate analyses within the limitations of the tool itself.
For example, there are three report types available under the Data Feedback Report (DFR) tool. User can
- select data from the most recent collection year across frequently used and derived variables to create a Custom DFR;
- create a Statistical Analysis Report using the variables available for the Custom DFR; and
- access the NCES developed DFR for any institution.
Download IPEDS Data
Other data tools provide access to raw data through a direct download (Complete Data Files) or through user selections in the IPEDS Custom Data Files tool. In addition, IPEDS data can be downloaded for an entire collection year for all survey components via the Access Database.
|
IPEDS Data Tools Help
The IPEDS Data Tools User Manual is designed to help guide users through the various functions, processes, and abundant capabilities of IPEDS data tools. The manual contains a wealth of information, hints, tips, and insights for using the tools.
|
Data Tool Considerations
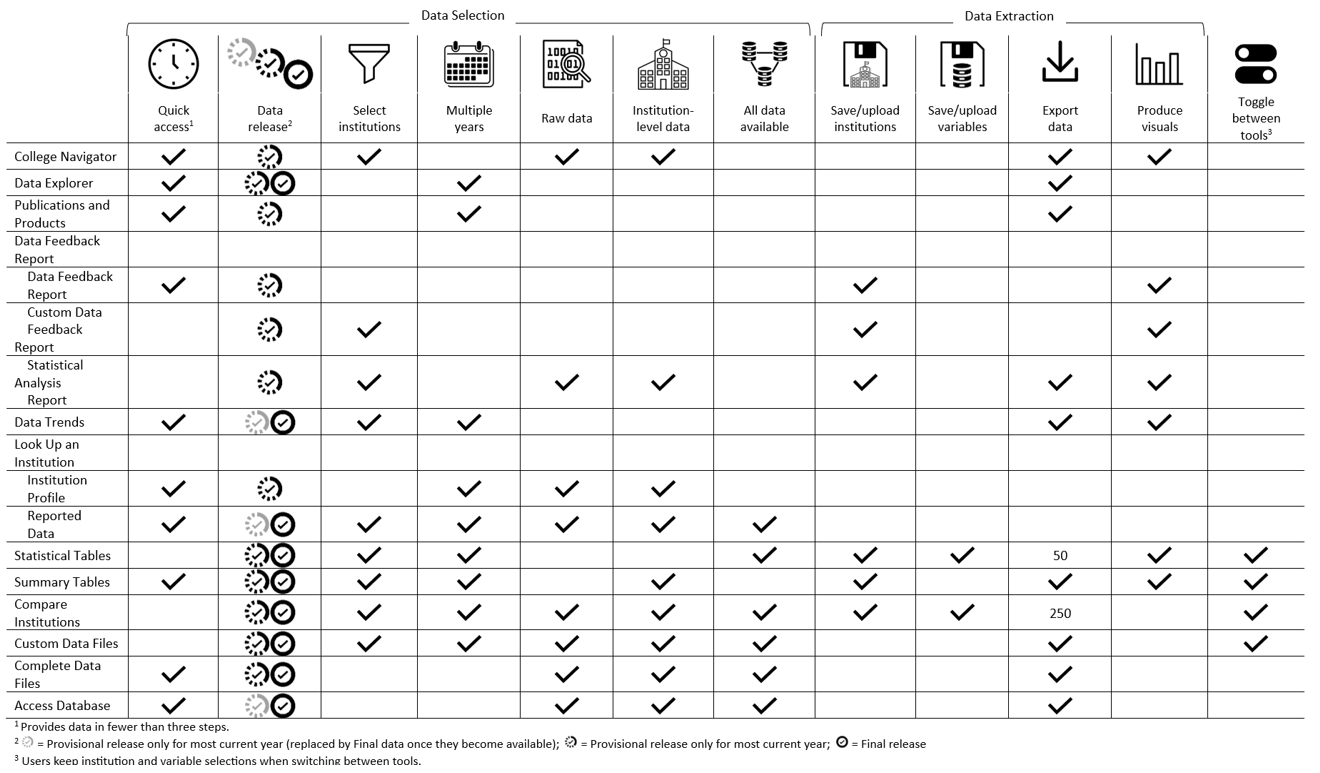
Users may consider several factors—related to both data selection and data extraction—when determining the right tool for a particular question or query.
Data Selection
-
Quick access – Accessing data in a few steps may be helpful for users who want to find data quickly. Several data tools provide data quickly but may be limited in their selection options or customizable output.
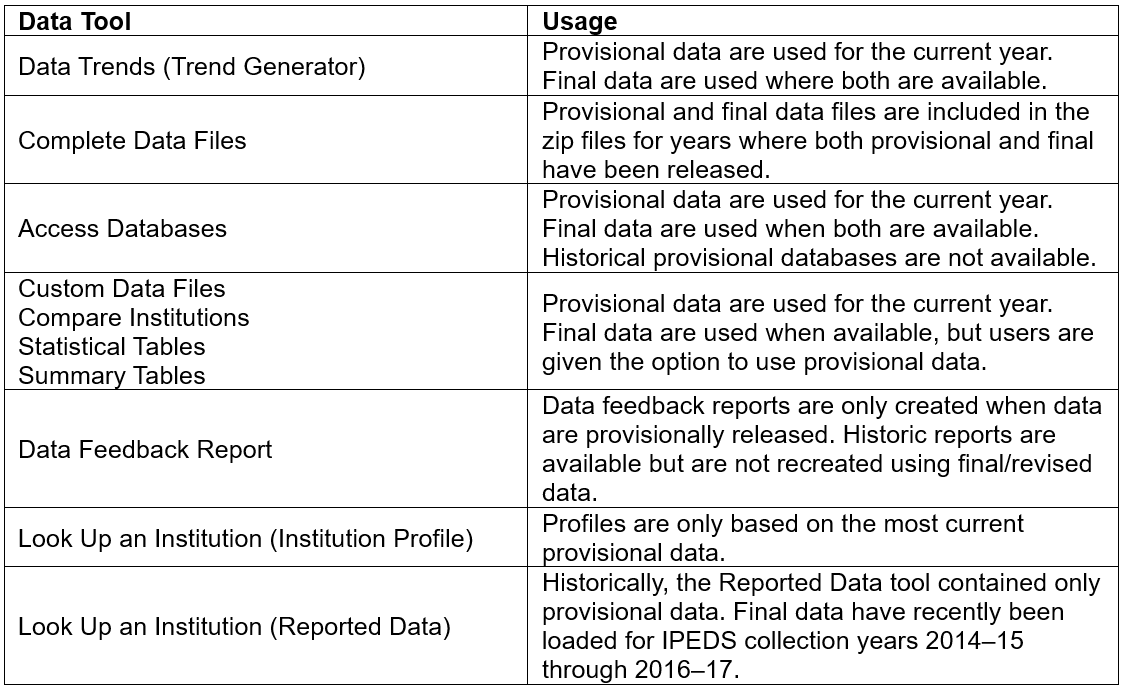
- Data release – IPEDS data are released to the public in two phases: Provisional and Final. Provisional data have undergone quality control procedures and imputation for missing data but have not been updated based on changes within the Prior Year Revision System. Final data reflect changes made within the Prior Year Revision System and additional quality control procedures and will not change. Some tools allow users to access only final data. Table 1 summarizes how provisional and final data are used by various data tools. The IPEDS resource page “Timing of IPEDS Data Collection, Coverage, and Release Cycle” provides more information on data releases.
Table 1. How provisional and final data are used in various data tools

- Select institutions – Users may want to select specific institutions for their analyses. Several tools allow users to limit the output for a selected list of institutions while others include all institutions in the output.
- Multiple years – While some tools provide a single year of data, many tools provide access to multiple years of data in a single output.
- Raw data – Some data tools provide access to the raw data as submitted to IPEDS. For example, Look Up an Institution allows users access to survey forms submitted by an institution.
- Institution-level data – Many data tools provide data at the institution level, since this is the unit of analysis within the IPEDS system.
- All data available – Many data tools provide access to frequently used and derived variables, but others provide access to the entirety of variables collected within the IPEDS system.
Data Extraction
-
Save/upload institutions – Several data tools allow a user to create and download a list of institutions, which can be uploaded in a future session.
- Save/upload variables – Two data tools allow a user to save the variables selected and upload in a future session.
- Export data – Many data tools allow a user to download data into a spreadsheet, while others provide information within a PDF. Note that several tools have limitations on the number of variables that can be downloaded in a session (e.g., Compare Institutions has a limit of 250 variables).
- Produce visuals – Several data tools produce charts, graphs, or other visualizations. For example, Data Trends provides users with the opportunity to generate a bar or line chart and text table.
Below is a graphic that summarizes these considerations for each IPEDS data tool (click the image to enlarge it).

To find training opportunities—including video tutorials, workshops, and keyholder courses—check out the IPEDS Training Center. Plus, access the IPEDS Distance Learning Dataset Training modules for more guidance on how to use IPEDS data. For additional questions, call the IPEDS Data Use Help Desk at (866) 558-0658 or e-mail ipedstools@rti.org.
By Tara B. Lawley, NCES, and Eric S. Atchison, Arkansas State University System and Association for Institutional Research IPEDS Educator