NCES Blog

National Center for Education Statistics

Changes in Pupil/Teacher Ratios in 2020: Impacts of the COVID-19 Pandemic

The COVID-19 pandemic has brought enormous challenges to the education system, including a historic decline in enrollment in fall 2020—the largest since during World War II. Due to the relatively small decrease in the number of teachers, there was a significant drop in the pupil/teacher ratio.  

The National Center for Education Statistics (NCES) releases key statistics, including school staffing data, compiled from state administrative records through the Common Core of Data (CCD). In 2019, about 48 percent of public school staff were teachers (3.2 million) and 13 percent were instructional aides (0.9 million). NCES’s new School Pulse Panel survey found that in January 2022, about 61 percent of public schools with at least one vacancy reported that the pandemic increased the number of teacher and staff vacancies, and 57 percent of schools with at least one vacancy found that the pandemic forced them to use teachers outside their normal duty areas.

Pupil/teacher ratios provide a measure of the quantity of instructional resources available to students by comparing the number of students with the total full-time equivalent (FTE) of all teachers, including special education teachers. The public and private elementary and secondary average class size is larger than the pupil/teacher ratio since it normally does not factor into team teaching, specialty teachers, or special education classes. Between fall 2019 and fall 2020, enrollment in public elementary and secondary schools1 decreased by 2.7 percent.2 This decrease was larger than the 0.2 percent (6,700)3 decrease in the number of public school teachers. Since fall 2020, public school enrollment decreased by a larger amount than did the number of teachers. Thus, the pupil/teacher ratio declined in school year 2020–21 by a relatively large 0.5 pupils per teacher, from 15.9 to 15.4 pupils per teacher (figure 1). This is the largest 1-year decrease in more than 4 decades. In comparison, the pupil/teacher ratio for private schools was 11.4 in 2019–20 (the latest year of actual data available). It is worth noting that pupil/teacher ratios vary across schools with different characteristics (table 208.10).

Viewed over a longer term, the pupil/teacher ratio in public schools in 2019–20 (15.9) was only slightly lower than in 2010–11 (16.0), so nearly all the change during the 2010–11 to 2020–21 period occurred in the last year. The pupil/teacher ratio for private schools decreased from 12.5 in 2010–11 to 11.4 in 2019–20.


Figure 1. Pupil/teacher ratio in public and private elementary and secondary schools: 2010–11 to 2020–21

Line graph showing pupil/teacher ratio in public and private elementary and secondary schools from 2010–11 to 2020–21

NOTE: Data in this figure represent the 50 states and the District of Columbia. Data for teachers are expressed in full-time equivalents (FTE). Counts of private school enrollment include prekindergarten through grade 12 in schools offering kindergarten or higher grades. Counts of private school teachers exclude teachers who teach only prekindergarten students. Counts of public school teachers and enrollment include prekindergarten through grade 12. The pupil/teacher ratio includes teachers for students with disabilities and other special teachers, while these teachers are generally excluded from class size calculations. Ratios for public schools reflect totals reported by states and differ from totals reported for schools or school districts.  The school year 2020–21 pupil/teacher ratio shown in this figure includes only states which reported both membership and FTE teacher counts for SY 2020–21.

SOURCE: U.S. Department of Education, National Center for Education Statistics, Digest of Education Statistics 2021, table 208.20; Common Core of Data, table 2.


The declines in pupil/teacher ratios in public schools were not consistent across states between 2019–20 and 2020–21 (figure 2). The relatively large enrollment decreases in many states—along with the smaller decreases or even increases in the number of teachers in fall 2020—led to decreases in the pupil/teacher ratios for most states. Three states (Nevada, Florida, and Ohio) reported increases in their pupil/teacher ratios, and the rest of the states reporting data had decreases in their pupil/teacher ratios. The states with the largest decreases in their pupil/teacher ratios were Indiana (-1.3 pupils per teacher), Arizona (-1.1 pupils per teacher), Kansas (-0.9 pupils per teacher), and Kentucky (-0.9 pupils per teacher).4


Figure 2. Change in pupil/teacher ratios in public elementary and secondary schools, by state: 2019–20 to 2020–21

Map of United States showing increases and decreases in pupil/teacher ratios in public elementary and secondary schools from 2019–20 to 2020–21

NOTE: Data for Illinois and Utah are not available.

SOURCE: U.S. Department of Education, National Center for Education Statistics, Common Core of Data (CCD), “State Nonfiscal Public Elementary/Secondary Education Survey,” 2019–20 v.1a, table 2, and 2020–21 v.1a, table 2.


By Tom Snyder, AIR


[1] Counts of public school teachers and enrollment include prekindergarten through grade 12.

[2] Enrollment data are for fall of the school year while pupil/teacher ratios are based on school years.

[3] Includes imputed teacher FTE data for Illinois and Utah.

[4] Although Oregon had a 2 pupil per teacher decrease based on the Summary Table 2 for 2019–20 and 2020–21, Oregon did not submit prekindergarten data for 2020–21, so the ratios were not comparable.

NCES's Top Hits of 2021

As 2021—another unprecedented year—comes to a close and you reflect on your year, be sure to check out NCES’s annual list of top web hits. From reports and Condition of Education indicators to Fast Facts, APIs, blog posts, and tweets, NCES releases an array of content to help you stay informed about the latest findings and trends in education. Don’t forget to follow us on Twitter, Facebook, and LinkedIn to stay up-to-date in 2022!
 

Top five reports, by number of PDF downloads

1. Condition of Education 2020 (8,376)

2Digest of Education Statistics 2019 (4,427)

3. Status and Trends in the Education of Racial and Ethnic Groups 2018 (3,282)

4. Indicators of School Crime and Safety: 2019 (2,906)

5. Trends in High School Dropout and Completion Rates in the United States: 2019 (2,590)


Top five indicators from the Condition of Education, by number of web sessions

1. Students With Disabilities (100,074)

2. Racial/Ethnic Enrollment in Public Schools (64,556)

3. Characteristics of Public School Teachers (57,188)

4. Public High School Graduation Rates (54,504)

5. Education Expenditures by Country (50,20)


Top five Fast Facts, by number of web sessions

1. Back-to-School Statistics (162,126)

2. Tuition Costs of Colleges and Universities (128,236)

3. Dropout Rates (74,399)

4. Graduation Rates (73,855)

5. Degrees Conferred by Race and Sex (63,178)


Top five NCES/EDGE API requested categories of social and spatial context GIS data, by number of requests

1. K–12 Schools (including district offices) (4,822,590)

2. School Districts (1,616,374)

3. Social/Economic (882,984)

4. Locales (442,715)

5. Postsecondary (263,047)


Top five blog posts, by number of web sessions

1. Understanding School Lunch Eligibility in the Common Core of Data (8,242)

2. New Report Shows Increased Diversity in U.S. Schools, Disparities in Outcomes (3,463)

3. Free or Reduced Price Lunch: A Proxy for Poverty? (3,457)

4. Back to School by the Numbers: 2019–20 School Year (2,694)

5. Educational Attainment Differences by Students’ Socioeconomic Status (2,587)


Top five tweets, by number of impressions

1. CCD blog (22,557)


2. NAEP dashboard (21,551)


3. IPEDS data tools (21,323)


4. ACGR web table (19,638)


5. Kids’ Zone (19,390)


By Megan Barnett, AIR

New Data Reveal Public School Enrollment Decreased 3 Percent in 2020–21 School Year

NCES recently released revised Common Core of Data (CCD) Preliminary Files, which are the product of the school year (SY) 2020–21 CCD data collection. CCD, the Department of Education’s primary database on public elementary and secondary education in the United States, provides comprehensive annual data on enrollment, school finances, and student graduation rates.

Here are a few key takeaways from the newly released data files:

Public school enrollment in SY 2020–21 was lower than it was in SY 2019–20.

Overall, the number of students enrolled in public schools decreased by 3 percent from SY 2019–20 to SY 2020–21. Note that Illinois did not submit data in time to be included in this preliminary report. The SY 2019–20 and SY 2020–21 total enrollment counts for California, Oregon, American Samoa, and the Bureau of Indian Education do not include prekindergarten counts.

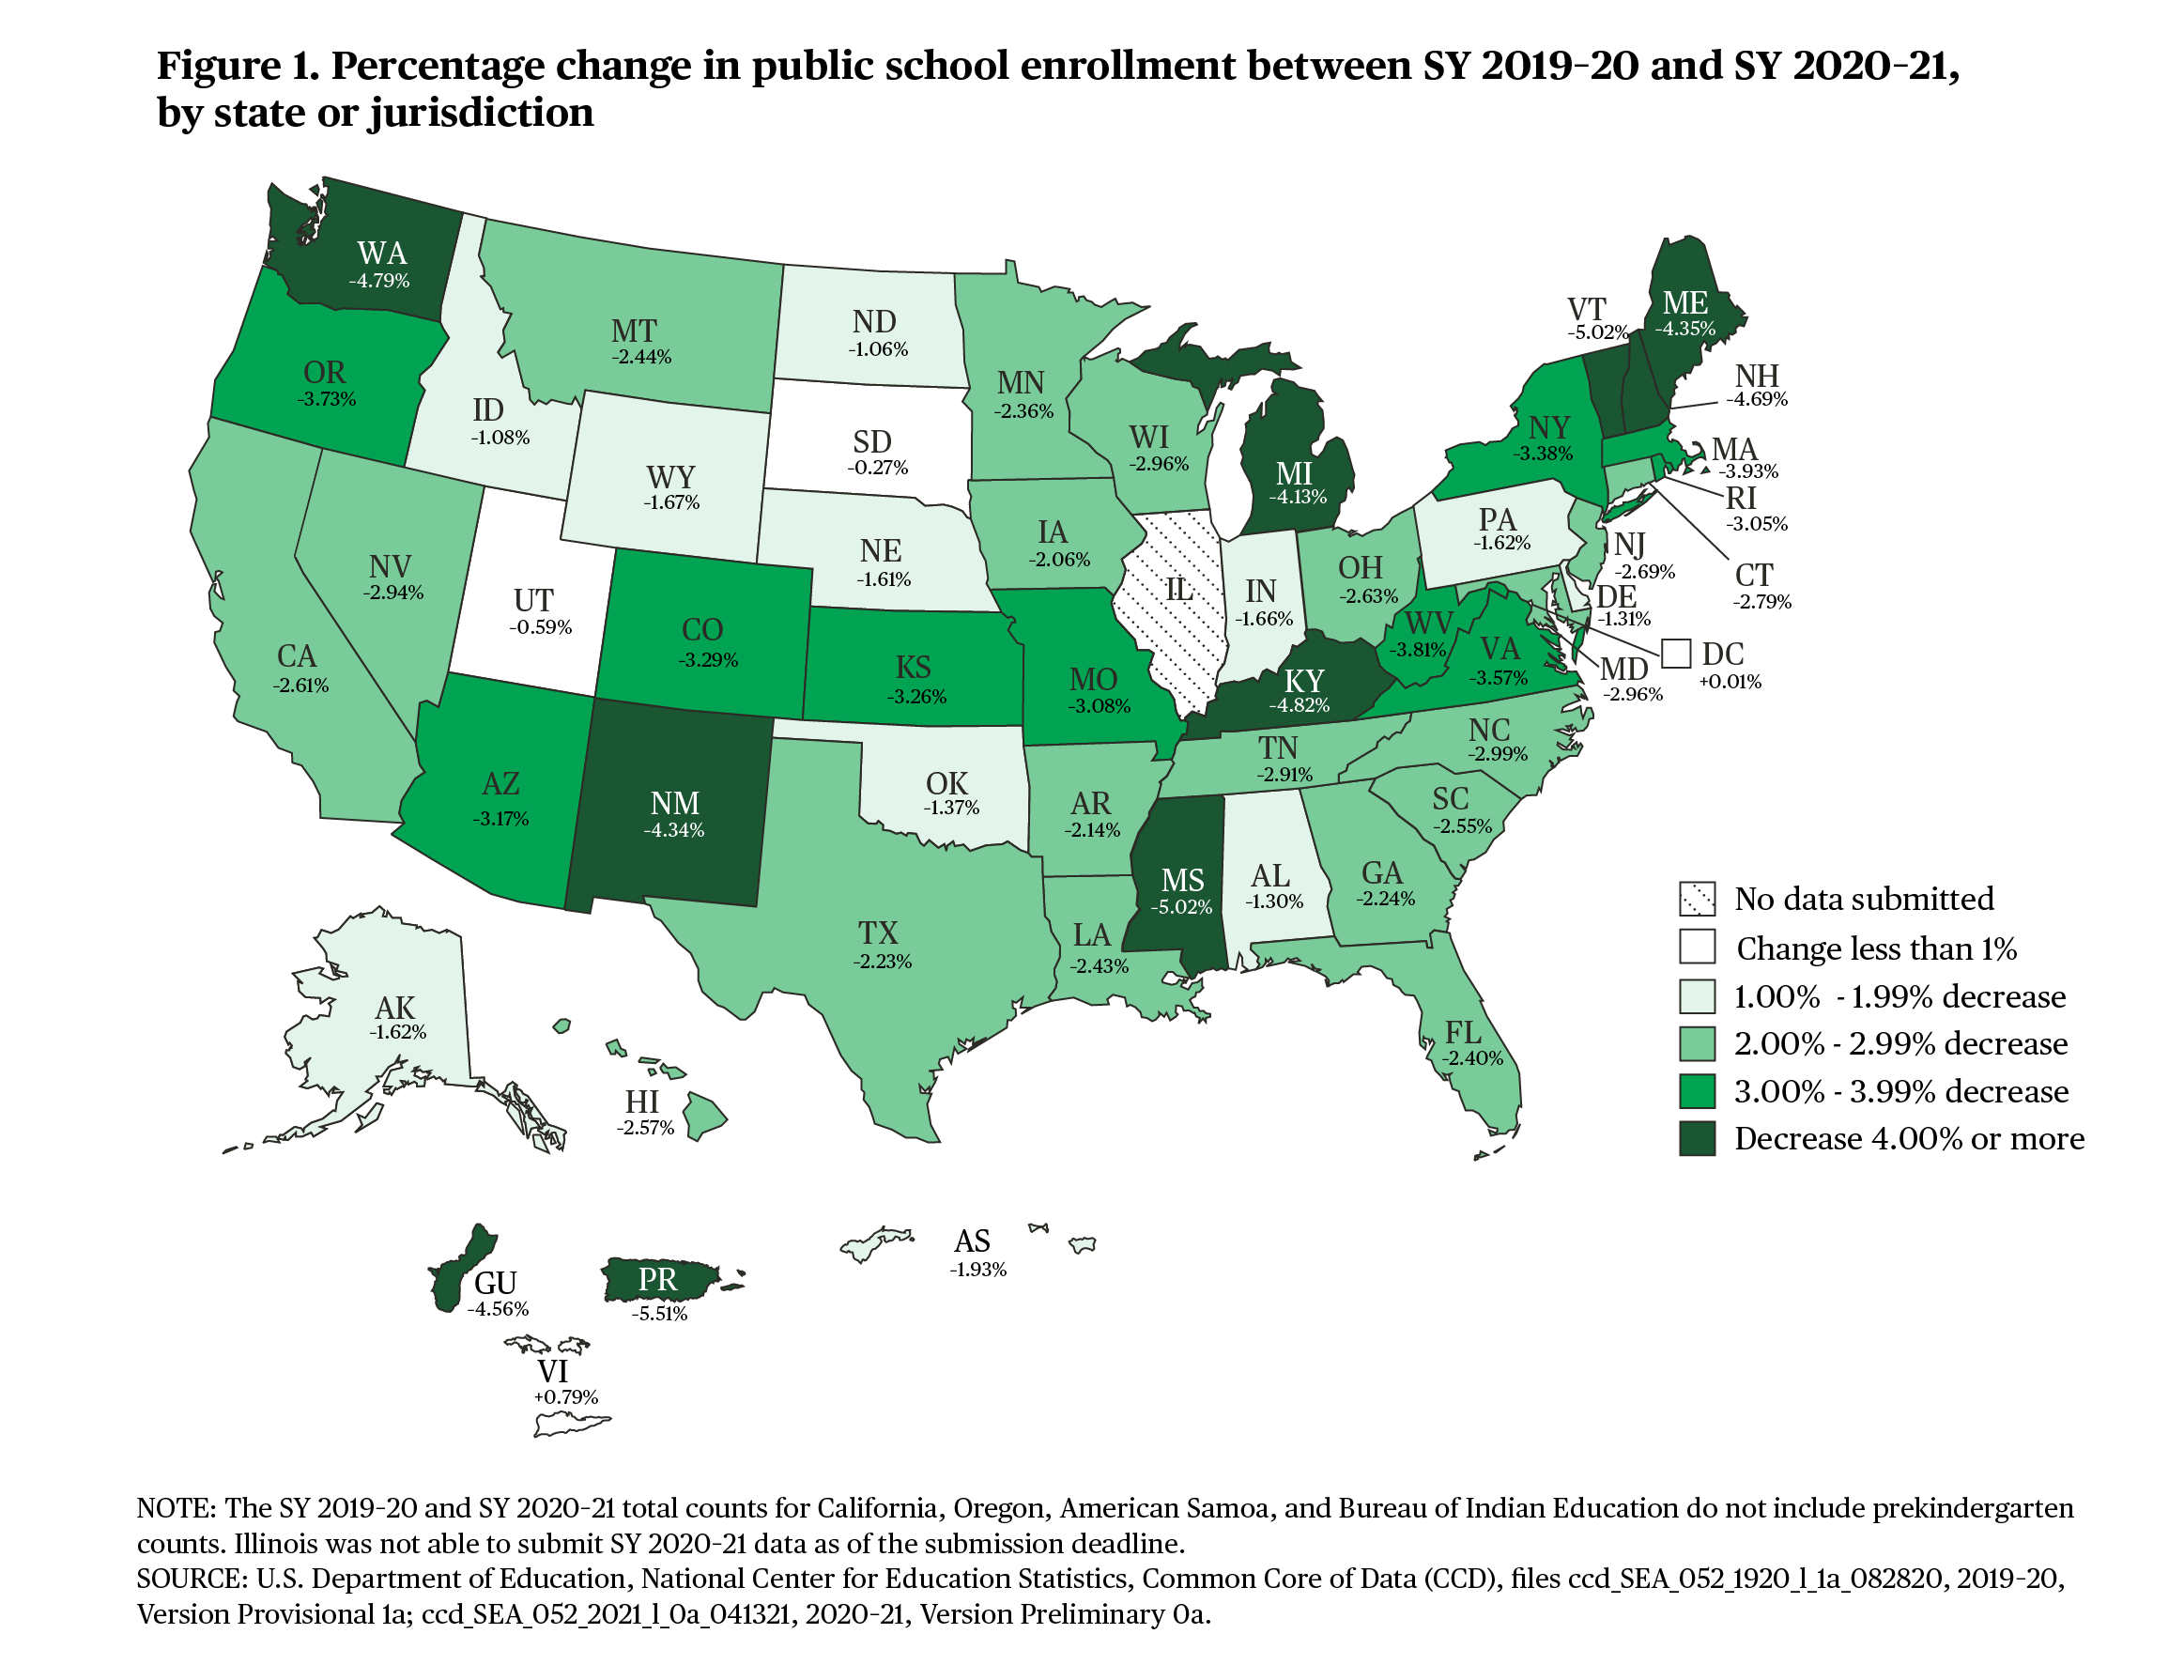
The rate of decline in public school enrollment in SY 2020–21 was not consistent across all states.

Within states, the largest decreases were in Mississippi and Vermont (5 percent each), followed by Washington, New Mexico, Kentucky, New Hampshire, and Maine (each between 4 and 5 percent) (figure 1). Eighteen states had decreases of 3 percent or more; 29 states had decreases between 1 and 3 percent; and the District of Columbia, South Dakota, and Utah had changes of less than 1 percent.


Lower grade levels experienced a greater rate of decline in public school enrollment than did higher grade levels in SY 2020–21.

Public school enrollment decreased by 13 percent for prekindergarten and kindergarten and by 3 percent for grades 1–8. Public school enrollment increased by 0.4 percent for grades 9–12.

Most other jurisdictions experienced declines in public school enrollment in SY 2020–21.

Public school enrollment decreased in Puerto Rico (6 percent), Guam (5 percent), and American Samoa (2 percent). The Virgin Islands, however, experienced an increase of less than 1 percent.

To access the CCD preliminary data files and learn more about public school enrollment in SY 2020–21, visit the CCD data files webpage.

National Spending for Public Schools Increases for the Sixth Consecutive Year in School Year 2018–19

NCES just released a finance tables report, Revenues and Expenditures for Public Elementary and Secondary Education: FY19 (NCES 2021-302), which draws from data in the National Public Education Financial Survey (NPEFS). The results show that spending1 on elementary and secondary education increased in school year 2018–19 (fiscal year [FY] 2019), after adjusting for inflation. This is the sixth consecutive year that year-over-year education spending increased since 2012–13. This increase follows declines in year-over-year spending for the prior 4 years (2009–10 to 2012–13).

Current expenditures per pupil2 for the day-to-day operation of public elementary and secondary schools rose to $13,187 in FY19, an increase of 2.1 percent from FY18, after adjusting for inflation (figure 1).3 Current expenditures per pupil also increased over the previous year in FY18 (by 0.9 percent), in FY17 (by 1.7 percent), in FY16 (by 2.8 percent), in FY15 (by 2.7 percent), and in FY14 (by 1.2 percent). In FY19, education spending was 11.8 percent higher than the lowest point of the Great Recession in FY13 and 6.1 percent higher than spending prior to the Great Recession in FY10.


Figure 1. National inflation-adjusted current expenditures per pupil for public elementary and secondary school districts: FY10 through FY19

NOTE: Spending is reported in constant FY19 dollars, based on the Consumer Price Index (CPI).
SOURCE: U.S. Department of Education, National Center for Education Statistics, Common Core of Data (CCD), "National Public Education Financial Survey," fiscal years 2010 through 2018 Final Version 2a; and fiscal year 2019, Provisional Version 1a; and Digest of Education Statistics 2019, retrieved January 8, 2021, from https://nces.ed.gov/programs/digest/d19/tables/dt19_106.70.asp.


Without adjusting for geographic cost differences, current expenditures per pupil ranged from $7,950 in Utah to $24,882 in New York (figure 2). In addition to New York, current expenditures per pupil were highest in the District of Columbia ($22,831), New Jersey ($21,331), Vermont ($21,217), and Connecticut ($21,140). In addition to Utah, current expenditures per pupil were lowest in Idaho ($8,043), Arizona ($8,773), Nevada ($9,126), and Oklahoma ($9,203).


Figure 2. Current expenditures per pupil for public elementary and secondary education, by state: FY19

NOTE: These data are not adjusted for geographic cost differences.
SOURCE: U.S. Department of Education, National Center for Education Statistics, Common Core of Data (CCD), “National Public Education Financial Survey (NPEFS),” FY19, Provisional Version 1a and “State Nonfiscal Survey of Public Elementary/Secondary Education,” school year 2018–19, Provisional Version 1a.


These new NPEFS data offer researchers extensive opportunities to investigate state and national patterns of revenues and expenditures. Explore the report and learn more.


[1] Spending refers to current expenditures. Current expenditures comprise expenditures for the day-to-day operation of schools and school districts for public elementary/secondary education, including expenditures for staff salaries and benefits, supplies, and purchased services. Current expenditures include instruction, instruction-related support services (e.g., social work, health, psychological services), and other elementary/secondary current expenditures but exclude expenditures on capital outlay, other programs, and interest on long-term debt.
[2] Per pupil expenditures are calculated using student membership derived from the State Nonfiscal Survey of Public Elementary/Secondary Education. In some states, adjustments are made to ensure consistency between membership and reported fiscal data. More information on these adjustments can be found in the data file documentation at https://nces.ed.gov/ccd/files.asp.
[3] In order to compare spending from one year to the next, expenditures are converted to constant dollars, which adjusts figures for inflation. Inflation adjustments utilize the Consumer Price Index (CPI) published by the U.S. Department of Labor, Bureau of Labor Statistics. For comparability to fiscal education data, NCES adjusts the CPI from a calendar year to a school fiscal year basis (July through June). See Digest of Education Statistics 2019, table 106.70, retrieved January 8, 2021, from https://nces.ed.gov/programs/digest/d19/tables/dt19_106.70.asp.


By Stephen Q. Cornman NCES; Lei Zhou, Activate Research; and Malia Howell, U.S. Census Bureau

Identifying Virtual Schools Using the Common Core of Data (CCD)

With the sudden changes in education due to the coronavirus pandemic, virtual instruction is in the spotlight more than ever before. Prior to the pandemic, there were already increasing numbers of virtual public schools that offered instructional programs to those that may have difficulty accessing or attending traditional brick-and-mortar schools. Even before the pandemic, some schools and districts were using virtual instruction in new ways, such as switching to virtual instruction on snow days rather than cancelling school. Throughout the pandemic, schools and districts have been relying more heavily on virtual instruction than ever before.

Since school year (SY) 2013–14, the Common Core of Data (CCD) has included a school-level virtual status flag, which has changed over time. For SY 2020–21, the Department of Education instructed states to classify schools that are normally brick-and-mortar schools but are operating remotely during the pandemic as supplemental virtual (see table below).


SY 201314 Through SY 201516

Virtual status is a Yes/No flag, meaning that a school was either virtual or not virtual based on the following definition: “A public school that offers only instruction in which students and teachers are separated by time and/or location, and interaction occurs via computers and/or telecommunications technologies. A virtual school generally does not have a physical facility that allows students to attend classes on site.”


SY 201617 and Onward

NCES changed the virtual status flag to be more nuanced. Rather than just a Yes/No flag, the reported value indicates virtual status on a spectrum using the following values:


Permitted Value Abbreviation

Definition

FULLVIRTUAL

Exclusively virtual. All instruction offered by the school is virtual. This does not exclude students and teachers meeting in person for field trips, school-sponsored social events, or assessment purposes. All students receive all instruction virtually. Prior to SY 2019–20, this value was labeled as “Fully virtual.”

FACEVIRTUAL

Primarily virtual. The school’s major purpose is to provide virtual instruction to students, but some traditional classroom instruction is also provided. Most students receive all instruction virtually. Prior to SY 2019–20, this value was labeled as “Virtual with face to face options.”

SUPPVIRTUAL

Supplemental virtual. Instruction is directed by teachers in a traditional classroom setting; virtual instruction supplements face-to-face instruction by teachers. Students vary in the extent to which their instruction is virtual.

NOTVIRTUAL

No virtual instruction. The school does not offer any virtual instruction.  No students receive any virtual instruction. Prior to SY 2019–20, this value was labeled as “Not virtual.”


Generally, data users should treat the value “FULLVIRTUAL” (exclusively virtual) under the new approach as the equivalent of Virtual=Yes in the old approach. The virtual flag is a status assigned to a school as of October 1 each school year. 

The number of exclusively virtual schools has increased in the past several years. In SY 2013–14, there were a total of 478 exclusively virtual schools reported in CCD (approximately 0.5% of all operational schools). In SY 2019–20 there were 691 schools (approximately 0.7% of all operational schools) that were exclusively virtual. The student enrollment in exclusively virtual schools also increased from 199,815 students in SY 2013–14 to 293,717 in SY 2019–20, which is an increase from 0.4% of the total student enrollment in public schools to 0.6%.

Of the 691 virtual schools in SY 2019–20, 590 were reported as “regular” schools, meaning they offered a general academic curriculum rather than one focused on special needs or vocational education, 218 were charter schools, and 289 were high schools. Of the 8,673 schools that were reported as either primary virtual or supplemental virtual, 7,727 were regular schools, 624 were charter schools, and 4,098 were high schools.

To see tables summarizing the above data, visit our Data Tables web page and select the nonfiscal tables.

To learn more about the CCD, visit our web page. For more information about how to access CCD data, including tips for using the District and School Locators and the Elementary and Secondary Information System, read the blog post “Accessing the Common Core of Data (CCD).” You can also access the raw data files for additional information about public elementary and secondary schools. Enrollment and staff data for SY 2020–21 are currently being collected, processed, and verified and could be released by spring 2022.


By Patrick Keaton, NCES