NCES Blog

National Center for Education Statistics

U.S. Is Unique in Score Gap Widening in Mathematics and Science at Both Grades 4 and 8: Prepandemic Evidence from TIMSS

Tracking differences between the performance of high- and low-performing students is one way of monitoring equity in education. These differences are referred to as achievement gaps or “score gaps,” and they may widen or narrow over time.

To provide the most up-to-date international data on this topic, NCES recently released Changes Between 2011 and 2019 in Achievement Gaps Between High- and Low-Performing Students in Mathematics and Science: International Results From TIMSS. This interactive web-based Stats in Brief uses data from the Trends in International Mathematics and Science Study (TIMSS) to explore changes between 2011 and 2019 in the score gaps between students at the 90th percentile (high performing) and the 10th percentile (low performing). The study—which examines data from 47 countries at grade 4, 36 countries at grade 8, and 29 countries at both grades—provides an important picture of prepandemic trends.

This Stats in Brief also provides new analyses of the patterns in score gap changes over the last decade. The focus on patterns sheds light on which part of the achievement distribution may be driving change, which is important for developing appropriate policy responses. 


Did score gaps change in the United States and other countries between 2011 and 2019?

In the United States, score gap changes consistently widened between 2011 and 2019 (figure 1). In fact, the United States was the only country (of 29) where the score gap between high- and low-performing students widened in both mathematics and science at both grade 4 and grade 8.


Figure 1. Changes in scores gaps between high- and low-performing U.S. students between 2011 and 2019
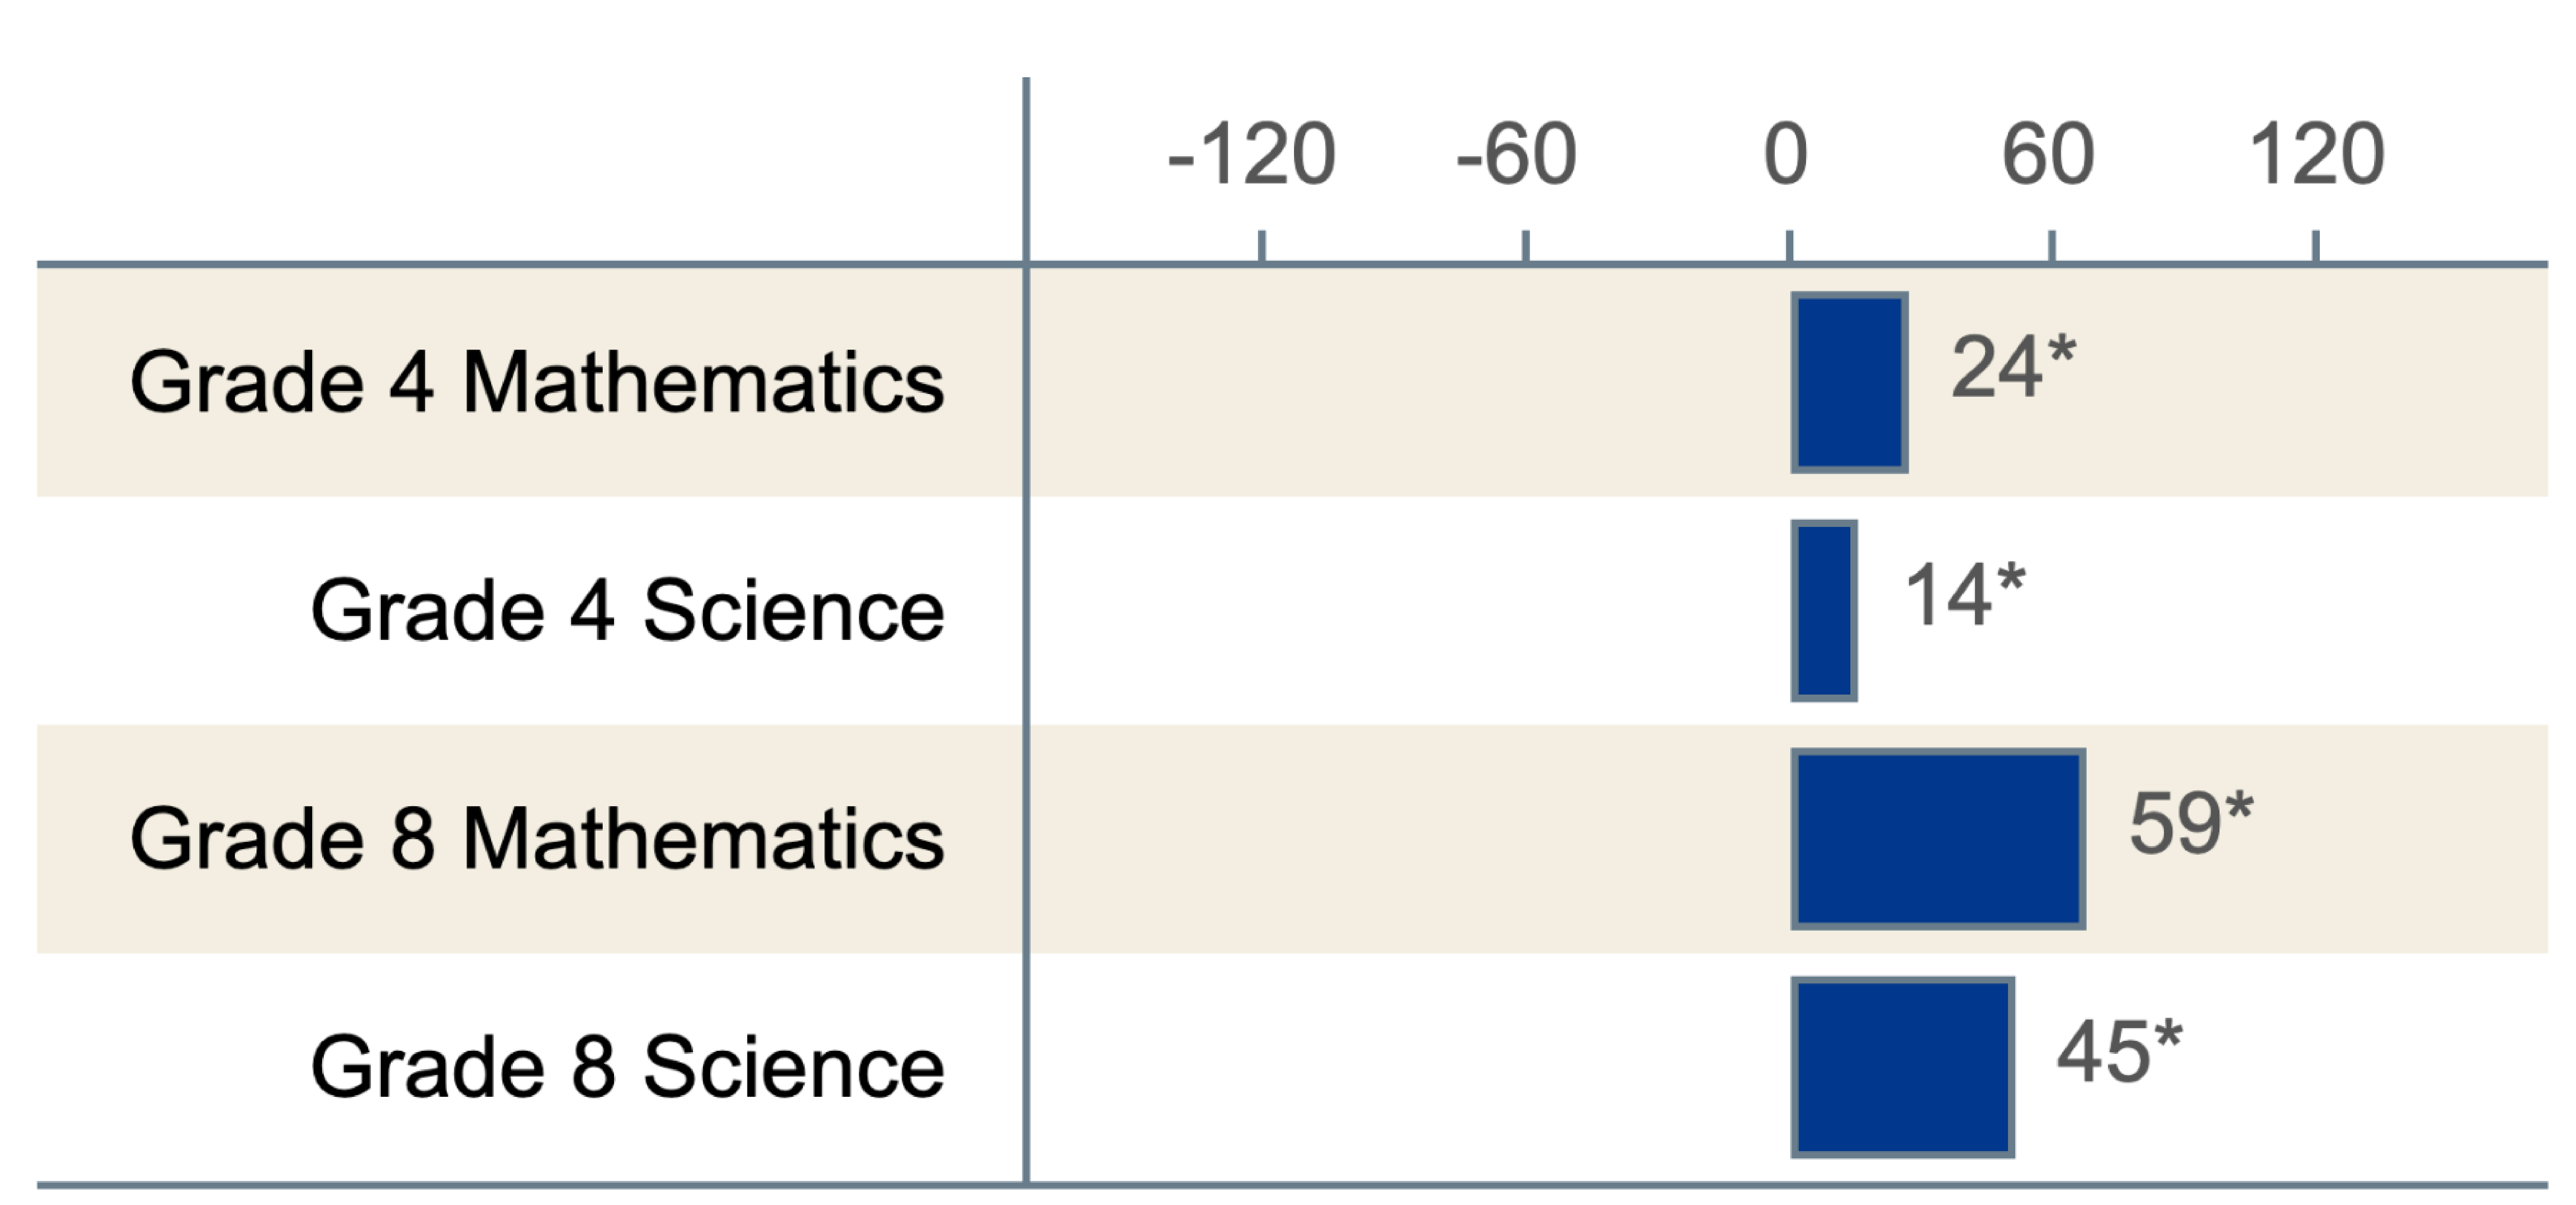
Horizontal bar chart showing changes in scores gaps between high- and low-performing U.S. students between 2011 and 2019

* p < .05. Change in score gap is significant at the .05 level of statistical significance.

SOURCE: Stephens, M., Erberber, E., Tsokodayi, Y., and Fonseca, F. (2022). Changes Between 2011 and 2019 in Achievement Gaps Between High- and Low-Performing Students in Mathematics and Science: International Results From TIMSS (NCES 2022-041). U.S. Department of Education. Washington, DC: National Center for Education Statistics, Institute of Education Sciences. Available at https://nces.ed.gov/pubsearch/pubsinfo.asp?pubid=2022041.


For any given grade and subject combination, no more than a quarter of participating countries had a score gap that widened, and no more than a third had a score gap that narrowed—further highlighting the uniqueness of the U.S. results.


Did score gaps change because of high-performing students, low-performing students, or both?

At grade 4, score gaps widened in the United States between 2011 and 2019 due to decreases in low-performing students’ scores, while high-performing students’ scores did not measurably change (figure 2). This was true for both mathematics and science and for most of the countries where score gaps also widened.


Figure 2. Changes in scores of high- and low-performing U.S. students between 2011 and 2019
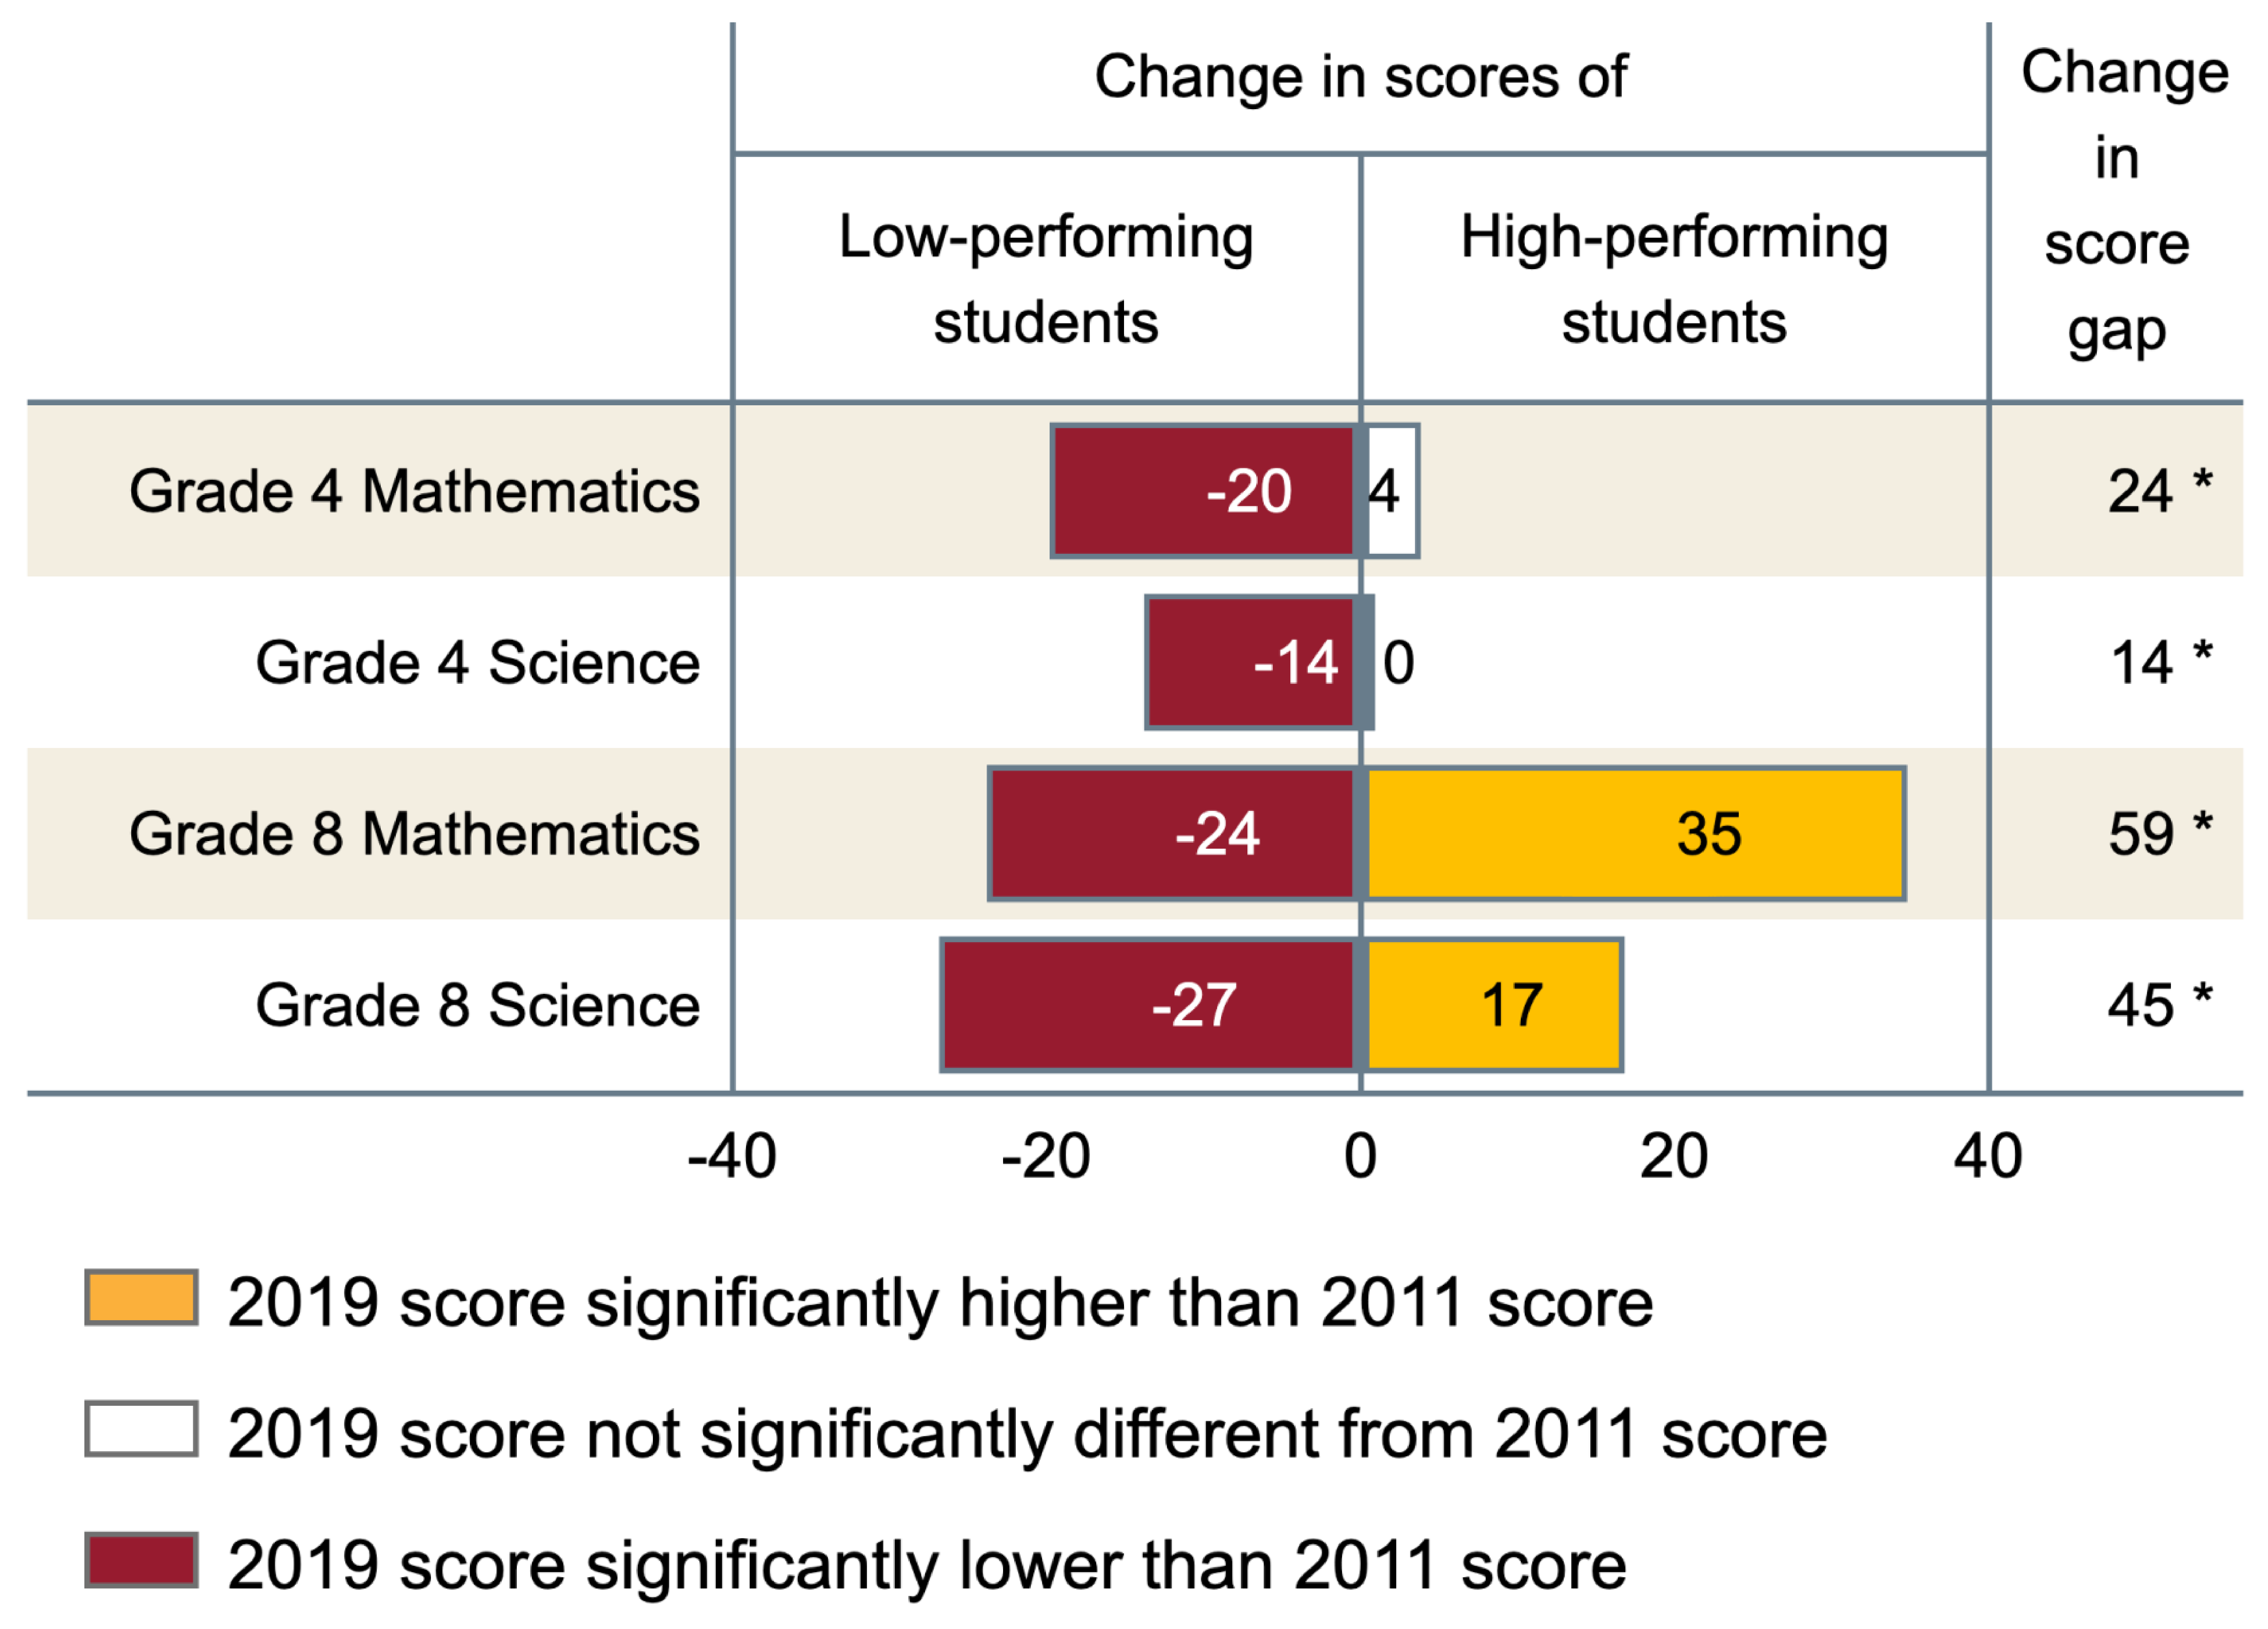
Horizontal bar chart showing changes in scores of high- and low-performing U.S. students between 2011 and 2019 and changes in the corresponding score gaps

p < .05. 2019 score gap is significantly different from 2011 score gap.

SOURCE: Stephens, M., Erberber, E., Tsokodayi, Y., and Fonseca, F. (2022). Changes Between 2011 and 2019 in Achievement Gaps Between High- and Low-Performing Students in Mathematics and Science: International Results From TIMSS (NCES 2022-041). U.S. Department of Education. Washington, DC: National Center for Education Statistics, Institute of Education Sciences. Available at https://nces.ed.gov/pubsearch/pubsinfo.asp?pubid=2022041.


Low-performing U.S. students’ scores also dropped in both subjects at grade 8, but at this grade, they were accompanied by rises in high-performing students’ scores. This pattern—where the two ends of the distribution move in opposite directions—led to the United States’ relatively large changes in score gaps. Among the other countries with widening score gaps at grade 8, this pattern of divergence was not common in mathematics but was more common in science.

In contrast, in countries where the score gaps narrowed, low-performing students’ scores generally increased. In some cases, the scores of both low- and high-performing students increased, but the scores of low-performing students increased more.

Countries with narrowing score gaps typically also saw their average scores rise between 2011 and 2019, demonstrating improvements in both equity and achievement. This was almost never the case in countries where the scores of low-performing students dropped, highlighting the global importance of not letting this group of students fall behind.  


What else can we learn from this TIMSS Stats in Brief?

In addition to providing summary results (described above), this interactive Stats in Brief allows users to select a subject and grade to explore each of the study questions further (exhibit 1). Within each selection, users can choose either a more streamlined or a more expanded view of the cross-country figures and walk through the findings step-by-step while key parts of the figures are highlighted.


Exhibit 1. Preview of the Stats in Brief’s Features
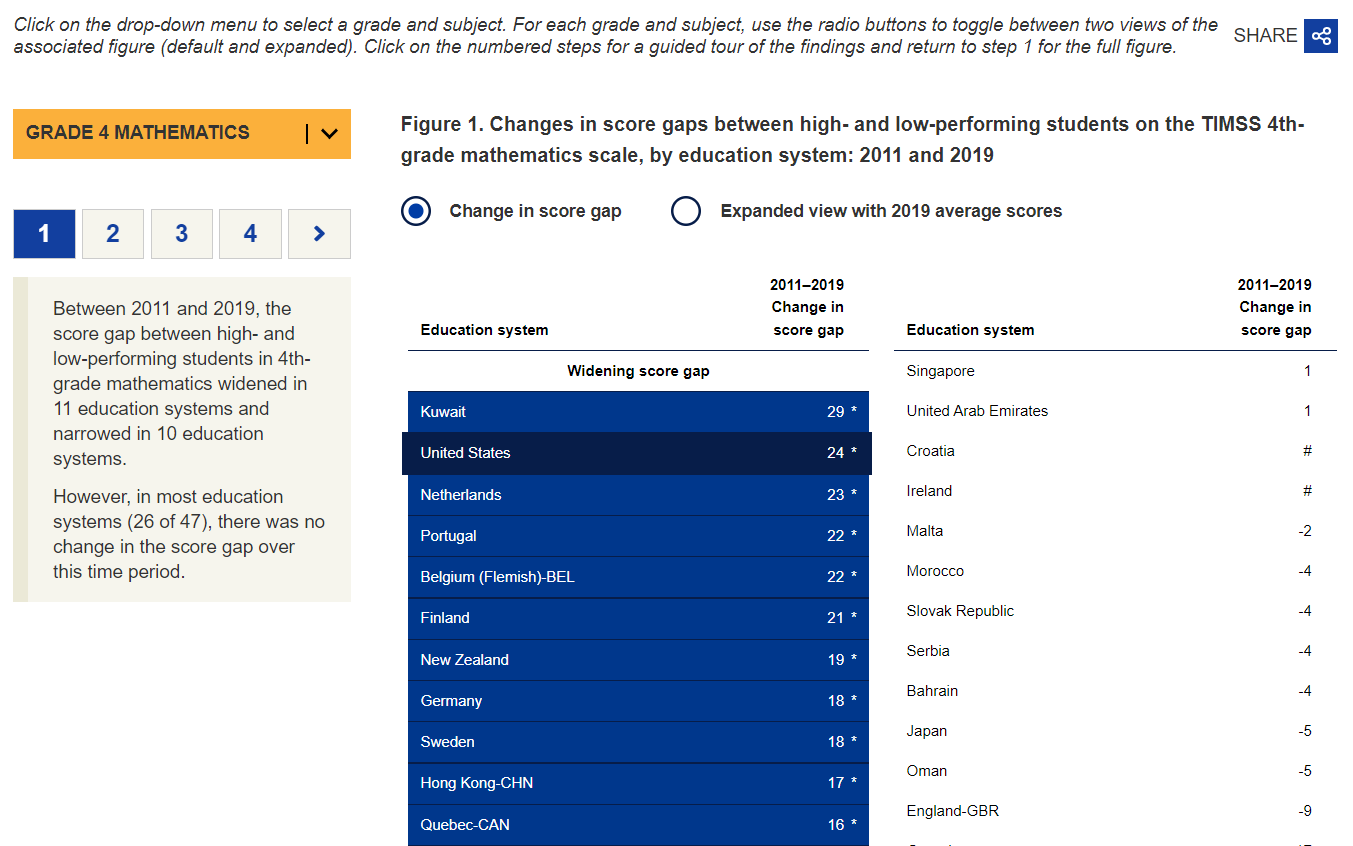
Image of the TIMSS Stats in Brief web report


Explore NCES’ new interactive TIMSS Stats in Brief to learn more about how score gaps between high- and low-performing students have changed over time across countries.

Be sure to follow NCES on TwitterFacebookLinkedIn, and YouTube and subscribe to the NCES News Flash to stay up-to-date on TIMSS data releases and resources.


By Maria Stephens and Ebru Erberber, AIR; and Lydia Malley, NCES

NCES Welcomes Peggy Carr as Its New Commissioner

On August 24, 2021, President Biden announced the appointment of Dr. Peggy G. Carr as Commissioner of the National Center for Education Statistics (NCES) in the Institute of Education Sciences (IES) at the U.S. Department of Education. Prior to serving as the Commissioner, Carr was the Associate Commissioner for Assessment at NCES, where she oversaw the National Assessment of Educational Progress (NAEP) and a portfolio of large-scale international assessments, including the Program for International Student Assessment (PISA) and Trends in International Mathematics and Science Study (TIMSS). Carr also served as Acting Commissioner of NCES between 2016 and 2018.

Since joining NCES in the early 1990s, Carr has played a lead role in planning, directing, and managing NAEP and the international assessments through several major milestones, such as the transition from paper-and-pencil assessments to digitally based ones. During her decades-long tenure with NAEP, Carr managed all aspects of its technical infrastructure, including item development, data collections, scoring, psychometrics, analysis, and reporting. Most recently, in January 2021, at the request of Secretary Cardona’s office and in response to an IES Executive Presidential Order to gather data on school openings and modes of instruction during the COVID-19 pandemic, Carr led the development and implementation of the NAEP 2021 Monthly School Survey. The survey reported crucial information on the reopening of schools for in-person learning from February through June of 2021, and it will provide valuable context for understanding student achievement results from the upcoming NAEP assessments in 2022.

Before coming to NCES, Carr served as the chief statistician for the Department of Education’s Office for Civil Rights. While in this role, she applied statistics and survey methods to the field of discrimination in U.S. schools and institutions.

Carr received her B.S. in psychology, with a concentration in statistics, from North Carolina Central University. She earned her M.S. and Ph.D. in developmental psychology from Howard University.

New International Data Show Large and Widening Gaps Between High- and Low-Performing U.S. 4th- and 8th-Graders in Mathematics and Science

NCES recently released results from the 2019 Trends in International Mathematics and Science Study (TIMSS). TIMSS tests students in grades 4 and 8 in mathematics and science every 4 years. The results show that

  • Across both subjects and grades, the United States scored, on average, in the top quarter of the education systems that took part in TIMSS 2019.
    • Among the 64 education systems that participated at grade 4, the United States ranked 15th and 8th in average mathematics and science scores, respectively.
    • Among the 46 education systems that participated at grade 8, the United States ranked 11th in average scores for both subjects.
  • On average, U.S. scores did not change significantly between the 2011 and 2019 rounds of TIMSS.

Average scores are one measure of achievement in national and international studies. However, they provide a very narrow perspective on student performance. One way to look more broadly is to examine differences in scores (or “score gaps”) between high-performing students and low-performing students. Score gaps between high performers and low performers can be one indication of equity within an education system. Here, high performers are those who scored in the 90th percentile (or top 10 percent) within their education system, and low performers are those who scored in the 10th percentile (or bottom 10 percent) within their education system.

In 2019, while some education systems had a higher average TIMSS score than the United States, none of these education systems had a wider score gap between their high and low performers than the United States. This was true across both subjects and grades.

Figure 1 shows an example of these findings using the grade 8 mathematics data. The figure shows that 17 education systems had average scores that were higher or not statistically different from the U.S. average score.

  • Of these 17 education systems, 13 had smaller score gaps between their high and low performers than the United States. The score gaps in 4 education systems (Singapore, Chinese Taipei, the Republic of Korea, and Israel) were not statistically different from the score gap in the United States.
  • The score gaps between the high and low performers in these 17 education systems ranged from 170 points in Quebec, Canada, to 259 points in Israel. The U.S. score gap was 256 points.
  • If you are interested in the range in the score gaps for all 46 education systems in the TIMSS 2019 grade 8 mathematics assessment, see Figure M2b of the TIMSS 2019 U.S. Highlights Web Report, released in December 2020. This report also includes these results for grade 8 science and both subjects at the grade 4 level.

Figure 1. Average scores and 90th to 10th percentile score gaps of grade 8 students on the TIMSS mathematics scale, by education system: 2019

NOTE: This figure presents only those education systems whose average scores were similar to or higher than the U.S. average score. Scores are reported on a scale of 0 to 1,000 with a TIMSS centerpoint of 500 and standard deviation of 100.

SOURCE: International Association for the Evaluation of Educational Achievement (IEA), Trends in International Mathematics and Science Study (TIMSS), 2019.


From 2011 to 2019, U.S. average scores did not change significantly. However, the scores of low performers decreased, and score gaps between low and high performers grew wider in both subjects and grades. In addition, at grade 8, there was an increase in the scores of high performers in mathematics and science over the same period. These two changes contributed to the widening gaps at grade 8.

Figure 2 shows these results for the U.S. grade 8 mathematics data. Average scores in 2011 and 2019 were not significantly different. However, the score of high performers increased from 607 to 642 points between 2011 and 2019, while the score of low performers decreased from 409 to 385 points. As a result, the score gap widened from 198 to 256 points between 2011 and 2019. In addition, the 2019 score gap for grade 8 mathematics is significantly wider than the gaps for all previous administrations of TIMSS.


Figure 2. Trends in average scores and selected percentile scores of U.S. grade 8 students on the TIMSS mathematics scale: Selected years, 1995 to 2019

* p < .05. Significantly different from the 2019 estimate at the .05 level of statistical significance.

NOTE: Scores are reported on a scale of 0 to 1,000 with a TIMSS centerpoint of 500 and standard deviation of 100.

SOURCE: International Association for the Evaluation of Educational Achievement (IEA), Trends in International Mathematics and Science Study (TIMSS), 1995, 1999, 2003, 2007, 2011, 2015, 2019.


These TIMSS findings provide insights regarding equity within the U.S. and other education systems. Similar results from the National Assessment of Educational Progress (NAEP) show that mathematics scores at both grades 4 and 8 decreased or did not change significantly between 2009 and 2019 for lower performing students, while scores increased for higher performing students. More national and international research on the gap between high- and low-performing students could help inform important education policy decisions that aim to address these growing performance gaps.

To learn more about TIMSS and the 2019 U.S. and international results, check out the TIMSS 2019 U.S. Highlights Web Report and the TIMSS 2019 International Results in Mathematics and Science. A recording is also available for a RISE Webinar from February 24, 2021 (What Do TIMSS and NAEP Tell Us About Gaps Between High- and Low-Performing 4th and 8th Graders?) that explores these topics further. 


By Katie Herz, AIR; Marissa Hall, AIR; and Lydia Malley, NCES

New International Data Identify “Resilient” Students in Financial Literacy

NCES recently released the results of the Program for International Student Assessment (PISA) 2018 assessment of financial literacy. This assessment measured 15-year-old students’ knowledge and understanding of financial concepts, products, and risks and their ability to apply that knowledge to real-life situations. It found that, on average, U.S. students performed similarly to their peers across the 12 other participating Organization for Economic Cooperation and Development (OECD) countries. 

The assessment also found that 12 percent of U.S. students performed at the highest level of proficiency (level 5). Performance at this level indicates that students can apply their understanding of financial terms and concepts to analyze complex financial products, solve nonroutine financial problems, and describe potential outcomes of financial decisions in the big picture.[1] The U.S. percentage was again similar to the OECD average.

However, this analysis also identified a group of students who might be considered “resilient.” In education research, resilience is defined as the ability to perform well academically despite coming from the disadvantaged backgrounds that have more commonly been associated with lower performance.

High-performing students came from across the spectrum of school poverty levels, as measured by the percentage of students eligible for free or reduced-price lunch (FRPL).[2] In particular, 7 percent of high-performing students in financial literacy came from the highest poverty schools (figure 1).


Figure 1. Percentage distribution of U.S. 15-year-olds in public schools scoring below level 2 and at level 5 of proficiency on the PISA financial literacy scale, by percentage of students eligible for free or reduced-price lunch (FRPL) at their school: 2018

NOTE: Data for percentage of students eligible for FRPL were available for public schools only. An individual student’s level of poverty may vary within schools. Detail may not sum to totals due to rounding.

SOURCE: Organization for Economic Cooperation and Development (OECD), Program for International Student Assessment (PISA), 2018.


It is these 7 percent of students who could be considered “resilient” and may be of interest for further study. For example, research could identify if there are factors that are associated with their high performance when compared to their lower performing peers in similar schools. Research on academically resilient students that used eighth-grade data from TIMSS found, for example, that having high educational aspirations increased the likelihood that students with few home education resources performed at or above the TIMSS Intermediate international benchmark in mathematics.[3] Experiencing less bullying also increased this likelihood.

Examining the “resilient” PISA financial literacy students more closely could also determine the extent to which their individual backgrounds are related to performance. This would be of interest because, even within high-poverty schools, students’ individual circumstances may vary. 

Patterns in Other PISA Subjects

There are similar subsets of “resilient” students in the other PISA 2018 subjects (table 1). Eight percent of high performers in reading were from the highest poverty schools, as were 5 percent of high performers in mathematics and 7 percent of high performers in science.


Table 1. Percentage of U.S. 15-year-olds in public schools scoring at or above level 5 of proficiency, by PISA subject and their schools’ free or reduced-price lunch (FRPL) status: 2018

[Standard errors appear in parentheses]

NOTE: Results are scaled separately; thus, percentages cannot be compared across subjects. Level 5 is the highest level of proficiency in financial literacy; levels 5 and 6 are the highest levels of proficiency in the other PISA subjects. Data for students eligible for FRPL were available for public schools only.

SOURCE: Organization for Economic Cooperation and Development (OECD), Program for International Student Assessment (PISA), 2018.


For more information on the PISA 2018 results in financial literacy and other subjects, visit the NCES International Activities website. To create customized data and charts using PISA and other international assessment data, use the International Data Explorer.


By Maria Stephens, AIR


[2] Data for students eligible for FRPL are available for public schools only.

[3] Students at the Intermediate international benchmark can apply basic mathematical knowledge in a variety of situations, and those above this benchmark can do so in increasingly complex situations and, at the highest end, reason with information, draw conclusions, make generalizations, and solve linear equations.

Building Bridges: Increasing the Power of the Civil Rights Data Collection (CRDC) Through Data Linking With an ID Crosswalk

On October 15, 2020, the U.S. Department of Education’s (ED) Office for Civil Rights (OCR) released the 2017–18 Civil Rights Data Collection (CRDC). The CRDC is a biennial survey that has been conducted by ED to collect data on key education and civil rights issues in our nation’s public schools since 1968. The CRDC provides data on student enrollment and educational programs and services, most of which are disaggregated by students’ race/ethnicity, sex, limited English proficiency designation, and disability status. The CRDC is an important aspect of the overall strategy of ED’s Office for Civil Rights (OCR) to administer and enforce civil rights statutes that apply to U.S. public schools. The information collected through the CRDC is also used by other ED offices as well as by policymakers and researchers outside of ED.  

As a standalone data collection, the CRDC provides a wealth of information. However, the analytic power and scope of the CRDC can be enhanced by linking it to other ED and government data collections, including the following:

A Crosswalk to Link CRDC Data to Other Data Collections

To facilitate joining CRDC data to these and other data collections, NCES developed an ID crosswalk. This crosswalk is necessary because there are instances when the CRDC school ID number (referred to as a combo key) does not match the NCES school ID number assigned in other data collections (see the “Mismatches Between ID Numbers” section below for reasons why this may occur). By linking the CRDC to other data collections, researchers can answer questions that CRDC data alone cannot, such as the following:


Mismatches Between ID Numbers

Mismatches between CRDC combo key numbers and NCES ID numbers may occur because of differences in how schools and districts are reported in the CRDC and other collections and because of differences in the timing of collections. Below are some examples.

  • Differences in how schools and school districts are reported in the CRDC and other data collections:
    • New York City Public Schools is reported as a single district in the CRDC but as multiple districts (with one supervisory union and 33 components of the supervisory union) in other data collections. Thus, the district will have one combo key in the CRDC but multiple ID numbers in other data collections.
    • Sometimes charter schools are reported differently in the CRDC compared with other data collections. For example, some charter schools in California are reported as independent (with each school serving as its own school district) in the CRDC but as a single combined school district in other data collections. Thus, each school will have its own combo key in the CRDC, but there will be one ID number for the combined district in other data collections.
    • There are differences between how a state or school district defines a school compared with how other data collections define a school.
  • Differences in the timing of the CRDC and other data collections:
    • There is a lag between when the CRDC survey universe is planned and when the data collection begins. During this time, a new school may open. Since the school has not yet been assigned an ID number, it is reported in the CRDC as a new school.


Interested in using the ID crosswalk to link CRDC data with other data collections and explore a research question of your own? Visit https://www.air.org/project/research-evaluation-support-civil-rights-data-collection-crdc to learn more and access the crosswalk. For more information about the CRDC, visit https://ocrdata.ed.gov/.


By Jennifer Sable, AIR, and Stephanie R. Miller, NCES