NCES Blog

National Center for Education Statistics

Education at a Glance 2023: Putting U.S. Data in a Global Context

International comparisons provide reference points for researchers and policy analysts to understand trends and patterns in national education data and are very important as U.S. students compete in an increasingly global economy.

Education at a Glance (EAG), an annual publication produced by the Organization for Economic Cooperation and Development (OECD), provides data on the structure, finances, and progress of education systems in 38 OECD countries—including the United States—as well as a number of OECD accession and partner countries. Data presented in EAG on topics of high policy interest in the United States are also featured in NCES reports, including the Condition of Education and Digest of Education Statistics.  

The recently released 2023 edition of EAG shows that the United States is above the international average on some measures, such as funding of postsecondary education, but lags behind in others, such as participation in early childhood education and care (ECEC). The 2023 report also features a Spotlight on Vocational Education and Training as well as interactive data dashboards on ECEC systems, upper secondary education systems, and educational support for Ukrainian refugees.


Spotlight on Vocational Education and Training (VET)

Each EAG edition centers on a particular theme of high policy relevance in OECD countries. The focus of this year’s report is VET programs, which look very different in the United States compared with many other OECD countries. Unlike in many OECD countries, most high schools in the United States do not offer a separate, distinct vocational track at the upper secondary (high school) level. Instead, vocational education is available as optional career and technical education (CTE) courses throughout high school. Regardless of whether they choose to take CTE courses, all U.S. students who complete high school have the same potential to access postsecondary programs. In other OECD countries, selecting a vocational track at this level may lead to different postsecondary opportunities. Check out the 2023 EAG Spotlight for an overview of VET programs across OECD countries.


Highlights From EAG 2023

Below is a selection of topics from the EAG report highlighting how key education benchmarks in the United States compare with other OECD countries.


Postsecondary Educational Attainment

The percentage of U.S. 25- to 34-year-olds with a postsecondary degree increased by 13 percentage points between 2000 and 2022, reaching 51 percent (the OECD average in 2022 was 47 percent) (Table A1.3).1 In this age group in the United States, higher percentages of women than men attained a postsecondary degree (56 vs. 46 percent) (Table A1.2). Across OECD countries, the average postsecondary educational attainment gap between 25- to 34-year-old men and women in 2022 (13 percentage points) was wider than the gap in the United States (10 percentage points). In the United States, the postsecondary attainment rate for 25- to 34-year-old men was 5 percentage points higher than the OECD average, and the attainment rate for women was 3 percentage points higher than the OECD average.


Figure 1. Percentage of 25- to 34-year-olds with a postsecondary degree, by OECD country: 2022

[click to enlarge image]
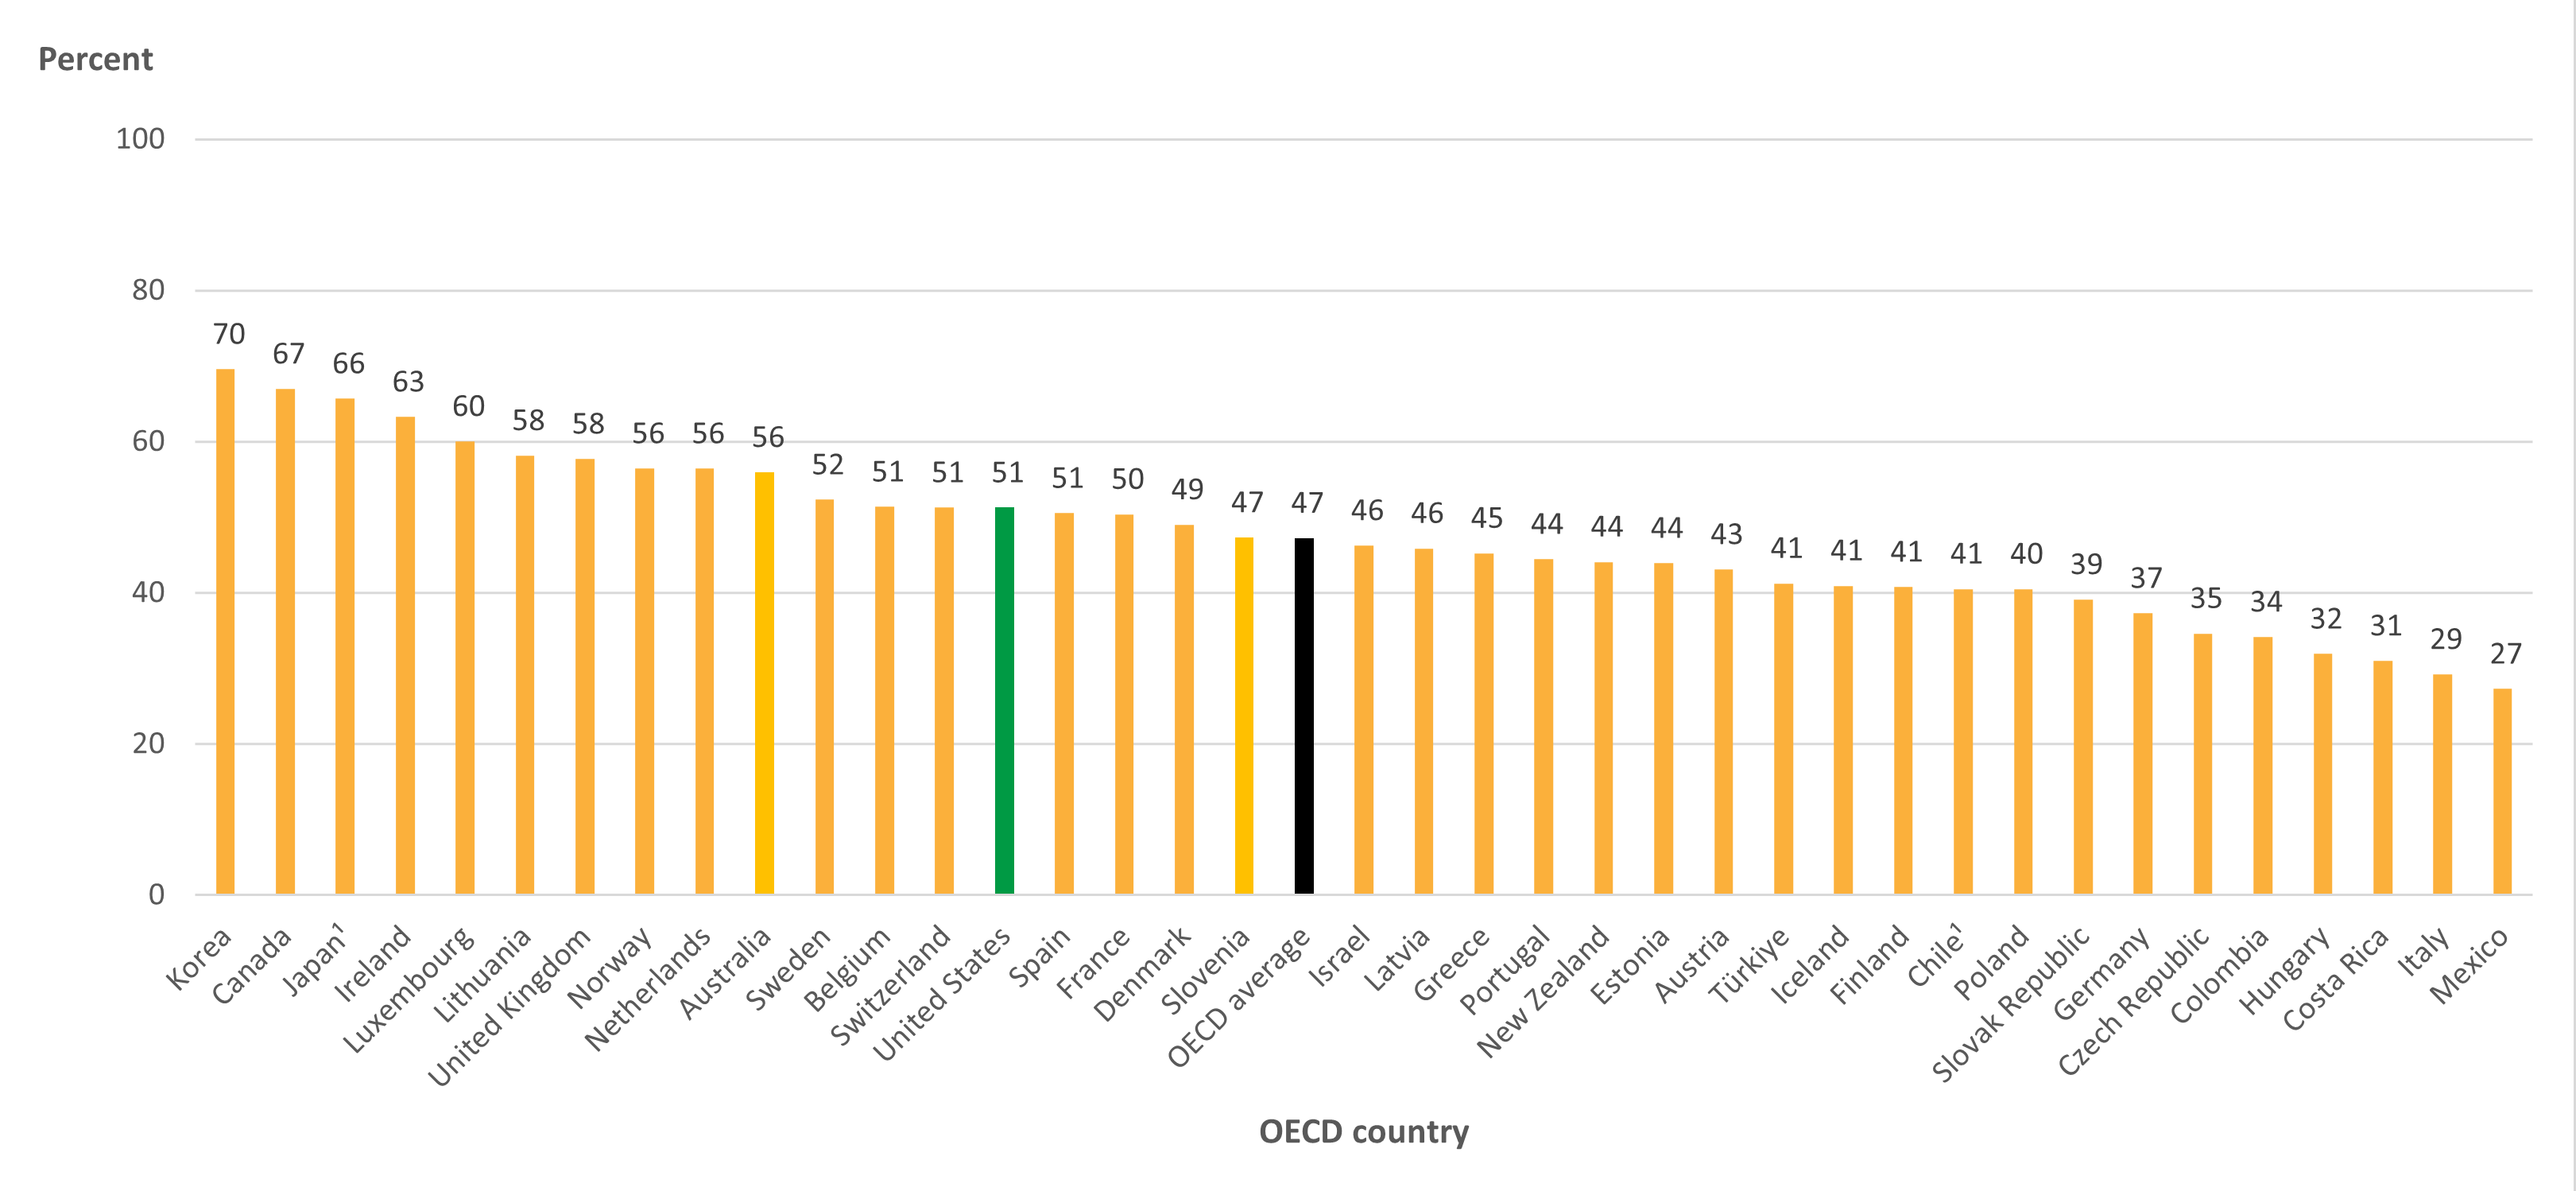
Data include a small percentage of adults with lower levels of attainment.
Year of reference differs from 2022. Refer to the source table for more details.
SOURCE: OECD (2023), Table A1.3. See Source section for more information and Annex 3 for notes.


International Student Enrollment

The United States is the top OECD destination country for international students enrolling in postsecondary education. In 2021, some 833,204 foreign students were enrolled in postsecondary programs in the United States, representing 13 percent of the international education market share (Table B6.1).2 In comparison, the United Kingdom had the second highest number of international students enrolled in postsecondary education in 2021, representing 9 percent of the international education market share. Interestingly, when examining enrollment trends over the past 3 years (2019 to 2021), foreign student enrollment decreased by 143,649 students (15 percent) in the United States but increased by 111,570 students (23 percent) in the United Kingdom. International student enrollment during these years was likely affected by the coronavirus pandemic, which had large impacts on global travel in 2020 and 2021.


Education Spending

U.S. spending on education is relatively high across all levels of education compared with the OECD average. The largest difference is in postsecondary spending, where the United States spent $36,172 per full-time postsecondary student in 2020, the second highest amount after Luxembourg ($53,421) and nearly double the OECD average ($18,105) (Table C1.1).3 This spending on postsecondary education amounts to 2.5 percent of the U.S. GDP, higher than the OECD average (1.5 percent) (Table C2.1). These total expenditures include amounts received from governments, students, and all other sources.


Figure 2. Expenditures per full-time equivalent student, by education level and OECD country: 2020

[click to enlarge image]
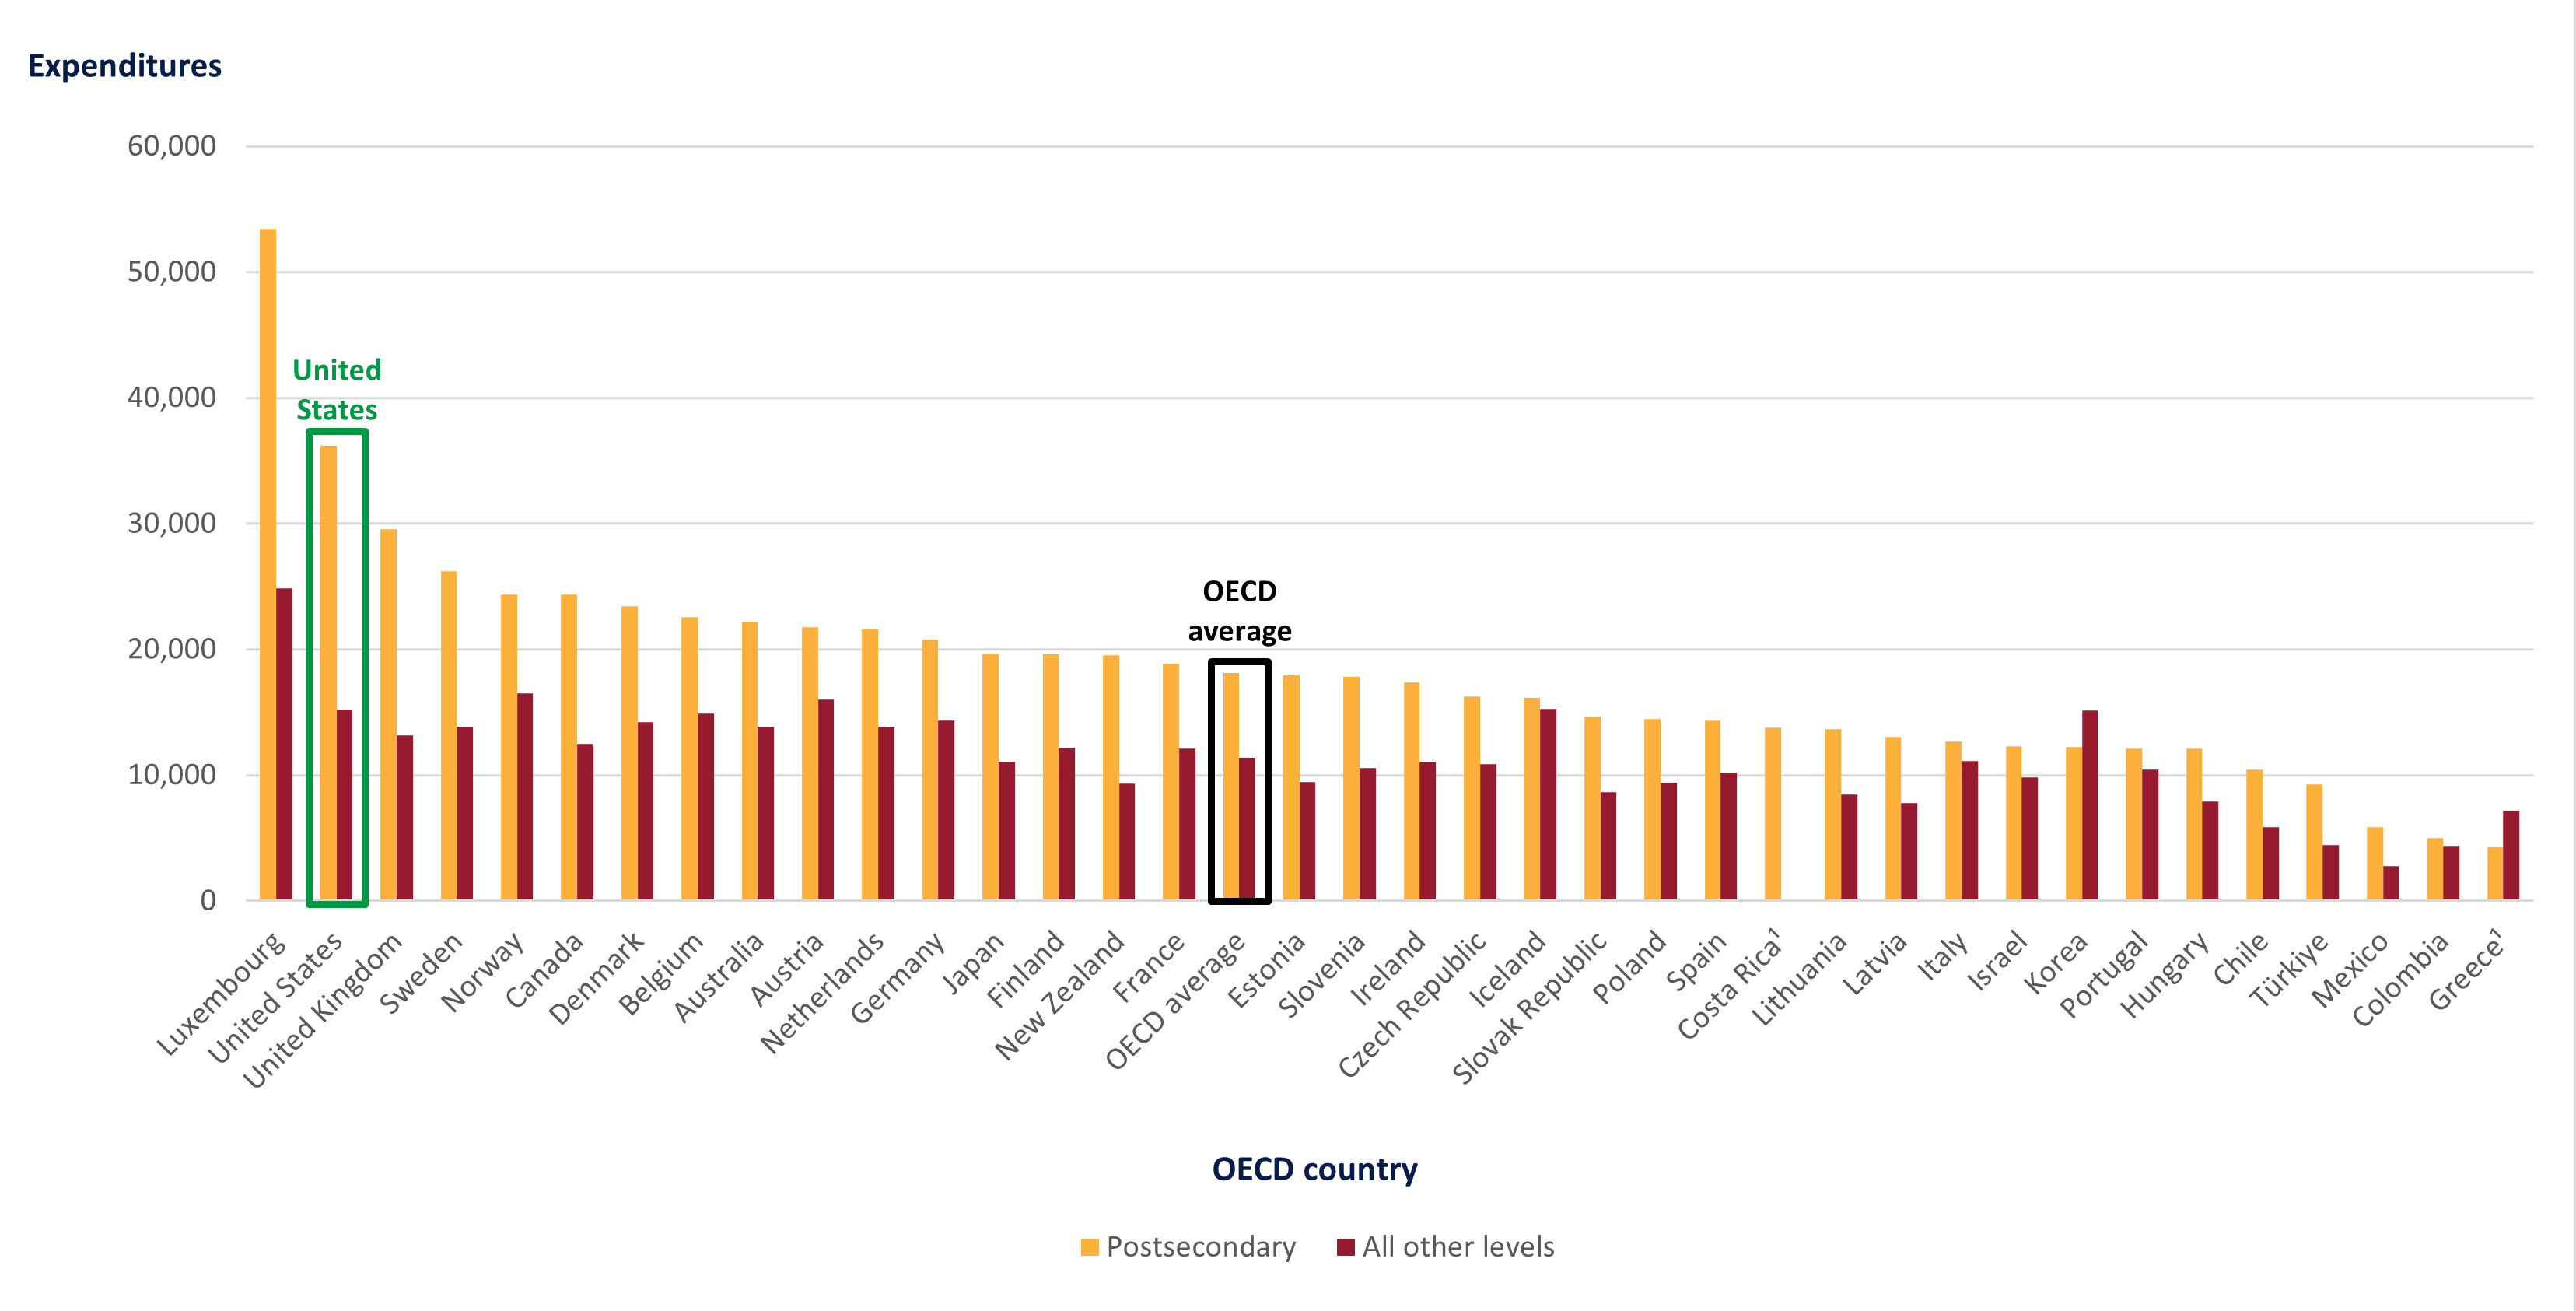
1 Year of reference differs from 2020. Refer to the source table for more details.
SOURCE: OECD (2023), Table C1.1. See Source section for more information and Annex 3 for notes.


High School Completion Rate

The United States has a higher upper secondary (high school) completion rate than most other OECD countries. In 2021, some 87 percent of U.S. students completed their high school program in the expected timeframe, compared with the OECD average of 72 percent (Table B3.1).


Early Childhood Education

The level of participation in early childhood education programs in the United States is below the OECD average. In 2021, average enrollment rates across OECD countries were 72 percent for 3-year-olds, 87 percent for 4-year-olds, and 84 percent for 5-year-olds (Table B2.1). In contrast, enrollment rates for students of these ages in the United States were 30 percent for 3-year-olds, 50 percent for 4-years-olds, and 81 percent for 5-year-olds.  


Browse the full EAG 2023 report to see how the United States compares with other countries on these and other important education-related topics.


By RaeAnne Friesenhahn, AIR, and Cris De Brey, NCES


[1] EAG data for the year 2000 can be accessed via the online OECD Stat database.

[2] Unrounded data in Excel format can be accessed via the StatLink located below each table.

[3] Expenditure in national currencies was converted into equivalent USD by dividing the national currency figure by the purchasing power parity (PPP) index for GDP. For more details on methodology see Annex 2 and Annex 3.

Money Matters: Exploring Young Adults’ Financial Literacy and Financial Discussions With Their Parents

Financial literacy is a critical skill for young adults—especially as they begin to enter college or the workforce—that is often needed for partial or full financial independence and increased financial decision making.

The Program for International Student Assessment (PISA)—which is coordinated by the Organization for Economic Cooperation and Development (OECD)—gives us a unique opportunity to analyze and understand the financial literacy of 15-year-olds in the United States and other education systems around the world. PISA is the only large-scale nationally representative assessment that measures the financial literacy skills of 15-year-olds. The financial literacy domain was administered first in 2012 and then in 2015 and 2018. The 2018 financial literacy cycle assessed approximately 117,000 students, representing about 13.5 million 15-year-olds from 20 education systems. The fourth cycle began in fall 2022 in the United States and is currently being conducted.


How Frequently Do Students Discuss Financial Topics With Their Parents?

In 2018, all education systems that administered the PISA financial literacy assessment also asked students to complete a questionnaire about their experiences with money matters in school and outside of school. In the United States, about 3,500 students out of the total 3,740 U.S. PISA sample completed the questionnaire.

This blog post explores how frequently students reported talking about the following five topics with their parents (or guardians or relatives):

  1. their spending decisions
  2. their savings decisions
  3. the family budget
  4. money for things they want to buy
  5. news related to economics or finance

Students’ answers were grouped into two categories: frequent (“a few times a month” or “once a week or more”) and infrequent (“never or almost never” or “a few times a year”).

We first looked at the degree to which students frequently discussed various financial topics with their parents. In 2018, the frequency of student-parent financial discussions varied by financial topic (figure 1):

  • About one-quarter (24 percent) of U.S. 15-year-old students reported frequently discussing with their parents news related to economics or finance.
  • More than half (53 percent) of U.S. 15-year-old students reported frequently discussing with their parents money for things they wanted to buy.

Bar chart showing percentage of 15-year-old students who frequently discuss financial topics with their parents, by topic (spending decisions, savings decisions, family budget, money for things you want to buy, and news related to economics or finance), in 2018


Do male and female students differ in how frequently they discuss financial topics with their parents?

In 2018, higher percentages of female students than of male students frequently discussed with their parents the family budget (35 vs. 32 percent) and money for things they wanted to buy (56 vs. 50 percent). Meanwhile, a lower percentage of female students than of male students frequently discussed with their parents news related to economics or finance (21 vs. 26 percent) (figure 2).


Bar chart showing percentage of 15-year-old students who frequently discuss financial topics with their parents, by topic (spending decisions, savings decisions, family budget, money for things you want to buy, and news related to economics or finance) and gender, in 2018


Are Students’ Financial Literacy Scores Related to How Frequently They Discuss Financial Matters With Their Parents?

With a scale from 0–1,000, the PISA financial literacy assessment measures students’ financial knowledge in four content areas:

  1. money and transactions
  2. planning and managing finances
  3. risk and reward
  4. the financial landscape

In 2018, the average score of 15-year-old students ranged from 388 points in Indonesia to 547 points in Estonia. The U.S. average (506 points) was higher than the average in 11 education systems, lower than the average in 4 education systems, and not measurably different from the average in 4 education systems. The U.S. average was also not measurably different from the OECD average.

We also examined the relationship between frequent parent–student financial discussions and students’ financial literacy achievement (figure 3). After taking into account students’ gender, race/ethnicity, immigration status, and socioeconomic status—as well as their school’s poverty and location—the results show that students who reported frequently discussing spending decisions with their parents scored 16 points higher on average than did students who reported infrequently discussing this topic. On the other hand, students who reported frequently discussing news related to economics or finance with their parents scored 18 points lower on average than did students who reported infrequently discussing this topic.  


Two-sided horizontal bar chart showing financial literacy score-point differences between students who frequently and infrequently discuss financial topics with their parents, after accounting for student and school characteristics, in 2018


Do Students Think That Young Adults Should Make Their Own Spending Decisions?

We also explored whether students agreed that young people should make their own spending decisions. In 2018, some 63 percent of U.S. 15-year-old students reported they agreed or strongly agreed, while 37 percent reported that they disagreed.

Do male and female students differ in their agreement that young adults should make their own spending decisions?

When comparing the percentage of male versus female students, we found that a lower percentage of female students than of male students agreed or strongly agreed that young people should make their own spending decisions (59 vs. 66 percent). This pattern held even after taking into account students’ gender, race/ethnicity, immigration status, and socioeconomic status as well as school poverty and location.  


Upcoming PISA Data Collections

A deeper understanding of the frequency of parent–student financial conversations, the types of topics discussed, and the relationships between financial topics and financial literacy could help parents and educators foster financial literacy across different student groups in the United States.

PISA began collecting data in 2022 after being postponed 1 year due to the COVID-19 pandemic; 83 education systems are expected to participate. The PISA 2022 Financial Literacy Assessment will include items from earlier years as well as new interactive items. The main PISA results will be released in December 2023, and the PISA financial literacy results will be released in spring/summer 2024.

Be sure to follow NCES on TwitterFacebookLinkedIn, and YouTube and subscribe to the NCES News Flash to receive notifications when these new PISA data are released.


By Saki Ikoma, Marissa Hall, and Frank Fonseca, AIR

International Computer and Information Literacy Study: 2023 Data Collection

In April, the National Center for Education Statistics (NCES) will kick off the 2023 International Computer and Information Literacy Study (ICILS) of eighth-grade students in the United States. This will be the second time the United States is participating in the ICILS.

What is ICILS?

ICILS is a computer-based international assessment of eighth-grade students’ capacity to use information and communications technologies (ICT)1 productively for a range of different purposes. It is sponsored by the International Association for the Evaluation of Educational Achievement (IEA) and conducted in the United States by NCES.

In addition to assessing students on two components—computer and information literacy (CIL) and computational thinking (CT)—ICILS also collects information from students, teachers, school principals, and ICT coordinators on contextual factors that may be related to students’ development in CIL.

Why is ICILS important?

ICILS measures students’ skills with ICT and provides data on CIL. In the United States, the development of these skills is called for in the Federal STEM Education Strategic Plan. Outside of the United States, ICILS is also recognized as an official EU target by the European Council and EU member states to support strategic priorities toward the European Education Area and Beyond (2021–2030). From a global perspective, ICILS provides information for monitoring progress toward the UNESCO Sustainable Development Goals (SDGs).

The measurement of students’ CIL is highly relevant today—digital tools and online learning became the primary means of delivering and receiving education during the onset of the coronavirus pandemic, and technology continually shapes the way students learn both inside and outside of school.

ICILS provides valuable comparative data on students’ skills and experience across all participating education systems. In 2018, ICILS results showed that U.S. eighth-grade students’ average CIL score (519) was higher than the ICILS 2018 average score (496) (figure 1).


Horizontal bar chart showing average CIL scores of eighth-grade students, by education system, in 2018

* p < .05. Significantly different from the U.S. estimate at the .05 level of statistical significance.
NOTE: CIL = computer and information literacy. The ICILS CIL scale ranges from 100 to 700. The ICILS 2018 average is the average of all participating education systems meeting international technical standards, with each education system weighted equally. Education systems are ordered by their average CIL scores, from largest to smallest. Italics indicate the benchmarking participants.
SOURCE: International Association for the Evaluation of Educational Achievement (IEA), International Computer and Information Literacy Study (ICILS), 2018.


ICILS data can also be used to examine various topics within one education system and shed light on the variations in the use of digital resources in teaching and learning among student and teacher subgroups. For example, in 2018, lower percentages of mathematics teachers than of English language arts (ELA) and science teachers often or always used ICT to support student-led discussions, inquiry learning, and collaboration among students (figure 2).


Stacked horizontal bar chart showing percentage of U.S. eighth-grade teachers who often or always use ICT, by selected teaching practice and subject (English language arts, math, and science), in 2018

NOTE: ICT = information and communications technologies. Teaching practices are ordered by the percentage of English language arts teachers using ICT, from largest to smallest. Science includes general science and/or physics, chemistry, biology, geology, earth sciences, and technical science.
SOURCE: International Association for the Evaluation of Educational Achievement (IEA), International Computer and Information Literacy Study (ICILS), 2018.


What does the ICILS 2023 data collection include?

In November 2022, NCES started the preparation work for the ICILS 2023 main study data collection, which is scheduled for administration from April to June 2023. Eighth-grade students and staff from a nationally representative sample of about 150 schools will participate in the study.

Students will be assessed on CIL (which focuses on understanding computer use, gathering information, producing information, and communicating digitally) and CT (which focuses on conceptualizing problems and operationalizing solutions). In addition to taking the assessment, students will complete a questionnaire about their access to and use of ICT.

Teachers will be surveyed about their use of ICT in teaching practices, ICT skills they emphasize in their teaching, their attitudes toward using ICT, and their ICT-related professional development. In addition, principals and ICT coordinators will be surveyed about ICT resources and support at school, priorities in using ICT, and management of ICT resources.

In 2023, more than 30 education systems will participate in the study and join the international comparisons. When ICILS 2023 results are released in the international and U.S. reports in November 2024, we will be able to learn more about the changes in students’ and teachers’ technology use over the past 5 years by comparing the 2023 and 2018 ICILS results. Such trend comparisons will be meaningful given the increased availability of the Internet and digital tools during the pandemic.


Explore the ICILS website to learn more about the study, and be sure to follow NCES on TwitterFacebookLinkedIn, and YouTube and subscribe to the NCES News Flash to stay up-to-date on future ICILS reports and resources.


By Yan Wang and Yuqi Liao, AIR


[1] Refers to technological tools and resources used to store, create, share, or exchange information, including computers, software applications, and the Internet.

U.S. Is Unique in Score Gap Widening in Mathematics and Science at Both Grades 4 and 8: Prepandemic Evidence from TIMSS

Tracking differences between the performance of high- and low-performing students is one way of monitoring equity in education. These differences are referred to as achievement gaps or “score gaps,” and they may widen or narrow over time.

To provide the most up-to-date international data on this topic, NCES recently released Changes Between 2011 and 2019 in Achievement Gaps Between High- and Low-Performing Students in Mathematics and Science: International Results From TIMSS. This interactive web-based Stats in Brief uses data from the Trends in International Mathematics and Science Study (TIMSS) to explore changes between 2011 and 2019 in the score gaps between students at the 90th percentile (high performing) and the 10th percentile (low performing). The study—which examines data from 47 countries at grade 4, 36 countries at grade 8, and 29 countries at both grades—provides an important picture of prepandemic trends.

This Stats in Brief also provides new analyses of the patterns in score gap changes over the last decade. The focus on patterns sheds light on which part of the achievement distribution may be driving change, which is important for developing appropriate policy responses. 


Did score gaps change in the United States and other countries between 2011 and 2019?

In the United States, score gap changes consistently widened between 2011 and 2019 (figure 1). In fact, the United States was the only country (of 29) where the score gap between high- and low-performing students widened in both mathematics and science at both grade 4 and grade 8.


Figure 1. Changes in scores gaps between high- and low-performing U.S. students between 2011 and 2019

Horizontal bar chart showing changes in scores gaps between high- and low-performing U.S. students between 2011 and 2019

* p < .05. Change in score gap is significant at the .05 level of statistical significance.

SOURCE: Stephens, M., Erberber, E., Tsokodayi, Y., and Fonseca, F. (2022). Changes Between 2011 and 2019 in Achievement Gaps Between High- and Low-Performing Students in Mathematics and Science: International Results From TIMSS (NCES 2022-041). U.S. Department of Education. Washington, DC: National Center for Education Statistics, Institute of Education Sciences. Available at https://nces.ed.gov/pubsearch/pubsinfo.asp?pubid=2022041.


For any given grade and subject combination, no more than a quarter of participating countries had a score gap that widened, and no more than a third had a score gap that narrowed—further highlighting the uniqueness of the U.S. results.


Did score gaps change because of high-performing students, low-performing students, or both?

At grade 4, score gaps widened in the United States between 2011 and 2019 due to decreases in low-performing students’ scores, while high-performing students’ scores did not measurably change (figure 2). This was true for both mathematics and science and for most of the countries where score gaps also widened.


Figure 2. Changes in scores of high- and low-performing U.S. students between 2011 and 2019

Horizontal bar chart showing changes in scores of high- and low-performing U.S. students between 2011 and 2019 and changes in the corresponding score gaps

p < .05. 2019 score gap is significantly different from 2011 score gap.

SOURCE: Stephens, M., Erberber, E., Tsokodayi, Y., and Fonseca, F. (2022). Changes Between 2011 and 2019 in Achievement Gaps Between High- and Low-Performing Students in Mathematics and Science: International Results From TIMSS (NCES 2022-041). U.S. Department of Education. Washington, DC: National Center for Education Statistics, Institute of Education Sciences. Available at https://nces.ed.gov/pubsearch/pubsinfo.asp?pubid=2022041.


Low-performing U.S. students’ scores also dropped in both subjects at grade 8, but at this grade, they were accompanied by rises in high-performing students’ scores. This pattern—where the two ends of the distribution move in opposite directions—led to the United States’ relatively large changes in score gaps. Among the other countries with widening score gaps at grade 8, this pattern of divergence was not common in mathematics but was more common in science.

In contrast, in countries where the score gaps narrowed, low-performing students’ scores generally increased. In some cases, the scores of both low- and high-performing students increased, but the scores of low-performing students increased more.

Countries with narrowing score gaps typically also saw their average scores rise between 2011 and 2019, demonstrating improvements in both equity and achievement. This was almost never the case in countries where the scores of low-performing students dropped, highlighting the global importance of not letting this group of students fall behind.  


What else can we learn from this TIMSS Stats in Brief?

In addition to providing summary results (described above), this interactive Stats in Brief allows users to select a subject and grade to explore each of the study questions further (exhibit 1). Within each selection, users can choose either a more streamlined or a more expanded view of the cross-country figures and walk through the findings step-by-step while key parts of the figures are highlighted.


Exhibit 1. Preview of the Stats in Brief’s Features

Image of the TIMSS Stats in Brief web report


Explore NCES’ new interactive TIMSS Stats in Brief to learn more about how score gaps between high- and low-performing students have changed over time across countries.

Be sure to follow NCES on TwitterFacebookLinkedIn, and YouTube and subscribe to the NCES News Flash to stay up-to-date on TIMSS data releases and resources.


By Maria Stephens and Ebru Erberber, AIR; and Lydia Malley, NCES

Program for the International Assessment of Adult Competencies (PIAAC) 2022–23 Data Collection Begins

Last month, the National Center for Education Statistics (NCES) kicked off a major survey of adults (ages 16–74) across the nation to learn about their literacy skills, education, and work experience. Information collected through this survey—officially known as Cycle 2 of the Program for the International Assessment of Adult Competencies (PIAAC) in the United States—is used by local, state, and national organizations, government entities, and researchers to learn about adult skills at the state and local levels (explore these data in the PIAAC Skills Map, shown below).


Image of PIAAC Skills Map on state and county indicators of adult literacy and numeracy


Specifically, these data are used to support educational and training initiatives organized by local and state programs. For example, the Houston Mayor’s Office for Adult Literacy has used the PIAAC Skills Map data in developing the Adult Literacy Blueprint, a comprehensive plan for coordinated citywide change to address the systemic crisis of low literacy and numeracy in the city. In addition, the Kentucky Career and Technical College System developed a comprehensive data-driven app for workforce pipeline planning using the county-level PIAAC Skills Map data as one of the education pipeline indicators.

This is not the first time NCES is administering PIAAC. NCES collected PIAAC data three times between 2011 and 2017, when the first cycle of this international study was administered in 39 countries. Developed by the Organization for Economic Cooperation and Development (OECD), PIAAC measures fundamental cognitive and workplace skills needed for individuals to participate in society and for economies to prosper. Among these fundamental skills are literacy, numeracy, and digital problem-solving. Data from the first cycle of PIAAC (2011–17) provided insights into the relationships between adult skills and various economic, social, and health outcomes—both across the United States as a whole and for specific populations of interest (e.g., adults who are women, immigrants, older, employed, parents, or incarcerated). The OECD and NCES have published extensively using these data.

The current cycle (Cycle 2) of PIAAC will resemble the first cycle in that interviewers will visit people’s homes to ask if they are willing to answer background questionnaire and take a self-administered test of their skills. However, unlike the first cycle when respondents could respond to the survey on paper or on a laptop, this cycle will be conducted entirely on a tablet. PIAAC is completely voluntary, but each respondent is specifically selected to provide invaluable information that will help us learn about the state of adult skills in the country (participants can also receive an incentive payment for completing the survey).

PIAAC’s background questionnaire includes questions about an individual’s demographics, family, education, employment, skill use, and (new in Cycle 2 and unique to the United States) financial literacy. The PIAAC test or “direct assessment” measures literacy, numeracy, and (new in Cycle 2) adaptive problem-solving skills of adults.1

Each sampled person’s response is not only kept confidential but also “anonymized” before the data are released (so that no one can ever definitively identify an individual from personal characteristics in the datafile).

The international report and data for PIAAC Cycle 2 is scheduled to be released by the OECD in December 2024.

Be sure to follow NCES on TwitterFacebookLinkedIn, and YouTube and subscribe to the NCES News Flash to stay up-to-date on PIAAC report and data releases and resources.


By Saida Mamedova, AIR, Stephen Provasnik, NCES, and Holly Xie, NCES


[1] Data is collected from adults ages 16–74 in the United States and ages 16–65 in the other countries.