NCES Blog

National Center for Education Statistics

Students’ Internet Access Before and During the Coronavirus Pandemic by Household Socioeconomic Status

The pandemic has focused attention on the resources needed for students to engage equitably in educational opportunities, particularly during remote learning. While access to computers and the internet were important to education prior to the pandemic—as tools for word processing, research, and communication after school hours, or even as the primary means of schooling—they became essential tools for students to remain engaged during the 2020–21 academic year. Reflecting this importance both before and during the pandemic, recent NCES blogs have highlighted data on virtual schools and geographic differences in digital access. This blog presents additional insight on these topics from the Condition of Education 2021. Specifically, it highlights patterns of inequity in access to educational technology by socioeconomic status, both before and during the coronavirus pandemic.

Before the Coronavirus Pandemic

According to the American Community Survey (ACS),1 the higher the level of parental educational attainment, the higher the percentage of 3- to 18-year-olds with home internet access in 2019. For instance, the percentage with home internet access was highest for those whose parents had attained a bachelor’s or higher degree (99 percent) and lowest for those whose parents had less than a high school credential (83 percent) (figure 1).

Similarly, the higher the level of family income, the higher the percentage of 3- to 18-year-olds with home internet access in 2019. Specifically, the percentage with home internet access was highest for those in families in the highest income quarter (99 percent) and lowest for those in families in the lowest income quarter (89 percent) (figure 1).2


Figure 1. Percentage of 3- to 18-year-olds with home internet access and home internet access only through a smartphone, by parental education and family income quarter: 2019

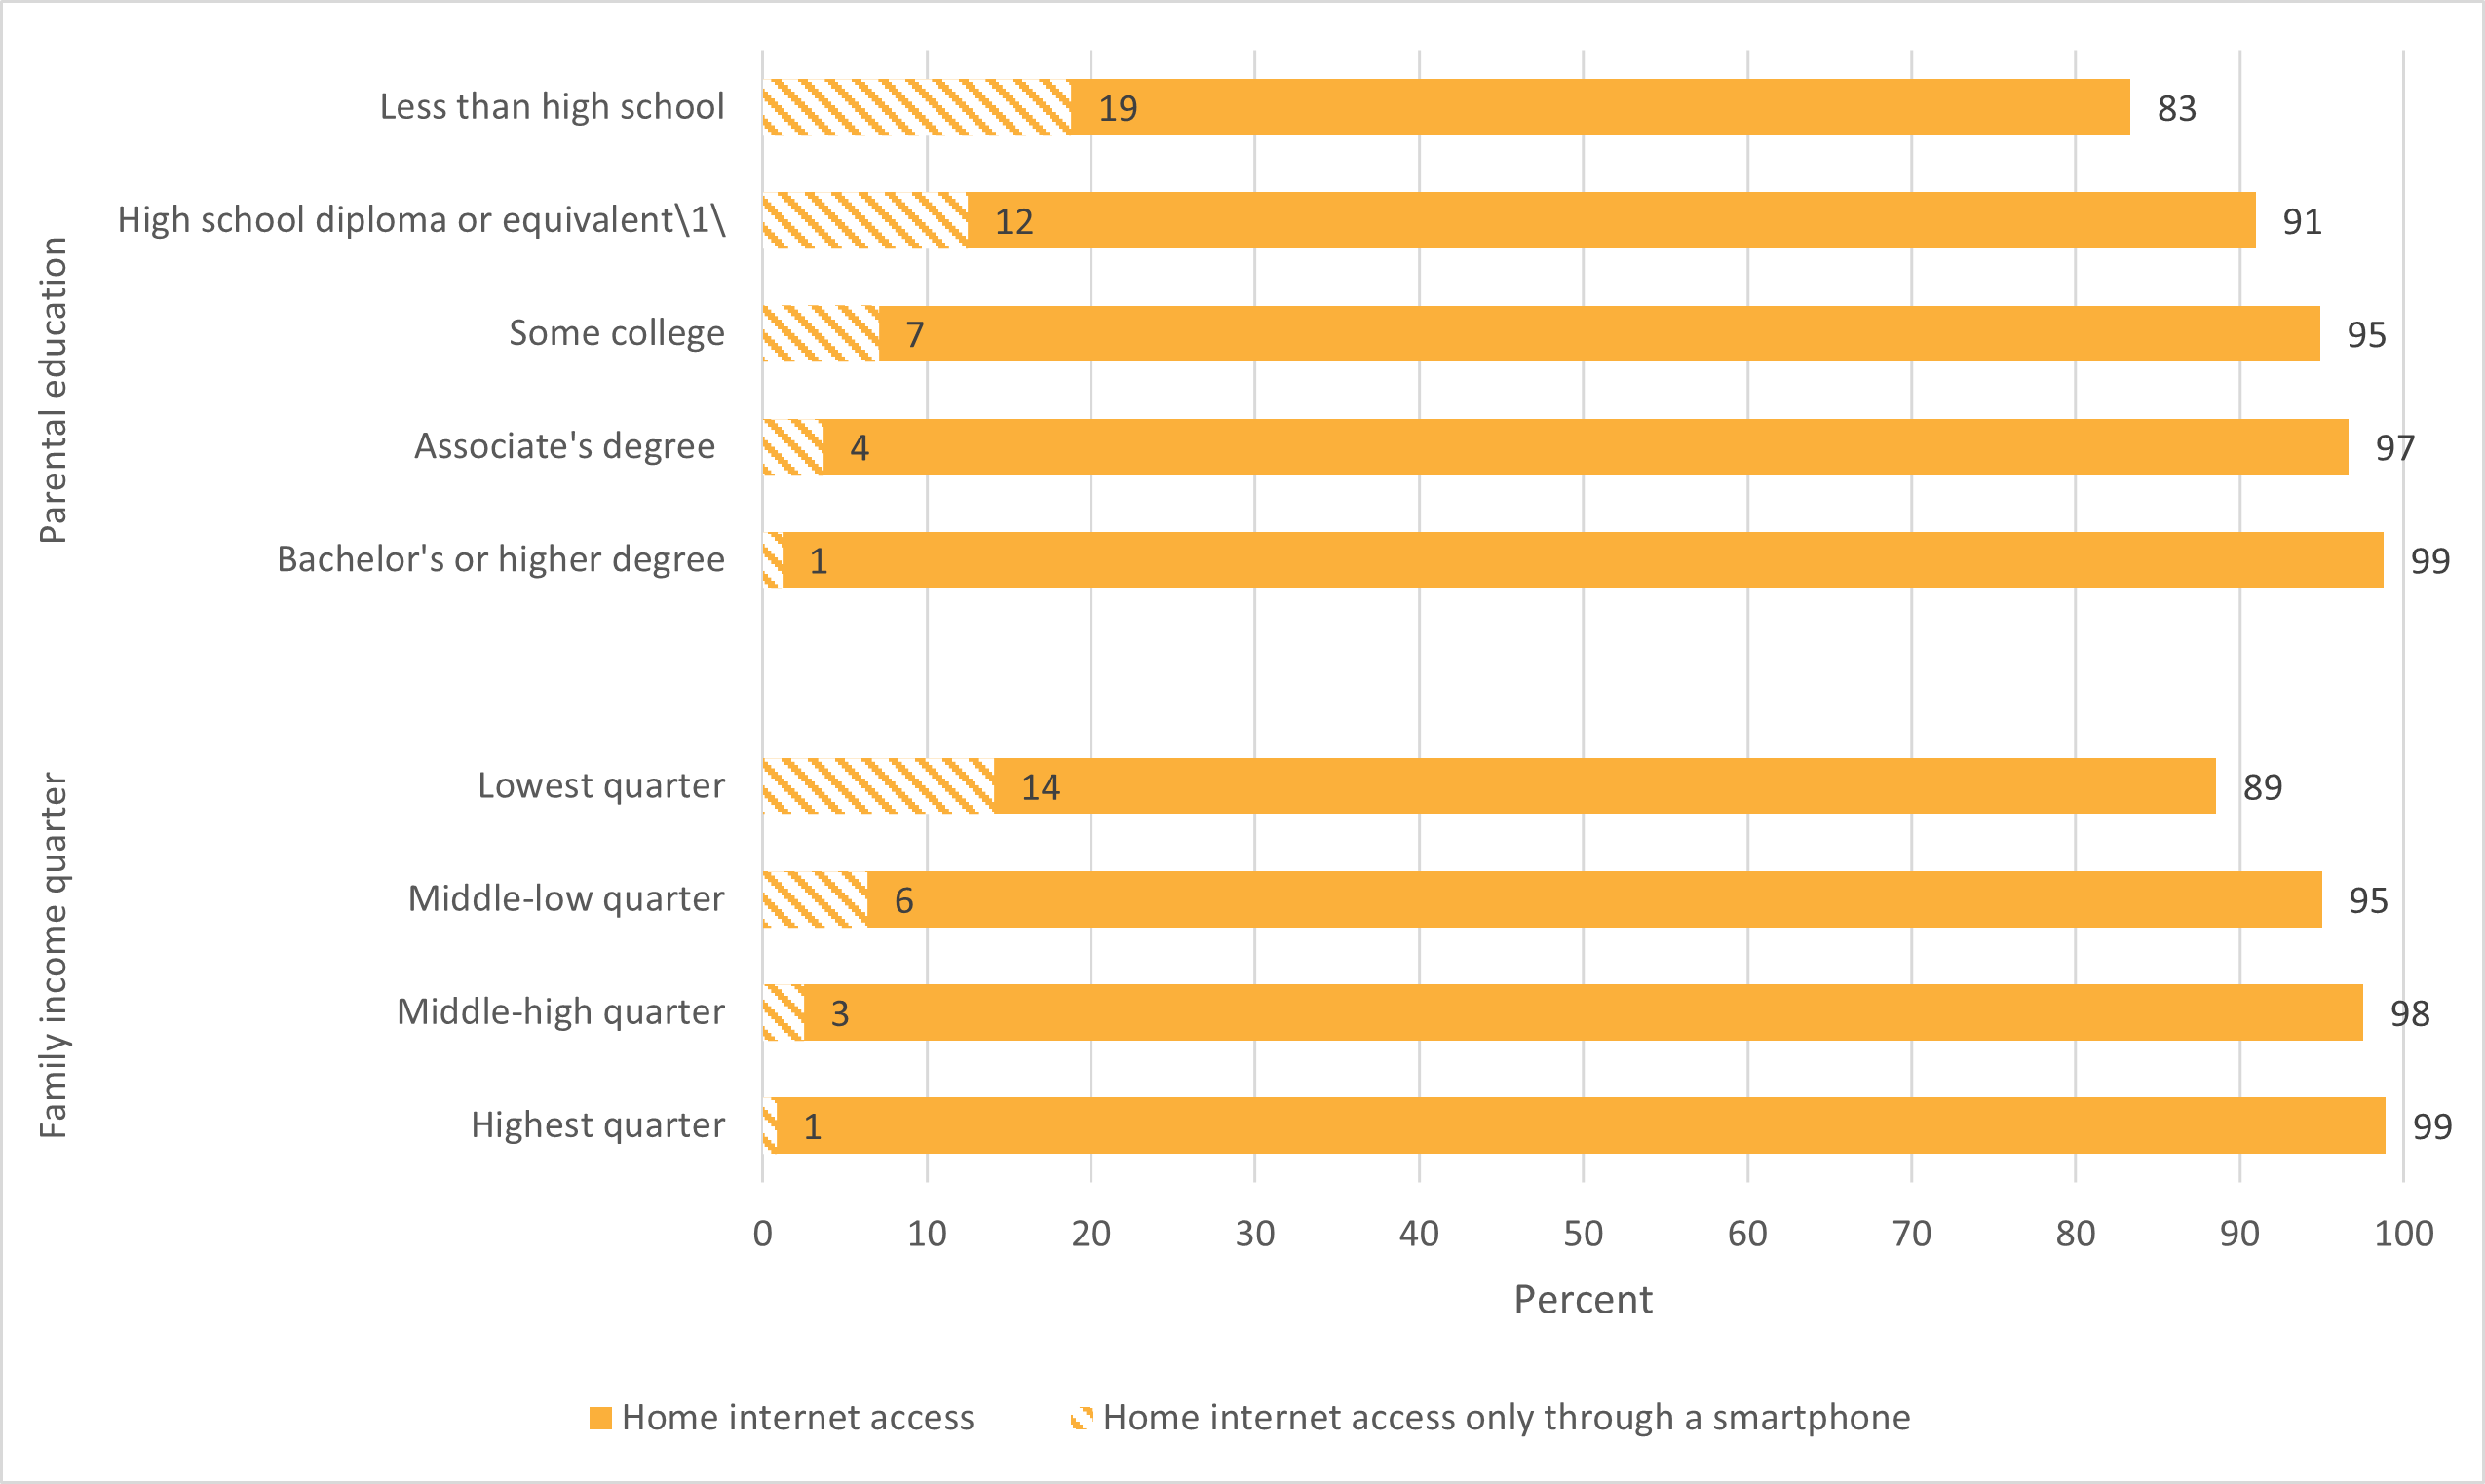
1 Includes those who completed high school through equivalency credentials, such as the GED.
NOTE: Includes only 3- to 18-year-olds living in households (respondents living in group quarters such as shelters, healthcare facilities, or correctional facilities were not asked about internet access). Includes 3- to 18-year-olds who had home internet access only through a smartphone but did not have any of the following types of computers: desktop or laptop, tablet or other portable wireless computer, or “some other type of computer.” Although rounded numbers are displayed, the figures are based on unrounded data.
SOURCE: U.S. Department of Commerce, Census Bureau, American Community Survey (ACS), 2019. See Digest of Education Statistics 2020, table 702.12.


While internet access is nearly universal in the United States (95 percent of all 3- to 18-year-olds had access in 2019), not all families access the internet the same way. Specifically, 88 percent had access through a computer,3 and 6 percent relied on a smartphone for their home internet access.4,5

In 2019, the higher the level of parental educational attainment, the lower the percentage of 3- to 18-year-olds who relied on a smartphone for their home internet access. Similarly, the higher the level of family income, the lower the percentage of 3- to 18-year-olds who relied on a smartphone for their home internet access. For instance, the percentage who relied on a smartphone for their home internet access was lowest for those in families in the highest income quarter (1 percent) and highest for those in families in the lowest income quarter (14 percent) (figure 1).

Taken together with the patterns for overall home internet access, these findings reveal that access only through a smartphone is generally more common for groups with lower rates of internet access overall. Importantly, although smartphones can be useful tools for staying connected, they offer more limited functionality for applications such as word processing or interactive learning platforms. In other words, overall levels of internet access mask further inequities in mode of access, which have implications for whether/how the internet can be used as an educational tool.

During the Coronavirus Pandemic

As students moved en masse to online learning during the pandemic, access to internet-connected devices became a requirement for students to participate effectively in their new learning environments. The pre-pandemic data described above suggest that not all students would have been in a position to take advantage of these remote classrooms, and that this would be true of a higher percentage of students whose parents had lower incomes or lower levels of educational attainment.  

Some schools and districts helped students meet these needs by providing computers or paying for home internet access. Data from the Household Pulse Survey (HPS) show that 59 percent of adults6 with children in the home enrolled in school7 reported that computers were provided by their school or district. This percentage was generally higher for those with lower 2019 household incomes, ranging from 68 percent for adults with household incomes below $25,000 to 50 percent for adults with household incomes over $150,000 (figure 2). A similar pattern was observed for internet access. Overall, 4 percent of adults said internet access was paid for by their students’ district or school, ranging from 8 percent for adults in the lowest household income range to about 1 percent for those in the highest household income range. These patterns are consistent with higher rates of assistance going to families with higher rates of expected need (as indicated in figure 1).


Figure 2. Among adults 18 years old and over who had children under 18 in the home enrolled in school, percentage reporting that computers and internet access were always or usually available and provided or paid for by schools or school districts, by income level: September 2 to 14, 2020

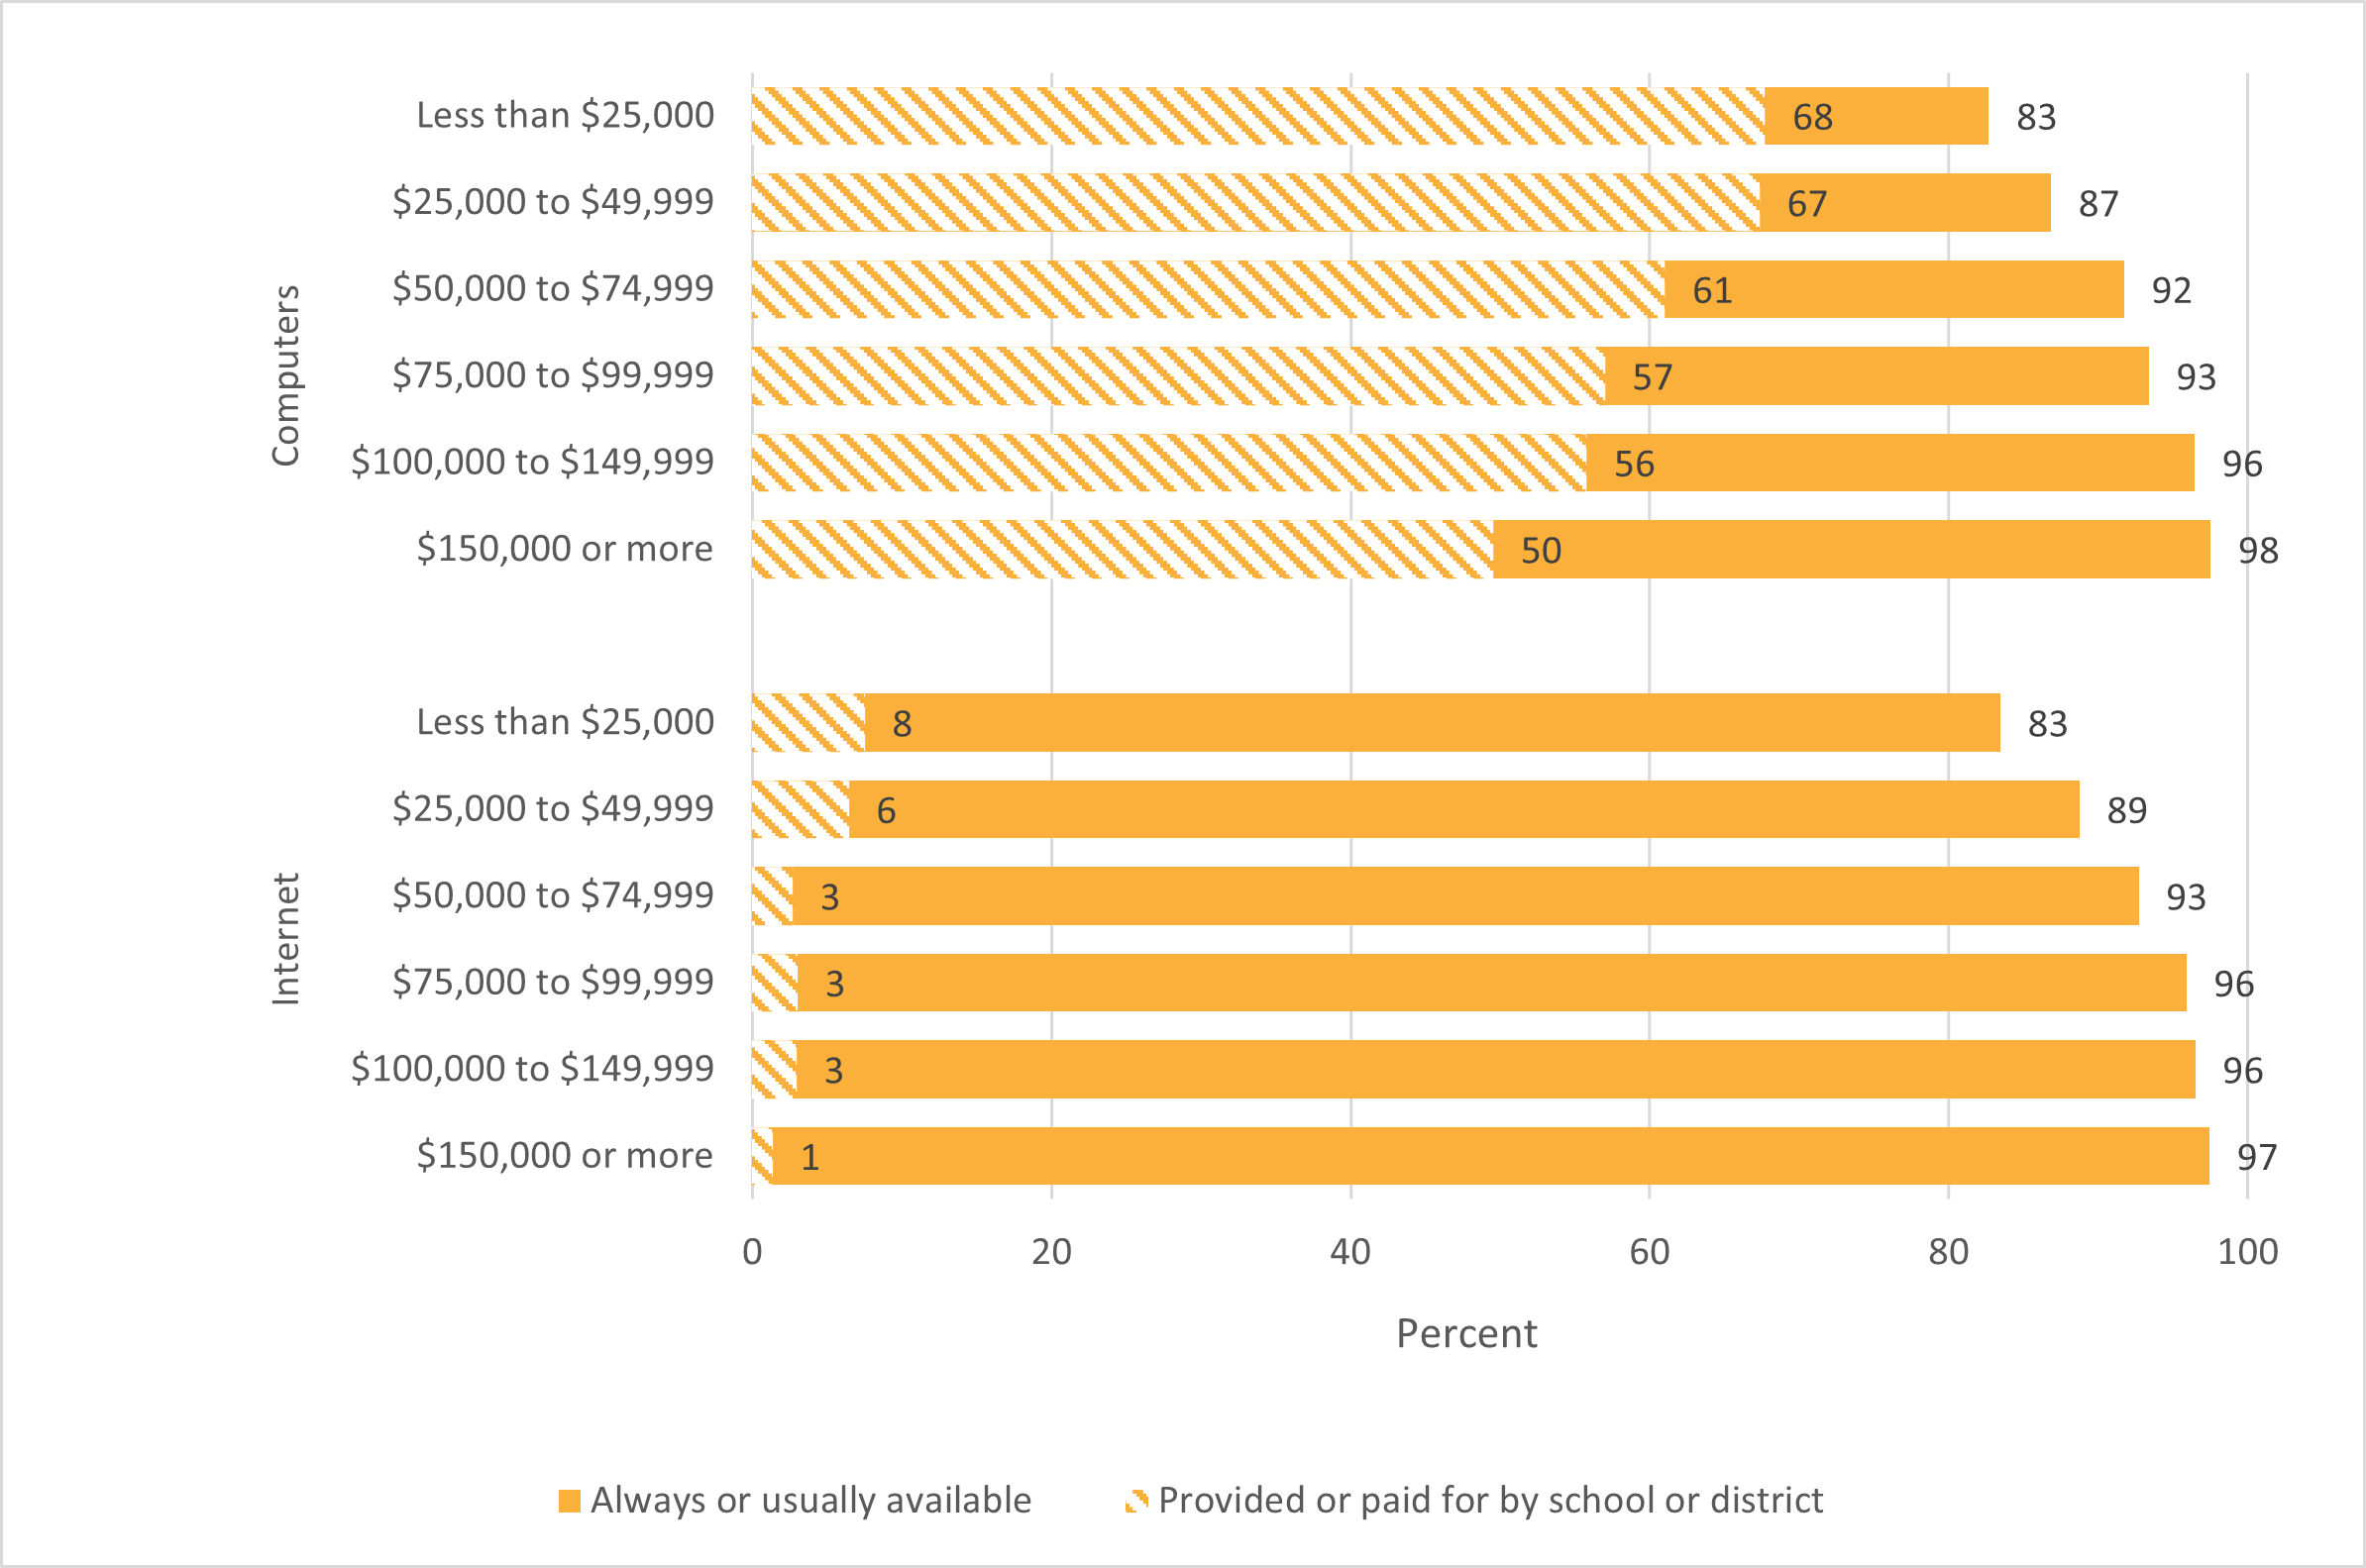
NOTE: Although rounded numbers are displayed, the figures are based on unrounded data. Data in this figure are considered experimental and do not meet NCES standards for response rates. The survey question refers to enrollment at any time during the 2020–21 school year.
SOURCE: U.S. Department of Commerce, Bureau of the Census, Household Pulse Survey, collection period of September 2 to 14, 2020. See Digest of Education Statistics 2020, tables 218.85 and 218.90.


Even with this assistance from schools and districts, however, socioeconomic inequalities in students’ access to computers and internet were not eliminated. In general, the percentage of adults who reported that these resources were always or usually available increased with household income. For example, in September 2020, the percentage of adults reporting that computers were always or usually available was highest for the two household income levels at or above $100,000 and lowest for the two household income levels below $50,000. Similarly, the percentage of adults reporting that internet access was always or usually available was higher for the three household income levels at or above $75,000 than for the three household income levels below $75,000.

Both before and during the pandemic, these data show that overall access to education technology in the United States is high. This access is bolstered by widespread access to mobile devices like smartphones and—at least during the 2020–21 academic year—by resources provided by students’ schools and districts, particularly for students from lower socioecnomic backgrounds. Nevertheless, inequalities persist. As the prevalence of technology in education grows, it will be important to continue to track equity not only in access but also in quality of access and frequency and competency of use.

Explore the following resources to learn more about students’ access to, use of, and competency with education technology.

General

Access

  • Condition of Education 2021

Use

Competency


By Véronique Irwin, NCES


[1] The American Community Survey (ACS) provides a large monthly sample of demographic, socioeconomic, and housing data comparable in content to the Long Forms of the Decennial Census. Aggregated over time, these data serve as a replacement for the Long Form of the Decennial Census. This section of the blog post uses data from ACS to describe the percentage of 3- to 18-year-olds with home internet access and the percentage with home internet access only through a smartphone in 2019.

[2] The highest quarter refers to the top 25 percent of all family incomes; the middle-high quarter refers to the 51st through the 75th percentile of all family incomes; the middle-low quarter refers to the 26th through the 50th percentile of all family incomes; and the lowest quarter refers to the bottom 25 percent of all family incomes.

[3] Refers to the percentage of 3- to 18-year-olds with home internet access through one or more of the following types of computers: desktop or laptop, tablet or other portable wireless computer, or “some other type of computer.” Includes homes having both smartphones and any of these types of computers.

[4] Refers to the percentage of 3- to 18-year-olds who had home internet access only through a smartphone but did not have any of the types of computers listed in endnote 3.

[5] Detail does not sum to totals because of rounding.

[6] The Household Pulse Survey, conducted by the Census Bureau and other agencies including NCES, gathers information from adults about household educational activities (as well as other topics). Because the data focus on adults, findings from HPS are not directly comparable to those from ACS mentioned above.

[7] According to HPS data, 52 million adults had children under age 18 in the home enrolled in school in September 2020. Overall, two-thirds (67 percent) of these adults reported that classes for their children had moved to a distance learning format using online resources.

The Growing Reading Gap: IES Event to Link Knowledge to Action Through Literacy Data

On June 8 and 9, the Institute of Education Sciences (IES) and the Council of the Great City Schools (CGCS) will host a Reading Summit to address one of the most important issues confronting American education today: the declining reading performance of America’s lowest-performing students and the growing gap between low- and high-performing students.

At this 2-day virtual event, participants will explore the results of the National Assessment of Educational Progress (NAEP), as well as other IES data, and learn strategies to help educators and low-performing readers make progress.

Learn more about the summit’s agenda and speakers—including IES Director Mark Schneider, NCES Commissioner James L. Woodworth, and NCES Associate Commissioner Peggy Carr—and register to participate (registration is free).

In the meantime, explore some of the data NCES collects on K–12 literacy and reading achievement, which show that the scores of students in the lowest-performing groups are decreasing over time.

  • The National Assessment of Educational Progress (NAEP) administers reading assessments to 4th-, 8th-, and 12th-grade students. The most recent results from 2019 show that average reading scores for students in the 10th percentile (i.e., the lowest-performing students) decreased between 2017 and 2019 at grade 4 (from 171 to 168) and grade 8 (from 219 to 213) and decreased between 2019 and 2015 at grade 12 (from 233 to 228).
  • The Progress in International Reading Literacy Study (PIRLS) is an international comparative assessment that measures 4th-grade students’ reading knowledge and skills. The most recent findings from 2016 show that the overall U.S. average score (549) was higher than the PIRLS scale centerpoint (500), but at the 25th percentile, U.S. 4th-graders scored lower in 2016 (501) than in 2011 (510).
  • The Program for International Student Assessment (PISA) is a study of 15-year-old students’ performance in several subjects, including reading literacy. The 2018 results show that, although the overall U.S. average reading score (505) was higher than the OECD average score (487), at the 10th percentile, the U.S. average score in 2018 (361) was not measurably different from the score in 2015 and was lower than the score in 2012 (378).

NCES also collects data on young children’s literacy knowledge and activities as well as the literacy competencies of adults. Here are a few data collections and tools for you to explore:

This year, the Condition of Education includes a newly updated indicator on literacy activities that parents reported doing with young children at home. Here are some key findings from this indicator, which features data from the 2019 NHES Early Childhood Program Participation Survey:

In the week before the parents were surveyed,

  • 85 percent of 3- to 5-year-olds were read to by a family member three or more times.
  • 87 percent of 3- to 5-year-olds were told a story by a family member at least once.
  • 96 percent of 3- to 5-year-olds were taught letters, words, or numbers by a family member at least once.

In the month before the parents were surveyed,

  • 37 percent of 3- to 5-year-olds visited a library with a family member at least once.

Be sure to read the full indicator in the 2021 Condition of Education, which was released in May, for more data on young children’s literacy activities, including analyses by race/ethnicity, mother’s educational attainment, and family income.

Don’t forget to follow NCES on Twitter, Facebook, and LinkedIn to stay up-to-date on the latest findings and trends in literacy and reading data and register for the IES Reading Summit to learn more about this topic from experts in the field. 


By Megan Barnett, AIR

Announcing the Condition of Education 2021 Release

NCES is pleased to present the 2021 edition of the Condition of Education, an annual report mandated by the U.S. Congress that summarizes the latest data on education in the United States. This report uses data from across the center and from other sources and is designed to help policymakers and the public monitor educational progress.

Beginning in 2021, individual indicators can be accessed online on the newly redesigned Condition of Education Indicator System website. A synthesis of key findings from these indicators can be found in the Report on the Condition of Education, a more user-friendly PDF report.

A total of 86 indicators are included in this year’s Condition of Education, 55 of which were updated this year. As in prior years, these indicators present a range of topics from prekindergarten through postsecondary education, as well as labor force outcomes and international comparisons. Additionally, this year’s 55 updated indicators include 17 indicators on school crime and safety.

For the 2021 edition of the Condition of Education, most data were collected prior to 2020, either during the 2018–19 academic year or in fall 2019. Therefore, with some exceptions, this year’s report presents findings from prior to the coronavirus pandemic.

At the elementary and secondary level (prekindergarten through grade 12), the data show that 50.7 million students were enrolled in public schools fall 2018, the most recent year for which data were available at the time this report was written. Public charter school enrollment accounted for 7 percent (3.3 million students) of these public school enrollments, more than doubling from 3 percent (1.6 million students) in 2009. In 2019, U.S. 4th- and 8th-grade students scored above the scale centerpoint (500 out of 1000) on both the math and science assessments in the Trends in International Mathematics and Science Study (TIMSS).

In 2020, 95 percent of 25- to 29-year-olds had at least a high school diploma or equivalent, while 39 percent had a bachelor’s or higher degree. These levels of educational attainment are associated with economic outcomes, such as employment and earnings. For example, among those working full time, year round, annual median earnings in 2019 were 59 percent higher for 25- to 34-year-olds with a bachelor’s or higher degree than for those with a high school diploma or equivalent.

In addition to regularly updated annual indicators, this year’s two spotlight indicators highlight early findings on the educational impact of the coronavirus pandemic from the Household Pulse Survey (HPS).

  • The first spotlight examines distance learning at the elementary and secondary level at the beginning of the 2020–21 academic year. Overall, among adults with children under 18 in the home enrolled in school, two-thirds reported in September 2020 that classes had been moved to a distance learning format using online resources. In order to participate in these remote learning settings, students must have access to computers and the internet. More than 90 percent of adults with children in their household reported that one or both of these resources were always or usually available to children for educational purposes in September 2020. At the same time, 59 percent of adults reported that computers were provided by the child’s school or district, while 4 percent reported that internet access was paid for by the child’s school or district. Although higher percentages of lower income adults reported such assistance, this did not eliminate inequalities in access to these resources by household income.
  • The second spotlight examines changes in postsecondary education plans for fall 2020 in response to the coronavirus pandemic. Among adults 18 years old and over who had household members planning to take classes in fall 2020 from a postsecondary institution, 45 percent reported that the classes at least one household member planned would be in different formats in the fall (e.g., formats would change from in-person to online), 31 percent reported that all plans to take classes in the fall had been canceled for at least one household member, and 12 percent reported that at least one household member would take fewer classes in the fall. Some 28 percent reported no change in fall plans to take postsecondary classes for at least one household member. The two most frequently cited reasons for the cancellation of plans were having the coronavirus or having concerns about getting the coronavirus (46 percent), followed by not being able to pay for classes/educational expenses because of changes to income from the pandemic (42 percent).

The Condition of Education also includes an At a Glance section, a Reader’s Guide, a Glossary, and a Guide to Sources, all of which provide additional background information. Each indicator includes references to the source data tables used to produce the indicator.

As new data are released throughout the year, indicators will be updated and made available online.

In addition to publishing the Condition of Education, NCES produces a wide range of other reports and datasets designed to help inform policymakers and the public about significant trends and topics in education. More information about the latest activities and releases at NCES may be found on our website or by following us on Twitter, Facebook, and LinkedIn.


By James L. Woodworth, NCES Commissioner

NCES's Top Hits of 2020

As we wrap up what has been an unprecedented year in many ways, we’re taking a look back at some of NCES’s most popular content from 2020. As you reflect on the past year, we hope you’ll explore our most downloaded reports, most visited indicators, Fast Facts, and blog posts, and most viewed tweets over the past year. 


Top Five Reports, by number of PDF downloads

1. Condition of Education 2020 (7,328)

2Digest of Education Statistics 2018 (4,936)

3. Status and Trends in the Education of Racial and Ethnic Groups 2018 (3,379)

4. Trends in High School Dropout and Completion Rates in the United States: 2019 (2,994)

5. First-Generation Students: College Access, Persistence, and Postbachelor’s Outcomes (2,382)


Top Five indicators from the Condition of Education, by number of web sessions

1. Students With Disabilities (82,304)

2. Public High School Graduation Rates (66,993)

3. Education Expenditures by Country (61,766)

4. English Language Learners in Public Schools (46,293)

5. Undergraduate Enrollment (46,766)


Top Five Fast Facts, by number of web sessions

1. Back to School Statistics (214,148)

2. Tuition Costs of Colleges and Universities (111,491)

3. College and University Endowments (78,735)

4. Degrees Conferred by Race and Sex (73,980)

5. Closed Schools (69,142)


Top Five Blog Posts, by number of web sessions

1. Introducing the 2020 Classification of Instructional Programs (CIP) and Its Website (7,822)

2. Back to School by the Numbers: 2019–20 School Year (4,400)

3. Free or Reduced Price Lunch: A Proxy for Poverty? (4,199)

4. Educational Attainment Differences by Students’ Socioeconomic Status (2,919)

5. The Digital Divide: Differences in Home Internet Access (2,699)


Top Five Tweets, by number of impressions

1. Teacher Appreciation Day (21,146)


2. International Education Week (18,333)


3. Trends in High School Dropout and Completion Rates in the United States: 2019 (17,383)


4. International Early Learning Study 2018 Pilot (10,870)


5. NAEP Data Training Workshop (10,782)


Be sure to check our blog site and the NCES website to stay up-to-date on new findings and trends in 2021. You can also follow NCES on Twitter, Facebook, and LinkedIn for daily updates and content.

Bar Chart Races: Changing Demographics in K–12 Public School Enrollment

Bar chart races are a useful tool to visualize long-term trend changes. The visuals below, which use data from an array of sources, depict the changes in U.S. public elementary and secondary school enrollment from 1995 to 2029 by race/ethnicity.


Source: U.S. Department of Education, National Center for Education Statistics, Common Core of Data (CCD), “State Nonfiscal Survey of Public Elementary and Secondary Education,” 1995–96 through 2017–18; and National Elementary and Secondary Enrollment by Race/Ethnicity Projection Model, 1972 through 2029.


Total enrollment in public elementary and secondary schools has grown since 1995, but it has not grown across all racial/ethnic groups. As such, racial/ethnic distributions of public school students across the country have shifted.

One major change in public school enrollment has been in the number of Hispanic students enrolled. Enrollment of Hispanic students has grown from 6.0 million in 1995 to 13.6 million in fall 2017 (the last year of data available). During that time period, Hispanic students went from making up 13.5 percent of public school enrollment to 26.8 percent of public school enrollment. NCES projects that Hispanic enrollment will continue to grow, reaching 14.0 million and 27.5 percent of public school enrollment by fall 2029.

While the number of Hispanic public school students has grown, the number of White public school students schools has steadily declined from 29.0 million in 1995 to 24.1 million in fall 2017. NCES projects that enrollment of White public school students will continue to decline, reaching 22.4 million by 2029. The percentage of public school students who were White was 64.8 percent in 1995, and this percentage dropped below 50 percent in 2014 (to 49.5 percent). NCES projects that in 2029, White students will make up 43.8 percent of public school enrollment.

The percentage of public school students who were Black decreased from 16.8 percent in 1995 to 15.2 percent in 2017 and is projected to remain at 15.2 percent in 2029. The number of Black public school students increased from 7.6 million in 1995 to a peak of 8.4 million in 2005 but is projected to decrease to 7.7 million by 2029. Between fall 2017 and fall 2029, the percentage of public school students who were Asian/Pacific Islander is projected to continue increasing (from 5.6 to 6.9 percent), as is the percentage who were of Two or more races (from 3.9 to 5.8 percent). American Indian/Alaska Native students account for about 1 percent of public elementary and secondary enrollment in all years.

For more information about this topic, see The Condition of Education indicator Racial/Ethnic Enrollment in Public Schools.


By Ke Wang and Rachel Dinkes, AIR