Distance education (DE) is defined by the Integrated Postsecondary Education Data System (IPEDS) as “education that uses one or more technologies to deliver instruction to students who are separated from the instructor.” By allowing students to take classes online in their own locations and on their own schedules, DE has increased access to college. Since the beginning of the coronavirus pandemic in spring 2020, DE has become an important way to deliver college classes while helping to keep students safe.
IPEDS collects information on DE in four of its surveys: Institutional Characteristics, Fall Enrollment, Completions, and, most recently, 12-Month Enrollment. The figures below present key statistics on DE course/program offerings and enrollments at U.S. colleges.
How many colleges offer distance education courses and programs?
In 2018–19, most colleges (79 percent) offered either stand-alone DE courses or entire DE programs (e.g., 100% online degrees). DE course and program offerings differed by the control (public, private nonprofit, or private for-profit) and level (4-year or 2-year) of the college.
- Almost all public 4- and 2-year colleges (96 and 97 percent, respectively) offered either DE courses or DE programs.
- A majority of private nonprofit and for-profit 2-year colleges (53 and 59 percent, respectively) did not offer DE courses or DE programs, though they account for a small number of colleges.
Figure 1. Percentage distribution of colleges, by control, level, and distance education (DE) offerings of college: Academic year 2018–19
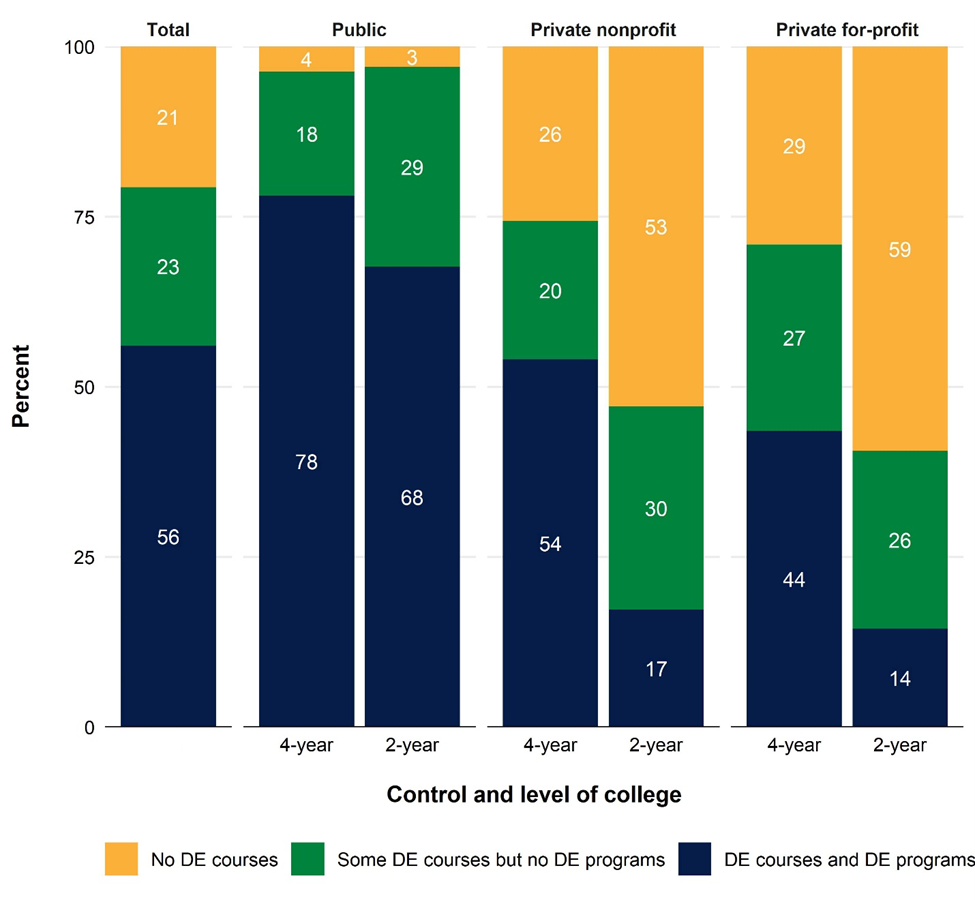
NOTE: Figure includes U.S. degree-granting institutions that participate in Title IV federal financial aid programs. Although rounded numbers are displayed, the figures are based on unrounded data. Detail may not sum to totals because of rounding.
SOURCE: U.S. Department of Education, National Center for Education Statistics, Integrated Postsecondary Education Data System (IPEDS) Institutional Characteristics component, Fall 2018.
How many students are enrolled in distance education courses?
In fall 2018, about 6.9 million students enrolled in DE courses, or 35 percent of the total fall enrollment population (19.6 million).
- Between fall 2012 and 2018, DE course enrollment increased 29 percent (from 5.4 to 6.9 million), while total fall enrollment declined by 5 percent (from 20.6 to 19.6 million).
- The number of students enrolled in a mix of DE and face-to-face courses increased by 33 percent (from 2.8 to 3.7 million) between fall 2012 and 2018. The number of students enrolled in only DE courses also increased, but at a slower rate of 24 percent (from 2.6 to 3.3 million).
Figure 2. Total college enrollment, by distance education (DE) participation of students: Fall 2012 through fall 2018
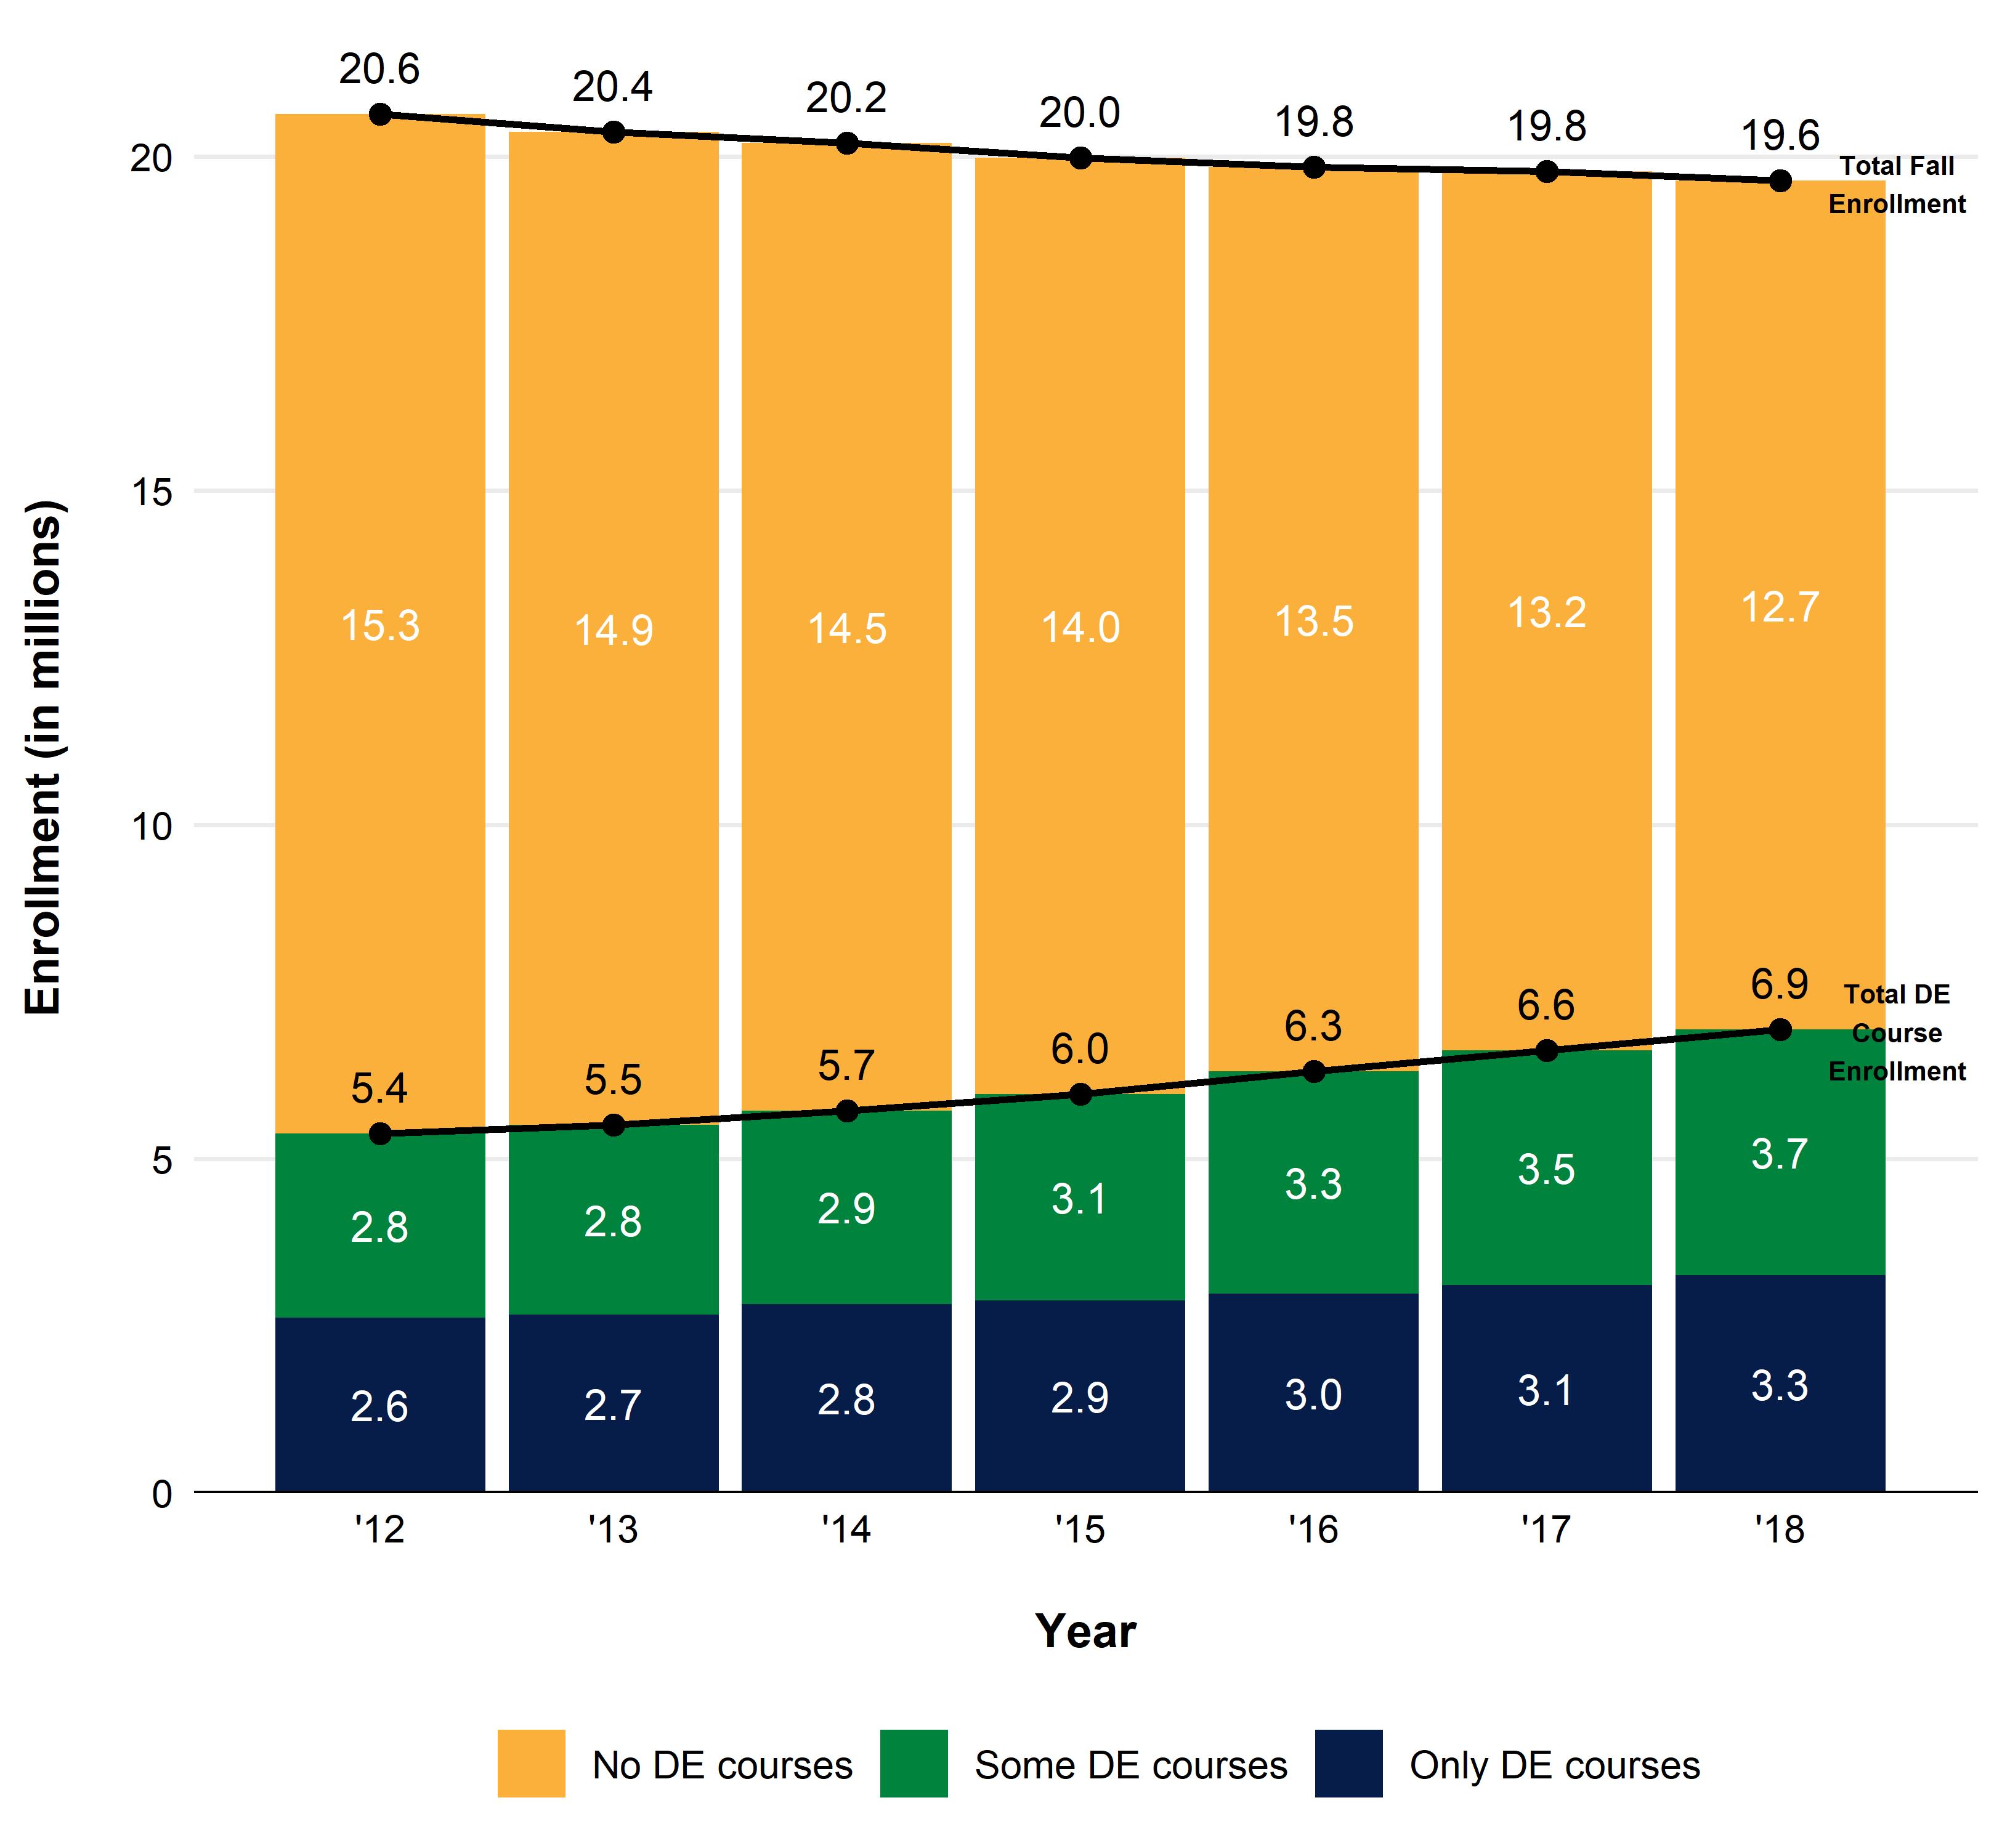
NOTE: Figure includes U.S. degree-granting institutions that participate in Title IV federal financial aid programs. Although rounded numbers are displayed, the figures are based on unrounded data.
SOURCE: U.S. Department of Education, National Center for Education Statistics, Integrated Postsecondary Education Data System (IPEDS) Fall Enrollment component, Spring 2013 through Spring 2019.
How does enrollment in distance education courses vary by college control?
In fall 2018, the share of students enrolled in DE courses differed by control of the college.
- About one-third of students at public and private nonprofit colleges enrolled in at least one DE course (34 and 30 percent, respectively).
- At public colleges, students were more likely to enroll in a mix of DE and face-to-face courses (22 percent) than in only DE courses (12 percent). This trend reversed at private nonprofit colleges, with 10 percent of students enrolled in a mix of DE and face-to-face courses and 20 percent in only DE courses.
- At private for-profit colleges, most students (73 percent) enrolled in at least one DE course (10 percent in a mix of DE and face-to-face courses and 63 percent in only DE courses).
Figure 3. Percentage distribution of college enrollment, by control of college and distance education (DE) participation of students: Fall 2012 through fall 2018
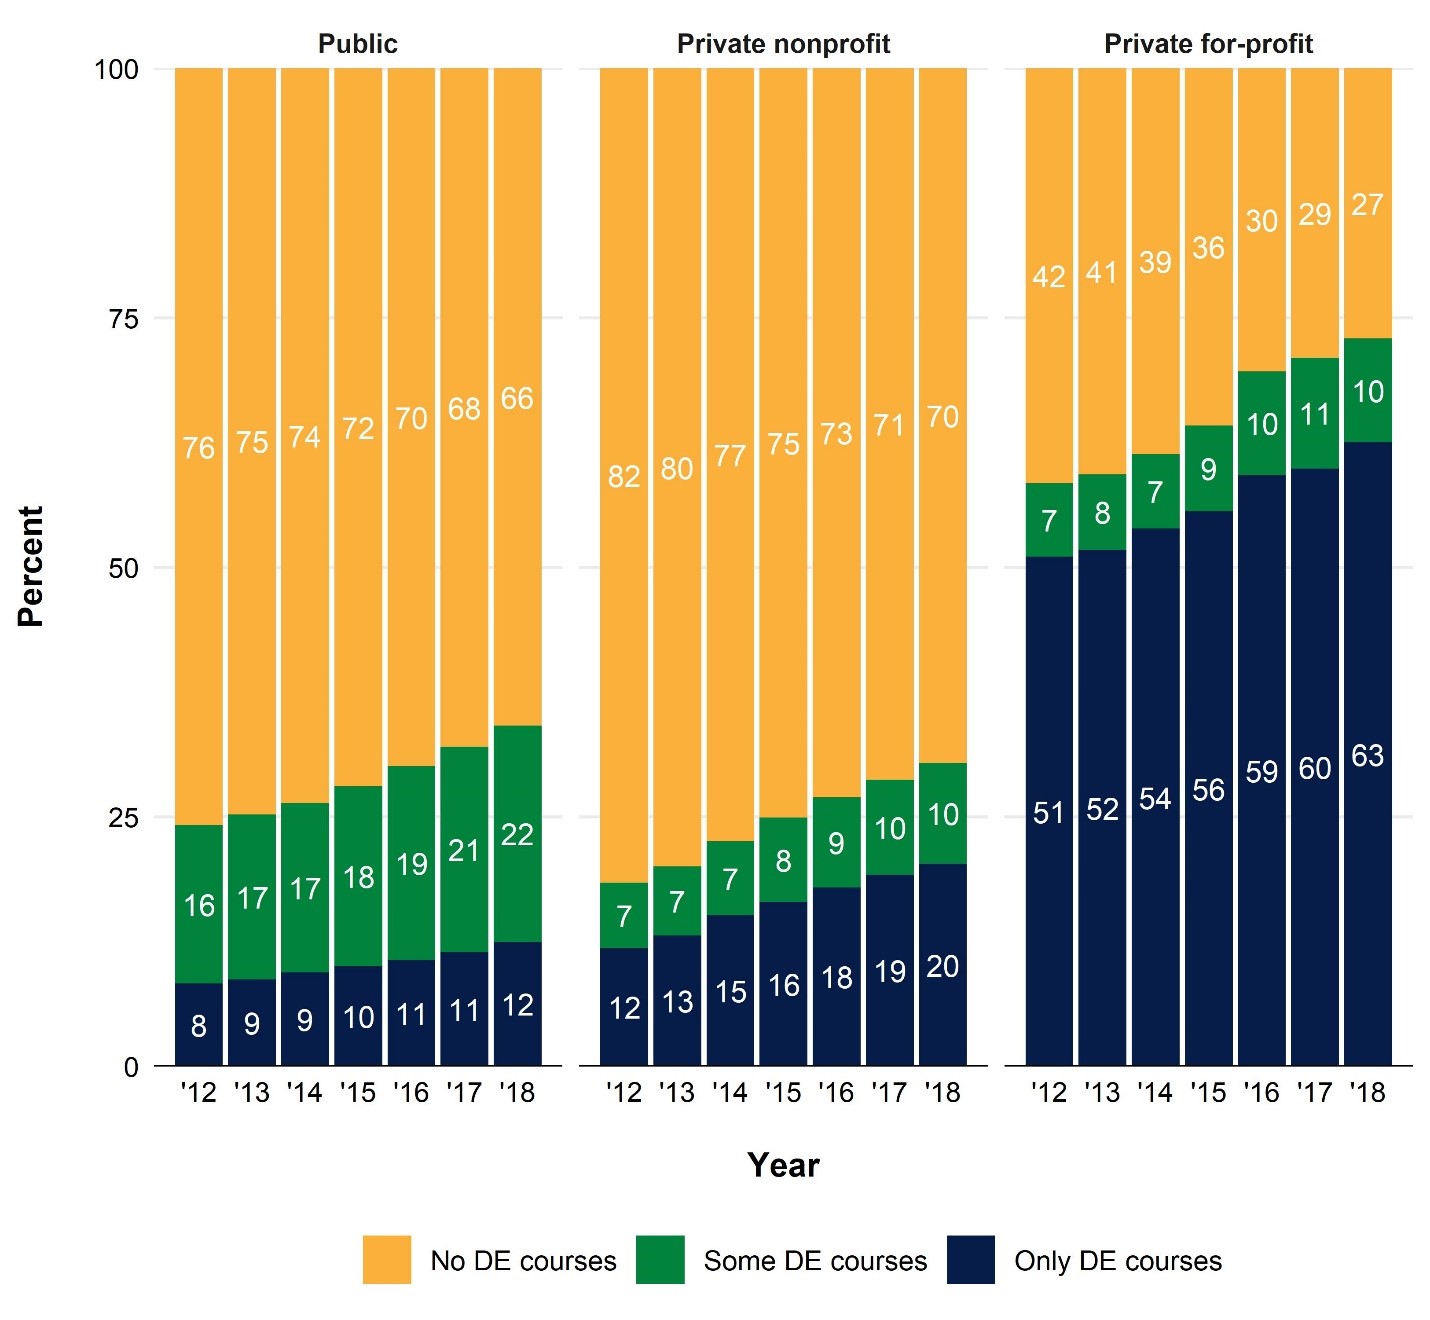
NOTES: Figure includes U.S. degree-granting institutions that participate in Title IV federal financial aid programs. Although rounded numbers are displayed, the figures are based on unrounded data. Detail may not sum to totals because of rounding.
SOURCE: U.S. Department of Education, National Center for Education Statistics, Integrated Postsecondary Education Data System (IPEDS) Fall Enrollment component, Spring 2013 through Spring 2019.
Among students enrolled in only DE courses, where do they live relative to their colleges?
Students taking only DE courses do not necessarily live far away from their colleges (even when physically coming to campus is generally not required), especially among students enrolled in public colleges.
- In fall 2018, most (82 percent) of the 1.8 million students taking only DE courses at public colleges lived in the same state as their colleges. Only 15 percent lived in a different state.
- At private nonprofit and for-profit colleges, students taking only DE courses were less likely to live in the same state as their colleges (35 percent and 17 percent, respectively) and more likely to live in a different state (63 percent and 81 percent, respectively) in fall 2018.
Figure 4. Percentage distribution of college enrollment for students enrolled in only distance education (DE) courses, by control of college and location of students: Fall 2018

NOTE: One square represents 1 percent. “State unknown” is reported by the institution when a student’s home state of residence cannot be determined; “Location unknown” is imputed by IPEDS to classify students when the institution does not report any residence status. Figure includes U.S. degree-granting institutions that participate in Title IV federal financial aid programs.
SOURCE: U.S. Department of Education, National Center for Education Statistics, Integrated Postsecondary Education Data System (IPEDS) Fall Enrollment component, Spring 2019.
The DE enrollment figures above use the most recent IPEDS data available, which is limited to a fall “snapshot” date. However, in 2020–21, IPEDS expanded the 12-Month Enrollment survey to collect DE course enrollment for the entire 12-month academic year, which will provide even more information on DE enrollments at U.S. colleges. The first 12-month DE enrollment data, representing the 2019–20 academic year, will be released in spring 2021. These will be the first IPEDS enrollment data to overlap with the coronavirus pandemic, and DE course enrollments are expected to increase.
To learn more about DE data collected in IPEDS, visit the Distance Education in IPEDS resource page. To explore IPEDS data through easy-to-use web tools or to access data files to conduct your own original analyses like the ones presented in this blog, visit the IPEDS Use the Data page.
By Roman Ruiz and Jie Sun, AIR