NCES Blog

National Center for Education Statistics

Back to School by the Numbers: 2018

Across the country, hallways and classrooms are full of activity as students head back to school for the 2018–19 academic year. Each year, the National Center for Education Statistics (NCES) compiles some back-to-school facts and figures that give a snapshot of our schools and colleges for the coming year. You can see the full report on the NCES website, but here are a few “by-the-numbers” highlights. You can also click on the hyperlinks throughout the blog to see additional data on these topics.

The staff of NCES and the Institute of Education Sciences hopes our nation’s students, teachers, administrators, school staffs, and families have an outstanding school year!


50.7 million

The number of students expected to attend public elementary and secondary schools this year—slightly more than in the 2017–18­ school year (50.6 million). The racial and ethnic profile of these students includes 24.1 million White students, 7.8 million Black students, 14.0 million Hispanic students, 2.6 million Asian students, 0.2 million Pacific Islander students, 0.5 million American Indian/Alaska Native students, and 1.6 million students of Two or more races.

About 5.9 million students are expected to attend private schools this year.


16.0

The expected number of public school students per teacher in fall 2018. This ratio has remained consistent at around 16.0 since 2010. However, the pupil/teacher ratio is lower in private schools (12.3) and has fallen since 2010, when it was 13.0. 


$12,910

This is the projected per-student expenditure in public elementary and secondary schools in 2018–19. Total expenditures for public elementary and secondary schools are projected to be $654 billion for the 2018–19 school year.


3.6 million

The number of students expected to graduate from high school this academic year, including about 3.3 million from public schools and nearly 0.4 million from private schools.


19.9 million

This is the number of students expected to attend American colleges and universities this fall—higher than the fall 2000 enrollment of 15.3 million but lower than the peak of 21.0 million in 2010. About 13.3 million students will attend four-year institutions and 6.7 million will attend two-year institutions.


56.5%

The projected percentage of female postsecondary students in fall 2018, for a total of about 11.2 million female students, compared with 8.7 million male students.


By Lauren Musu, NCES and Molly Fenster, American Institutes for Research

Trends in Graduate Student Loan Debt

Sixty percent of students who completed a master’s degree in 2015–16 had student loan debt, either from undergraduate or graduate school. Among those with student loan debt, the average balance was $66,000.[i] But there are many types of master’s degrees. How did debt levels vary among specific degree programs? And how have debt levels changed over time? You can find the answers, for both master’s and doctorate degree programs, in the Condition of Education 2018.

Between 1999–2000 and 2015–16, average student loan debt for master’s degree completers increased by:

  • 71 percent for master of education degrees (from $32,200 to $55,200),
  • 65 percent for master of arts degrees (from $44,000 to $72,800),
  • 39 percent for master of science degrees (from $44,900 to $62,300), and
  • 59 percent for “other” master’s degrees[ii] (from $47,200 to $75,100).

Average loan balances for those who completed master of business education degrees were higher in 2015–16 than in 1999–2000 ($66,300 vs. $47,400), but did not show a clear trend during this period.

Between 1999–2000 and 2015–16, average student loan debt for doctorate degree completers increased by:

  • 97 percent for medical doctorates (from $124,700 to $246,000),
  • 75 percent for other health science doctorates[iii] (from $115,500 to $202,400),
  • 77 percent for law degrees (from $82,400 to $145,500),
  • 104 percent for Ph.D.’s outside the field of education (from $48,400 to $98,800), and
  • 105 percent for “other (non-Ph.D.) doctorates[iv] (from $64,500 to $132,200).

While 1999–2000 data were unavailable for education doctorate completers, the average balance in 2015–16 ($111,900) was 66 percent higher than the average loan balance for education doctorate completers in 2003–04 ($67,300).

For more information, check out the full analysis in the Condition of Education 2018.


By Joel McFarland


[i] The average balances in this analysis exclude students with no student loans.

[ii] Includes public administration or policy, social work, fine arts, public health, and other.

[iii] Includes chiropractic, dentistry, optometry, pharmacy, podiatry, and veterinary medicine.

[iv] Includes science or engineering, psychology, business or public administration, fine arts, theology, and other.

Connect with NCES Researchers at Upcoming Summer Conferences: STATS-DC, JSM and ASA

NCES staff will share their knowledge and expertise through research presentations, training sessions, and booth demonstrations at three notable conferences this summer (listed below). The NCES booth will be also be featured at exhibit halls where conference attendees can “ask an NCES expert,” learn how NCES data can support their research, or pick up publications and products.

NCES STATS-DC Data Conference

July 25 – 27
Washington, DC
The Mayflower Hotel

STAT-DC is NCES’ annual conference designed to provide the latest information, resources and training on accessing and using federal education data. Researchers, policymakers and data system managers from all levels are invited to discover innovations in the design and implementation of data collections and information systems. There is no registration fee to attend STATS-DCparticipants must complete registration paperwork onsite at the conference.

Key conference items:

  • Learn updates on federal and state activities affecting data collection and reporting, with a focus on the best new approaches in education statistics
  • Attend general information sessions on CCD, data management, data use, and data privacy, etc.
  • Partake in trainings for Common Core of Data (CCD) and EDFacts data coordinators
  • Attend data tools and resource demonstrations from NCES staff during designated times at the NCES exhibit booth.

NCES Staff Presentations:

Explore the full conference agenda. Some highlighted sessions are shown below.

WEDNESDAY, JULY 25

9:00 a.m. – 12:00 noon
Common Core of Data (CCD) Fiscal Coordinators' Training
District Ballroom

1:15 p.m. – 2:15 p.m.
Opening Plenary Session by Dr. Lynn Woodworth
Grand Ballroom

4:30 p.m. – 5:20 p.m.
Introduction to the Common Core of Data: America's Public Schools by Mark Glander
Palm Court Ballroom

9:00 a.m. – 12:30 p.m.
EDFacts and Common Core of Data (CCD) Nonfiscal Coordinators’ Training
Grand Ballroom

THURSDAY, JULY 26

9:00 a.m. – 10:00 a.m.
Title I Allocations by Bill Sonnenberg
Palm Court Ballroom


American Statistical Association – Joint Statistical Meetings

July 28 – August 2
Vancouver, British Columbia, Canada
Vancouver Convention Centre

JSM is the largest gathering of statisticians and data scientists in North America. Exchange ideas and explore opportunities for collaboration across industries with NCES staff and other statisticians in academia, business, and government.
 

Key conference items:

  • Review applications and methodology of statistics, such as analytics and data science
  • Attend technical sessions, poster presentations, roundtable discussions, professional development courses and workshops
  • Visit the NCES booth in the exhibit hall booth #227 and meet the NCES Chief Statistician, Marilyn Seastrom.

NCES Staff Presentation:

THURSDAY, AUGUST 2
8:35 a.m. – 10:30 a.m.
Educating the Government Workforce to Lead with Statistics by Andrew White
CC-East 10


American Sociological Association – Annual Meeting

August 11 – August 14
Philadelphia, Pennsylvania
Pennsylvania Convention Center and the Philadelphia Marriott Downtown

Professionals involved in the scientific study of society will share knowledge and discuss new directions in research and practice during this annual meeting.

Key conference items:

  • Choose from 600 program sessions throughout the 4-day conference
  • Browse and discuss topics from 3,000+ research papers submitted
  • Swing by the NCES exhibit hall booth #211


Follow us on twitter (@EdNCES) throughout these upcoming conferences to stay up to date and learn the latest in education statistics. We hope you’ll join us whether in person or online!

What Are Threat Assessment Teams and How Prevalent Are They in Public Schools?

As part of the Safe School Initiative, the U.S. Department of Education and U.S. Secret Service authored a report in 2004 that described how schools could establish a threat assessment process “for identifying, assessing, and managing students who may pose a threat of targeted violence in schools.” School-based threat assessment teams are intended to prevent and reduce school violence and are adapted from the U.S. Secret Service’s threat assessment model.

The School Survey on Crime and Safety (SSOCS) collected data on the prevalence of threat assessment teams in schools for the first time in 2015–16 from a nationally representative sample of 3,500 K–12 public schools. The questionnaire defined a threat assessment team as “a formalized group of persons who meet on a regular basis with the common purpose of identifying, assessing, and managing students who may pose a threat of targeted violence in schools.” School-based threat assessment teams are usually composed of some combination of school administrators, teachers, counselors, sworn law enforcement officers, and mental health professionals.

While 42 percent of all public schools reported having a threat assessment team during the 2015–16 school year, the prevalence of threat assessment teams varied by school characteristics.


Percentage of public schools that reported having a threat assessment team, by school level and enrollment size: School year 2015–16

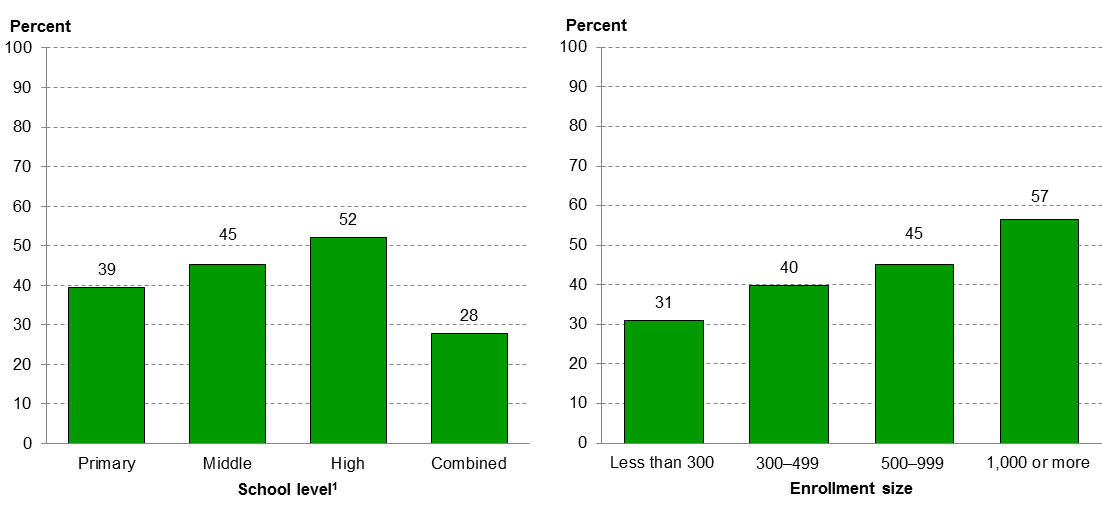
1Primary schools are defined as schools in which the lowest grade is not higher than grade 3 and the highest grade is not higher than grade 8. Middle schools are defined as schools in which the lowest grade is not lower than grade 4 and the highest grade is not higher than grade 9. High schools are defined as schools in which the lowest grade is not lower than grade 9 and the highest grade is not higher than grade 12. Combined schools include all other combinations of grades, including K–12 schools.
NOTE: A threat assessment team was defined for respondents as a formalized group of persons who meet on a regular basis with the common purpose of identifying, assessing, and managing students who may pose a threat of targeted violence in schools. Responses were provided by the principal or the person most knowledgeable about school crime and policies to provide a safe environment. Although rounded numbers are displayed, the figures are based on unrounded estimates.
SOURCE: U.S. Department of Education, National Center for Education Statistics, 2015–16 School Survey on Crime and Safety (SSOCS), 2016. See table 35.


For example, a higher percentage of high schools (52 percent) than of middle (45 percent), primary (39 percent), and combined schools (28 percent) reported having a threat assessment team during the 2015–16 school year. Further, 57 percent of schools with an enrollment size of 1,000 or more students reported having a threat assessment team, compared with 31 percent of schools with an enrollment size of less than 300 students; 40 percent of schools with an enrollment size of 300–499 students; and 45 percent of schools with an enrollment size of 500–999 students.

Threat assessment teams were also more prevalent in schools that had at least one security staff[i] member present at school at least once a week during the 2015–16 school year (48 percent of schools with security staff present vs. 33 percent of schools without security staff present). The percentage of schools reporting a threat assessment team was also higher in schools that reported at least one violent incident[ii] had occurred at school during the 2015–16 school year (44 percent) compared with schools that had no violent incidents (35 percent).

How often a threat assessment team meets can be an indication of how active the team is in the school.  The majority of schools with a threat assessment team in 2015–16 reported that their teams met “on occasion” (62 percent), followed by “at least once a month” (27 percent), “at least once a week” (9 percent), and “never” (2 percent).


Among public schools that reported having a threat assessment team, percentage distribution by frequency of threat assessment team meetings: School year 2015–16

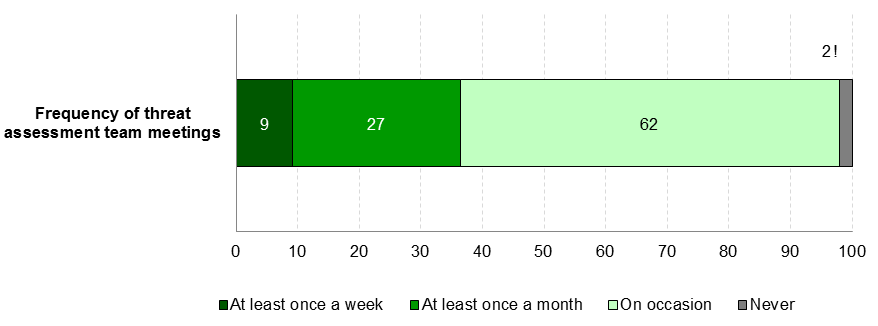
!Interpret data with caution. The coefficient of variation (CV) for this estimate is between 30 and 50 percent.
NOTE: A threat assessment team was defined for respondents as a formalized group of persons who meet on a regular basis with the common purpose of identifying, assessing, and managing students who may pose a threat of targeted violence in schools. Responses were provided by the principal or the person most knowledgeable about school crime and policies to provide a safe environment.
SOURCE: U.S. Department of Education, National Center for Education Statistics, 2015–16 School Survey on Crime and Safety (SSOCS), 2016. See table 35.


You can find more information on school crime and safety in NCES publications, including Crime, Violence, Discipline, and Safety in U.S. Public Schools: Findings From the School Survey on Crime and Safety: 2015–16 and the 2017 Indicators of School Crime and Safety.


By Rachel Hansen, NCES and Melissa Diliberti, AIR


[i] Security staff includes full- or part-time school resource officers, sworn law enforcement officers, or security guards or security personnel present at school at least once a week.

[ii] Violent incidents include rape or attempted rape, sexual assault other than rape (including threatened rape), physical attack or fight with or without a weapon, threat of physical attack with or without a weapon, and robbery (taking things by force) with or without a weapon.


A Closer Look at Teacher Income

Full-time teachers in public school earned an average of $59,050 from all income sources in the 2015–16 school year. This income includes teachers’ base teaching salary, as well as additional sources of income from their schools or districts, jobs outside the school system, and summer activities. To capture the different ways that teachers can earn income, the 2015-16 National Teacher and Principal Survey asked teachers questions about how much they earned from various sources:

  • Base teaching salary. Teachers’ average base teaching salary was $55,120 for the 2015-16 school year.
  • School supplement. About 44 percent of teachers received additional compensation for extracurricular or additional activities in their school system, such as coaching, sponsoring student activities, mentoring teachers, or teaching evening classes. These teachers earned an average of $2,630 for these activities.
  • Merit pay. Some teachers earned merit pay or pay-for-performance income based on their students’ performance. About 6 percent of teachers received this type of additional compensation, with an average amount awarded of $1,470.
  • Other school system support. About 8 percent of teachers received income during the school year from some other source in their school system, such as a state supplement, for an average of $2,670.
  • Outside jobs. During the 2015-16 school year, 18 percent of teachers held a job outside the school system, earning an average of $5,140. Teachers categorized these jobs as teaching or tutoring (5 percent), non-teaching but related to the teaching field (4 percent), or in another field (9 percent).
  • Summer jobs. In the summer of 2015, before the start of the 2015-16 school year, 20 percent of teachers earned income from either a school-based teaching position, such as teaching summer school, or a non-teaching position, and 16 percent earned income from a non-school job. Teachers earned an average of $2,700 from school-based summer positions, and an average of $4,060 in a non-school job.

To learn about teachers’ satisfaction with their teaching salary, more information is available in the short report Teacher Satisfaction with Salary and Current Job.

The National Teacher and Principal Survey (NTPS) includes data on a wide variety of other topics as well. Visit the website to learn more.

By Maura Spiegelman