NCES Blog

National Center for Education Statistics

New Data Explore Adults’ Nondegree Credentials

By Lisa Hudson

Despite a national interest in nondegree credentials—such as postsecondary certificates, occupational certifications, and occupational licenses—there hasn’t been comprehensive, national data on these programs. However, a new report from NCES fills this gap using data from our new Adult Training and Education Survey (ATES).

These data show that 27 percent of adults have a nondegree credential and that 21 percent have completed a work experience program (such as an apprenticeship or internship). The ATES data also show that the completion of degree programs and nondegree programs are related. For example, having a certification or license is more common among adults who have a college degree than among adults with lower levels of education.  

The ATES is one component of the NCES National Household Education Surveys Program (NHES), which collects information on education-related topics that cannot be addressed through school-based surveys. It includes a suite of surveys designed to capture data related to learning at all ages. This most recent NHES administration, conducted from January to September 2016, was the first administration of the ATES. This survey was completed by a national sample of about 47,700 adults between the ages of 16 and 65.

The data show that nondegree credentialing and work experience programs are particularly common in the health care field. In fact, health care was the most common field in which both certifications and licenses were held, and the most common field for which adults had completed a work experience program.

The ATES also found that adults perceive nondegree credentials to be useful for many labor market outcomes. For example, 82 percent of adults who have a certification or license reported that it was very useful for “getting a job”, 81 percent reported that it was very useful for “keeping you marketable to employers or clients”, and 66 percent reported it that was very useful for “improving your work skills” (see figure). 

The ATES data will be available to researchers in the coming months. Check the NHES website for updates.

Getting to Know and Use the Integrated Postsecondary Education Data System

By Sarah Souders

More than 3,915,918 individuals were employed by degree-granting postsecondary institutions in 2015. These employees provided services and support to the 19,977,270 students attending the nation’s 4,562 degree-granting institutions.

We know this information—and much more—because of the Integrated Postsecondary Education Data System (IPEDS), a program in the National Center for Education Statistics (NCES). In fact, these data points only scratch the surface of information collected and updated annually by IPEDS. Each year, IPEDS issues 12 surveys to all postsecondary institutions receiving Title IV Federal Aid[1] and some institutions that participate by choice. The surveys provide data on a broad range of topics, from enrollment, admissions, and cost to grad rates, faculty, and human resources.  These data are reported by gender, race/ethnicity, institution type, and more.

But we don’t just want people to know about the data – we want them to use it!

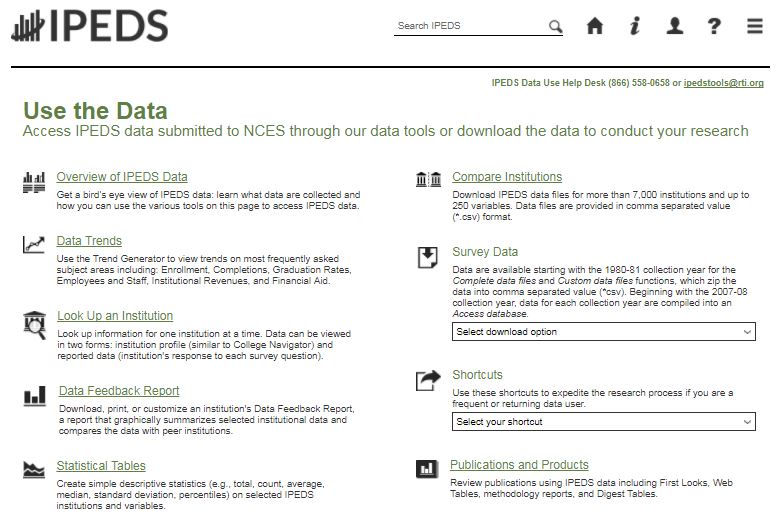
The “Use the Data” landing page (see image below) provides many options for analysis. Users can look up and compare institutions, view trends and statistical tables for specific data points, download a complete survey file, customize a data file, or download a report summarizing the data for specific institutions.

Screen shot of IPEDS Use the Data website

There are many options for analysis given the extensive data collection and number of tools. One tool, the IPEDS Trend Generator, allows users to select a subject and question to observe trends over time. The trend generator allows users to explore enrollment trends, among many other topics.

Below is an example of a bar graph that can be generated using this tool. With the click of a couple of buttons, you can quickly learn that the number of students attending postsecondary institutions (as measured by 12-month enrollment) has been declining in recent years, after peaking in 2010-11 at 29,522,688 students. By 2014-15, enrollment decreased to 27,386,275 students, a decline of more than 2 million students.  

In addition to producing graphical displays, data from the Trend Generator can quickly be exported to an Excel file.

Chart showing trend data on postsecondary enrollment

Users also have the option to create custom data files which can be exported to Excel, SAS, STATA, or SPSS files. Users can choose individual or specific institutions using their own criteria, or groups of similar institutions can be selected at once by using predetermined categorizations. Some pre-set groupings include whether the institution is the state’s land grant institution, a Historically Black College and University, or a tribal college. Institutional groupings can also be selected by geographic characteristics and other groupings, such as highest degree offered, availability of distance education, and Carnegie classification. The full list of institutional groupings can be found on the IPEDS website

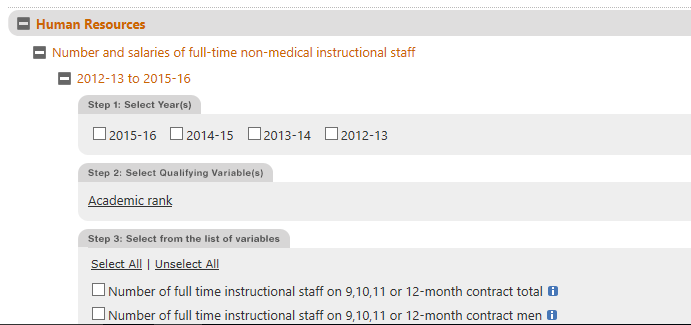
After selecting the institutions, users can choose the variables to be analyzed. In the screenshot below, you can see that the variable “number and salaries of non-medical full-time staff” allows users to select breakouts by academic rank, such as professor, associate professor, lecturer, etc. These breakouts can provide greater detail with regard to current and average salary. Once the variables are selected, the desired data file is complete and can be exported into one of the available formats.

Screenshot of IPEDS categories

The Integrated Postsecondary Education Data System contains a multitude of data which can be accessed for all levels of analysis, whether you are an experienced statistician or just a casual user. If you are using the data and have questions or comments, contact the IPEDS Help Desk by phone at 1-877-225-2568 or by email: ipedshelp@rti.org .

Sarah Souders was a 2017 summer intern for NCES. She is a student at The Ohio State University. 

[1] Title IV of the HEA authorizes the federal government’s primary student aid programs, which are the major source of federal support to postsecondary students. Title IV aid includes programs like Pell Grants, Stafford Loans, Perkins Loans, Supplemental Educational Opportunity Grants, and Federal Work Study. If an institution accepts aid from programs authorized by Title IV of the Higher Education Act of 1965, as amended (20 USC 1094, Section 487(a)(17) and 34 CFR 668.14(b)(19)), then they are required to complete all IPEDS surveys.


STATS-DC 2017: Sharing, Learning, and Tweeting

More than 900 people attended the 2017 STATS-DC Data Conference, August 1-3, at the Mayflower Hotel in Washington, DC. Sponsored by the National Center for Education Statistics (NCES), STATS-DC is an annual, free conference designed to provide the latest information, resources and training on accessing and using federal education data.

Educators, statisticians, and researchers from around the country attended the conference and many of them took to Twitter to share what they were learning and seeing. Below is a collection of those Tweets that used the #STATSDC2017 hashtag.

You can view the conference agenda and get more information about STATS-DC on the NCES website. Information about the 2018 conference should be available next spring. 


Compiled by Dana Tofig, Communications Director, IES


Student homelessness in urban, suburban, town, and rural districts

Data from two recent NCES reports—the Condition of Education and the Digest of Education Statistics—show that student homelessness is a challenge in many different types of communities.

In 2014-15, the rate of homelessness among U.S. public school students was highest in city school districts at 3.7 percent, but was also 2.0 percent or higher in suburban, town, and rural districts. While suburban districts had the lowest rate of student homelessness, they still enrolled 422,000 homeless students, second only to the 578,000 homeless students enrolled in city districts. Smaller numbers of homeless students were enrolled in rural (149,000) and town (139,000) districts.


Figure 1. Percentage of public school students who were identified as homeless, by school district locale: School year 2014–15

NOTE: Homeless students are defined as children/youth who lack a fixed, regular, and adequate nighttime residence. For more information, see "C118 - Homeless Students Enrolled" at https://www2.ed.gov/about/inits/ed/edfacts/sy-14-15-nonxml.html. Data include all homeless students enrolled at any time during the school year. Data exclude Puerto Rico and the Bureau of Indian Education.
SOURCE: U.S. Department of Education, National Center for Education Statistics, EDFacts file 118, Data Group 655, extracted January 23, 2017, from the EDFacts Data Warehouse (internal U.S. Department of Education source). Common Core of Data (CCD), "Local Education Agency Universe Survey," 2014–15. See Digest of Education Statistics 2016, table 204.75b.


The majority of students experiencing homelessness (76 percent) were doubled up or sharing housing with other families due to loss of their own housing, economic hardship, or other reasons such as domestic violence. Seven percent were in hotels or motels; 14 percent were in shelters, transitional housing or awaiting foster care placement; and 3 percent were unsheltered.

The percentage of homeless students who were doubled up with other families ranged from 70 percent in city districts to 81 percent in rural districts. The percentage of homeless students who were housed in shelters was higher in city districts than in suburban, town, and rural districts. The percentages of homeless students who were unsheltered or living in hotels and motels varied less widely across district locale categories.


Figure 2. Percentage distribution of public school students who were identified as homeless, by primary nighttime residence and school district locale: School year 2014–15

1Refers to temporarily sharing the housing of other persons due to loss of housing, economic hardship, or other reasons (such as domestic violence).
2Includes living in cars, parks, campgrounds, temporary trailers—including Federal Emergency Management Agency (FEMA) trailers—or abandoned buildings.
NOTE: Homeless students are defined as children/youth who lack a fixed, regular, and adequate nighttime residence. For more information, see "C118 - Homeless Students Enrolled" at https://www2.ed.gov/about/inits/ed/edfacts/sy-14-15-nonxml.html. Data include all homeless students enrolled at any time during the school year. Data exclude Puerto Rico and the Bureau of Indian Education. This figure is based on state-level data.
SOURCE: U.S. Department of Education, National Center for Education Statistics, EDFacts file 118, Data Group 655, extracted January 23, 2017, from the EDFacts Data Warehouse (internal U.S. Department of Education source). Common Core of Data (CCD), "Local Education Agency Universe Survey," 2014–15. See Digest of Education Statistics 2016, table 204.75b.


The percentage of homeless students who were unaccompanied youth–meaning that they were not in the physical custody of a parent or guardian—was   highest in rural districts (9.3 percent) and lowest in suburban districts (6.9 percent). The percentage of homeless students who were English language learners was highest in urban districts (16.8 percent) and lowest in rural districts (5.9 percent), and the percentage who were migrant students was highest in town districts (3.4 percent) and lowest in urban districts (1.0 percent).

Data used in this analysis were collected under the McKinney-Vento Homeless Assistance Act of 1987. This legislation requires that school districts identify students experiencing homelessness and guarantees students’ right to enroll in public schools and access educational and transportation services. More information on this legislation and the U.S. Department of Education’s programs and resources focused on student homelessness can be found on the National Center for Homeless Education’s website.

States report aggregated data on homeless students to the U.S. Department of Education through the EDFacts collection. EDFacts covers all public school districts and provides a uniquely detailed view of student homelessness. The full data on student homelessness by school district locale is available in the Digest of Education Statistics. A broader analysis in the Condition of Education describes how student homelessness has changed over time and how it varies among states. You can view homeless student data for the 120 largest school districts here and download a dataset with information on all public school districts here.


Risk Factors and Academic Outcomes in Kindergarten through Third Grade

By Amy Rathbun, AIR and Joel McFarland

Previous NCES research has shown that students with family risk factors tend to have lower average scores than their peers on academic assessments.[1] Risk factors can include coming from a low-income family or single-parent household, not having a parent who completed high school, and living in a household where the primary language is not English. How common is it for children entering U.S. kindergartens to have certain types of family risk factors? And, how do children with risk factors at kindergarten entry perform on academic assessments compared to their peers?  A new spotlight from The Condition of Education 2017 helps to answer these questions.

The spotlight focuses on children experiencing two types of risk factors - living in poverty (i.e., in households with income below the federal poverty threshold) and not having a parent who completed high school, as well as the combination and lack of the two risk factors. Data come from the Early Childhood Longitudinal Study, Kindergarten Class of 2010–11 (ECLS-K:2011). During the 2010–11 school year, 6 percent of first-time kindergartners had both risk factors , 18 percent had the single risk factor of living in poverty, and 2 percent had the single risk factor of not having a parent who completed high school. About 75 percent had neither of these two risk factors present during their kindergarten year.


Percentage distribution of fall 2010 first-time kindergartners, by risk factors related to parent education and poverty: School year 2010–11

NOTE: Detail may not sum to totals because of rounding.
SOURCE: U.S. Department of Education, National Center for Education Statistics, Early Childhood Longitudinal Study, Kindergarten Class of 2010–11 (ECLS-K:2011), Kindergarten–Third Grade Restricted-Use Data File. See Digest of Education Statistics 2016, table 220.39.


Are there differences in the prevalence of risk factors by student and family characteristics?

There were differences in the prevalence of family risk factors in relation to children’s race/ethnicity, primary home language, and family composition. For instance, it was more common for Hispanic students (15 percent) than for Black and Asian students (8 percent each) to have both risk factors, and these percentages were all higher than the percentage for White students (1 percent). Also, 23 percent of first-time kindergartners whose primary home language was not English had both the risk factor of living in poverty and the risk factor of not having a parent who completed high school, compared with 2 percent of kindergartners whose primary home language was English.

Does children’s performance in reading, math, and science in kindergarten through third grade differ based on risk factors?

Kindergarten students living in poverty and those with no parent that completed high school tended to score lower in reading, mathematics, and science over each of their first four years of school compared to their peers who had neither risk factor at kindergarten entry. For example, in the spring of third-grade, reading scores (on a scale of 0 to 141) were higher, on average, for students who had neither risk factor (114 points) than for those with the single risk factor of living in poverty (106 points), those with the single risk factor of not having a parent who completed high school (105 points), and those with both risk factors (102 points).[2]


Average reading scale scores of fall 2010 first-time kindergartners, by time of assessment and risk factors related to parent education and poverty: Fall 2010 through spring 2014

NOTE: Estimates weighted by W7C17P_7T170. Scores on the reading assessments reflect performance on questions measuring basic skills (print familiarity, letter recognition, beginning and ending sounds, rhyming words, and word recognition); vocabulary knowledge; and reading comprehension, including identifying information specifically stated in text (e.g., definitions, facts, and supporting details), making complex inferences from texts, and considering the text objectively and judging its appropriateness and quality. Possible scores for the reading assessment range from 0 to 141.
SOURCE: U.S. Department of Education, National Center for Education Statistics, Early Childhood Longitudinal Study, Kindergarten Class of 2010–11 (ECLS-K:2011), Kindergarten–Third Grade Restricted-Use Data File. See Digest of Education Statistics 2016, table 220.40.


For more information on family risk factors and children’s achievement in reading, mathematics, and science from the fall of kindergarten through the spring of third grade, see the spotlight on this topic in The Condition of Education 2017.

[1] Given that the spring third-grade reading scores have a mean of 110.2 points and a standard deviation (SD) of 12.3 points, this would mean the average score for children who had no risk factors was about 1.0 SD higher than the score for children with no risk factors.

[2] Rathbun, A., and West, J. (2004). From Kindergarten Through Third Grade: Children's Beginning School Experiences (NCES 2004–007). U.S. Department of Education. Washington, DC: National Center for Education Statistics. Retrieved March 2, 2017, from https://nces.ed.gov/pubsearch/pubsinfo.asp?pubid=2004007.