IES Blog

Institute of Education Sciences

Behind the degree: Direct measures of cognitive skills or reports of highest degree earned

By Heidi Silver-Pacuilla

Categories of educational attainment – or highest degree earned – are often used in social science research as an indicator of a person’s knowledge and skills. This measure is objective and readily available, easily understood by survey respondents as well as by consumers of research and survey data, strongly tied to policies (such as those promoting high school graduation and college completion rates), and widely used in the labor market by employers. Moreover, strong connections between educational attainment and positive life outcomes, such as employment, earnings, health, and civic engagement, are well established.

Yet, this measure is an imprecise indicator of the amount of knowledge and skills an individual acquired during the years of education it took to complete the degree. It also masks variation across individuals and programs of study. In addition, adults continue to acquire skills and knowledge from a variety of sources and activities over their lifetimes after completing a degree, while on the job or through employer-sponsored training, continuing education, family and household management, hobbies and interests, etc. Adults also lose fluency with skills that are not put to regular use.

The Program for the International Assessment of Adult Competencies (PIAAC) survey[i] provides direct measures of working-age adults’ cognitive skills based on their performance on literacy, numeracy, and problem-solving tasks set in real-life contexts. Performance is reported on a scale of 1-5 for literacy and numeracy and a scale of 1-3 for problem solving. It pairs these measures with a background questionnaire that asks about the use of skills at work and in daily life, work history, and other social, behavioral, and demographic indicators.


Percentage of adults age 16 to 65 at each level of proficiency on the PIAAC literacy scale, by highest level of educational attainment: 2012Percentage of adults age 16 to 65 at each level of proficiency on the PIAAC literacy scale, by highest level of educational attainment: 2012

# Rounds to zero
NOTE: Percentages of adults age 16 to 65 by highest level of educational attainment appear in parentheses. Detail may not sum to totals because of rounding.
SOURCE: U.S. Department of Education, National Center for Education Statistics, Organization for Economic Cooperation and Development (OECD), Program for the International Assessment of Adult Competencies (PIAAC), 2012.


The direct measures of cognitive skills offer researchers the ability to study actual skills rather than only using attainment of a particular degree as a general indicator of skills, and to investigate how those assessed skills relate to behaviors and life outcomes. To illustrate how directly measured skills and educational attainment are not always aligned, we can compare direct performance to highest degrees earned. In the United States, of all adults who have attained only a high school degree, 20% performed in the lowest levels (Level 1 and Below Level 1) of literacy, while 7% of adults with an associate’s degree and 5% of those with a bachelor’s degree performed at this level. At the same time, the results showed that 6% of adults with no more than a high school diploma, 14% with only an associate’s degree, and 24% with a bachelor’s degree have very high literacy skills, at Level 4 or 5 on the same scale. See the full range of educational attainment and skill performance in literacy in the chart above.

Findings such as this can help inform policy, interventions, and communication strategies to better meet the needs of the recipients.

To read more about direct measures versus educational attainment, see Chapter 8 of the OECD Survey of Adult Skills – Reader's Companion.


[i] The PIAAC survey is coordinated internationally by the OECD. NCES implements PIAAC in the United States. Results were first released in October 2013 with data from 23 countries. It is a household survey administered by trained data collectors to a nationally-representative sample of adults, ages 16 through 65, in each country, in the official language(s), and in most cases, in respondents’ homes on a laptop computer.

In the United States, the survey was first administered in 2012 and additional results, based on an expanded sample, will be released in 2015-2016. To learn more about the U.S. administration and reporting of the survey, as well as related data tools, see https://nces.ed.gov/surveys/piaac/.  

Announcing the National Teacher and Principal Survey (NTPS): Redesigning a key data collection effort

By Amy Ho and Chelsea Owens

Teachers and principals form the foundation of the educational process, but there are not a lot of nationally representative, federal data on the characteristics and experiences of these key staff. The Schools and Staffing Survey (SASS) has historically been one of the few federal data collections in this area. Since 1987, SASS has provided important data to researchers, policymakers, and leaders in education to help answer critical questions about schools, teachers, principals, and students, including:

  • How well prepared and supported are new teachers?
  • What do principals consider as their most important goal?
  • Have the characteristics of the principal and teacher workforces changed over time?

As one of the few large scale data collection efforts that directly surveys teachers and principals about their own experiences, SASS has historically served as the nation’s primary data source for information on topics such as teachers’ and principals’ demographic characteristics, teachers’ attitudes about teaching and school conditions, teachers’ qualifications, and teachers’ experiences with intimidation or violence in schools.

While the information obtained from SASS has been an important contribution to our knowledge of the experiences of teachers and principals, changes to the structure of teaching and the desire to better align multiple data collection efforts led NCES to revise the existing SASS instrument. Therefore, NCES launched a redesign of this data collection effort. The new survey, the National Teacher and Principal Survey (NTPS) includes updated features such as revised questions that can address pressing topics in the field (e.g., use of technology in the classroom, teacher and principal evaluations, etc.).

The NTPS will be administered for the first time this coming school year (2015-16) and will be conducted every two years in order to provide timely data. There are four main components of the NTPS: School Questionnaire, Principal Questionnaire, Teacher Listing Form, and Teacher Questionnaire. In late August, NCES sent out the first questionnaires to a sample of American schools. A school selected to participate in the NTPS will represent thousands of other schools in the nation.

The School Questionnaire asks about length of the school day, how difficult it is to fill vacancies at the school, and community-service graduation requirements. The Principal Questionnaire asks questions on parent/guardian involvement, how often problems such as bullying and gang activities occur, how teachers and principals are evaluated, and principals’ top goals. The Teacher Questionnaire includes questions involving teacher satisfaction, use of instructional software in the classroom, teacher perceptions of autonomy, and experiences during teachers’ first year of teaching.

The participation of teachers, principals, and other staff in the 2015-16 NTPS will greatly help policymakers and leaders in education improve schools for our students, teachers, and principals by looking at the current status of these issues.  In the United States, the needs and challenges facing each school are sometimes vastly different, but the NTPS data can provide information for meeting these needs.

For more information on NTPS, please visit: http://nces.ed.gov/surveys/ntps/overview.asp.


IES Honors Statistician Nathan VanHoudnos as Outstanding Predoctoral Fellow

By Phill Gagne and Katina Stapleton, NCER Program Officers

Each year, IES recognizes an outstanding fellow from its Predoctoral Interdisciplinary Research Training Programs in the Education Sciences for academic accomplishments and contributions to education research. The 2014 winner, Dr. Nathan VanHoudnos completed his Ph.D. at Carnegie Mellon University and wrote his dissertation on the efficacy of the Hedges Correction for unmodeled clustering. Nathan is currently a postdoctoral fellow at Northwestern University. In this blog, Nathan provides insights on becoming an education researcher and on research study design. 

How did you become interested in education research?

I was born into it. Before he retired, my father was the Director of Research for the Illinois Education Association. Additionally, my grandparents on my mother's side were both teachers. 


As a statistician, how do you explain the relevance of your research to education practitioners and policy-makers?

I appeal to the crucial role biostatisticians play in the progress of medical research. Doctors and medical researchers are able to devote their entire intellectual capacity towards the development of new treatments, while biostatisticians are able to think deeply about both how to test these treatments empirically and how to combine the results of many such studies into actionable recommendations for practitioners and policy makers.  I aim to be the education sciences analogue of a biostatistician. Specifically, someone whose career success is decided on (i) the technical merits of the new methodology I have developed and (ii) the usefulness of my new methodology to the field. 

Your research on the Hedges correction suggests that many education researchers mis-specify their analyses for clustered designs. What advice would you give researchers on selecting the right analyses for clustered designs? 

My advice is to focus on the design of the study. If the design is wrong, then the analysis that matches the design will fail, and it is likely that no re-analysis of the collected data will be able to recover from the initial mistake. For example, a common design error is randomizing teachers to experimental conditions, but then assuming that how the school registrar assigned students to classes was equivalent to the experimenter randomizing students to classes. This assumption is false. Registrar based student assignment is a kind of group based, or clustered, random assignment. If this error is not caught at the design stage, the study will necessarily be under powered because the sample size calculations will be off. If the error is not caught at the publication stage, the hypothesis test for the treatment effect will be anti-conservative, i.e. even if the treatment effect is truly zero, the test statistic is still likely to be (incorrectly!) statistically significant. The error will, however, be caught if the What Works Clearinghouse decides to review the study. Their application of the Hedges correction, however, will not fix the design problem. The corrected test statistic will, at best, have low power, just like a re-analysis of the data would. At worst, the corrected test statistic can have nearly zero power. There is no escape from a design error. 


To give a bit of further, perhaps self-serving advice, I would also suggest engaging your local statistician as a collaborator. People like me are always looking to get involved in substantively interesting projects, especially if we can get involved at the planning stage of the project. Additionally, this division of labor is often better for everyone: the statistician gets to focus on interesting methodological challenges and the education researcher gets to focus on the substantive portion of the research. 

How has being an IES predoc and now an IES postdoc helped your development as a researcher?

This is a bit like the joke where one fish asks another "How is the water today?" The other fish responds "What's water?" 

I came to Carnegie Mellon for the joint Ph.D. in Statistics and Public Policy, in part, because the IES predoc program there, the Program for Interdisciplinary Education Research (PIER), would both fund me to become and train me to become an education researcher. The PIER program shaped my entire graduate career. David Klahr (PIER Director) gave me grounding in the education sciences. Brian Junker (PIER Steering committee) taught me how to be both methodologically rigorous and yet still accessible to applied researchers. Sharon Carver (PIER co-Director), who runs the CMU lab school, built in a formal reflection process for the "Field Base Experience" portion of our PIER training. That essay, was, perhaps, the most cathartic thing I have ever written in that it helped to set me on my career path as a statistician who aims to focus on education research. Joel Greenhouse (affiliated PIER faculty), who is himself a biostatistician, chaired my thesis committee. It was his example that refined the direction of my career: I wish to be the education sciences analogue of a biostatistician. 

The IES postdoc program at Northwestern University, where I am advised by Larry Hedges, has been very different. Postdoctoral training is necessarily quite different from graduate school. One thread is common, however, the methodology I develop must be useful to applied education researchers. Larry is, as one might suppose, quite good at focusing my attention on where I need to make technical improvements to my work, but also how I might better communicate my technical results and make them accessible to applied researchers. After only a year at Northwestern, I have grown considerably in both my technical and communication skills.

What career advice would you give to young researchers?

Pick good mentors and heed their advice. To the extent that I am successful, I credit the advice and training of my mentors at Carnegie Mellon and Northwestern. 


Comments? Questions? Please write to us at IESResearch@ed.gov.

What is the Price of College?

By Lauren Musu-Gillette

For many students and their families, a college education is seen as an investment in the future. But like all investments, the initial sacrifices can seem burdensome and the future is uncertain. NCES seeks to help students and their families make good decisions by providing access to timely information about the price of college and the availability of financial aid. The NCES College Navigator web site provides an array of search tools to help students locate institutions that meet their financial needs and academic interests. Additionally, the Higher Education Opportunity Act of 2008 requires the U.S. Department of Education to report  current information and recent changes in net prices for college attendance, and tuition and fees charges at different types of institutions. Data on high and low cost institutions are published on the College Affordability and Transparency Center website. These sites can help students and their families make informed decisions about their most affordable options.

NCES recently released a report that examines the total, net, and out-of-pocket prices by type of institution in 2011-12. Although it is presented for institutions at an aggregate level, rather than for individual institutions, this report provides valuable information on the average prices for different types of degree-granting colleges, including breakdowns for students from families with different income levels. Overall, students at public 2-year colleges had the lowest average total price of attendance in 2011-12 at $15,000. Public 4-year institutions had the lowest average total price ($23,200) among 4-year colleges, and the average price of attendance at 4-year for-profit institutions was $29,300.  The average total price was highest at private non-profit 4-year institutions ($43,500); however, 4-year private nonprofit schools also awarded the most grant money and had the greatest percentage of students who received grants.

Factoring in financial aid, such as grants, loans, and work study, reduces the out-of-pocket costs that students and their families pay at various institutions. As a result, many full-time students pay less than the advertised total price of attendance. The out-of-pocket net price of attendance is based on the total price of attendance, but also accounts for the amount of grant and loan aid that students typically receive. Additionally, because many sources of aid are based on students’ financial need, there are differences in the out-of-pocket net price of attendance for dependent students from lower and higher income families. 

Overall, students at public 2-year colleges had the lowest out-of-pocket net price (after grants and loans) at $9,900 in 2011-12. The average out-of-pocket net price was $11,800 at public 4-year institutions and $15,000 at for-profit institutions. The largest difference between total price of attendance and out-of-pocket net price was at private nonprofit 4-year institutions, with the out-of-pocket net price ($18,100) being about $25,400 less than the average total price.  

Across all types of institutions, dependent students from lower income families (the lowest quarter of family incomes) had the lowest out-of-pocket net price. The average out-of-pocket net price for students from lower income families was $7,500 at public 2-year institutions, $7,100 at public 4-year institutions, $11,000 at private nonprofit institutions, and $15,000 at private for-profit institutions. In contrast, students from families in the top quarter of incomes had average out-of-pocket costs of $13,100 at public 2-year institutions, $16,800 at public 4-year institutions, $26,600 at private nonprofit institutions, and $22,300 at private for-profit institutions.

For more information on the total, net, and out-of-pocket prices by type of institution, please download the entire report: What is the Price of College: Total, Net, and Out-of-Pocket Prices by Type of Institution in 2011-12, or watch the video below.

Where Are They Now? A Q&A With the Creators of EcoMUVE – A Virtual Environment for Middle School Science

Where Are They Now? showcases completed IES research projects. The feature describes the IES project and research findings, and updates the progress since IES project completion.

By Ed Metz, NCER Program Officer

In this inaugural Where Are They Now? feature, we take a look back at a 2008 grant to researchers at Harvard University for the development of EcoMUVE.

EcoMUVE uses Multi-User Virtual Environments (MUVEs), which have the look and feel of video games, to help middle school students gain a deeper understanding of ecosystems, scientific inquiry, and causal patterns. The MUVEs recreate authentic ecological settings within which students explore and collect information. Students work individually at their computers and collaborate in teams within the virtual world. EcoMUVE includes two modules, Pond and Forest; each module is a two-week inquiry-based ecosystems curriculum. EcoMUVE received the First Place award in the Interactive and Immersive Learning Category at the 2011 Association for Educational Communications and Technology conference, and has received follow-on support from the National Science Foundation and Qualcomm Wireless. 

In this blog, we catch up with two of the researchers who led the development of EcoMUVE, Chris Dede and Shari Metcalf, to look back at their IES project and to learn about recent developments.

How and when did the idea to develop a virtual environment for science learning come about?

Chris Dede’s prior research with the River City project looked at supporting student inquiry using immersive exploration in a virtual world. Meanwhile, Harvard Professor Tina Grotzer was developing ways to support students in understanding complex causality in ecosystems. They worked together on a grant proposal to IES to combine their interests.

How does a virtual environment provide meaningful learning opportunities that otherwise might not be possible?

Ecosystems are complex systems shaped by relationships that often happen at microscopic levels, at a distance, and over long periods of time. Immersion in virtual environments can transform the learning experience by situating the learner in a rich simulated context in which new visualization opportunities are possible – e.g., zooming in to the microscopic level, or traveling to different points in time.

Students start to get a feel for the ecosystem and its relationships through tacit sensory clues. It is an uphill walk from the pond to the housing development, and students can walk down along a drainage ditch and through the pipe where runoff flows into the pond. The pond becomes noticeably greenish during the algae bloom. 

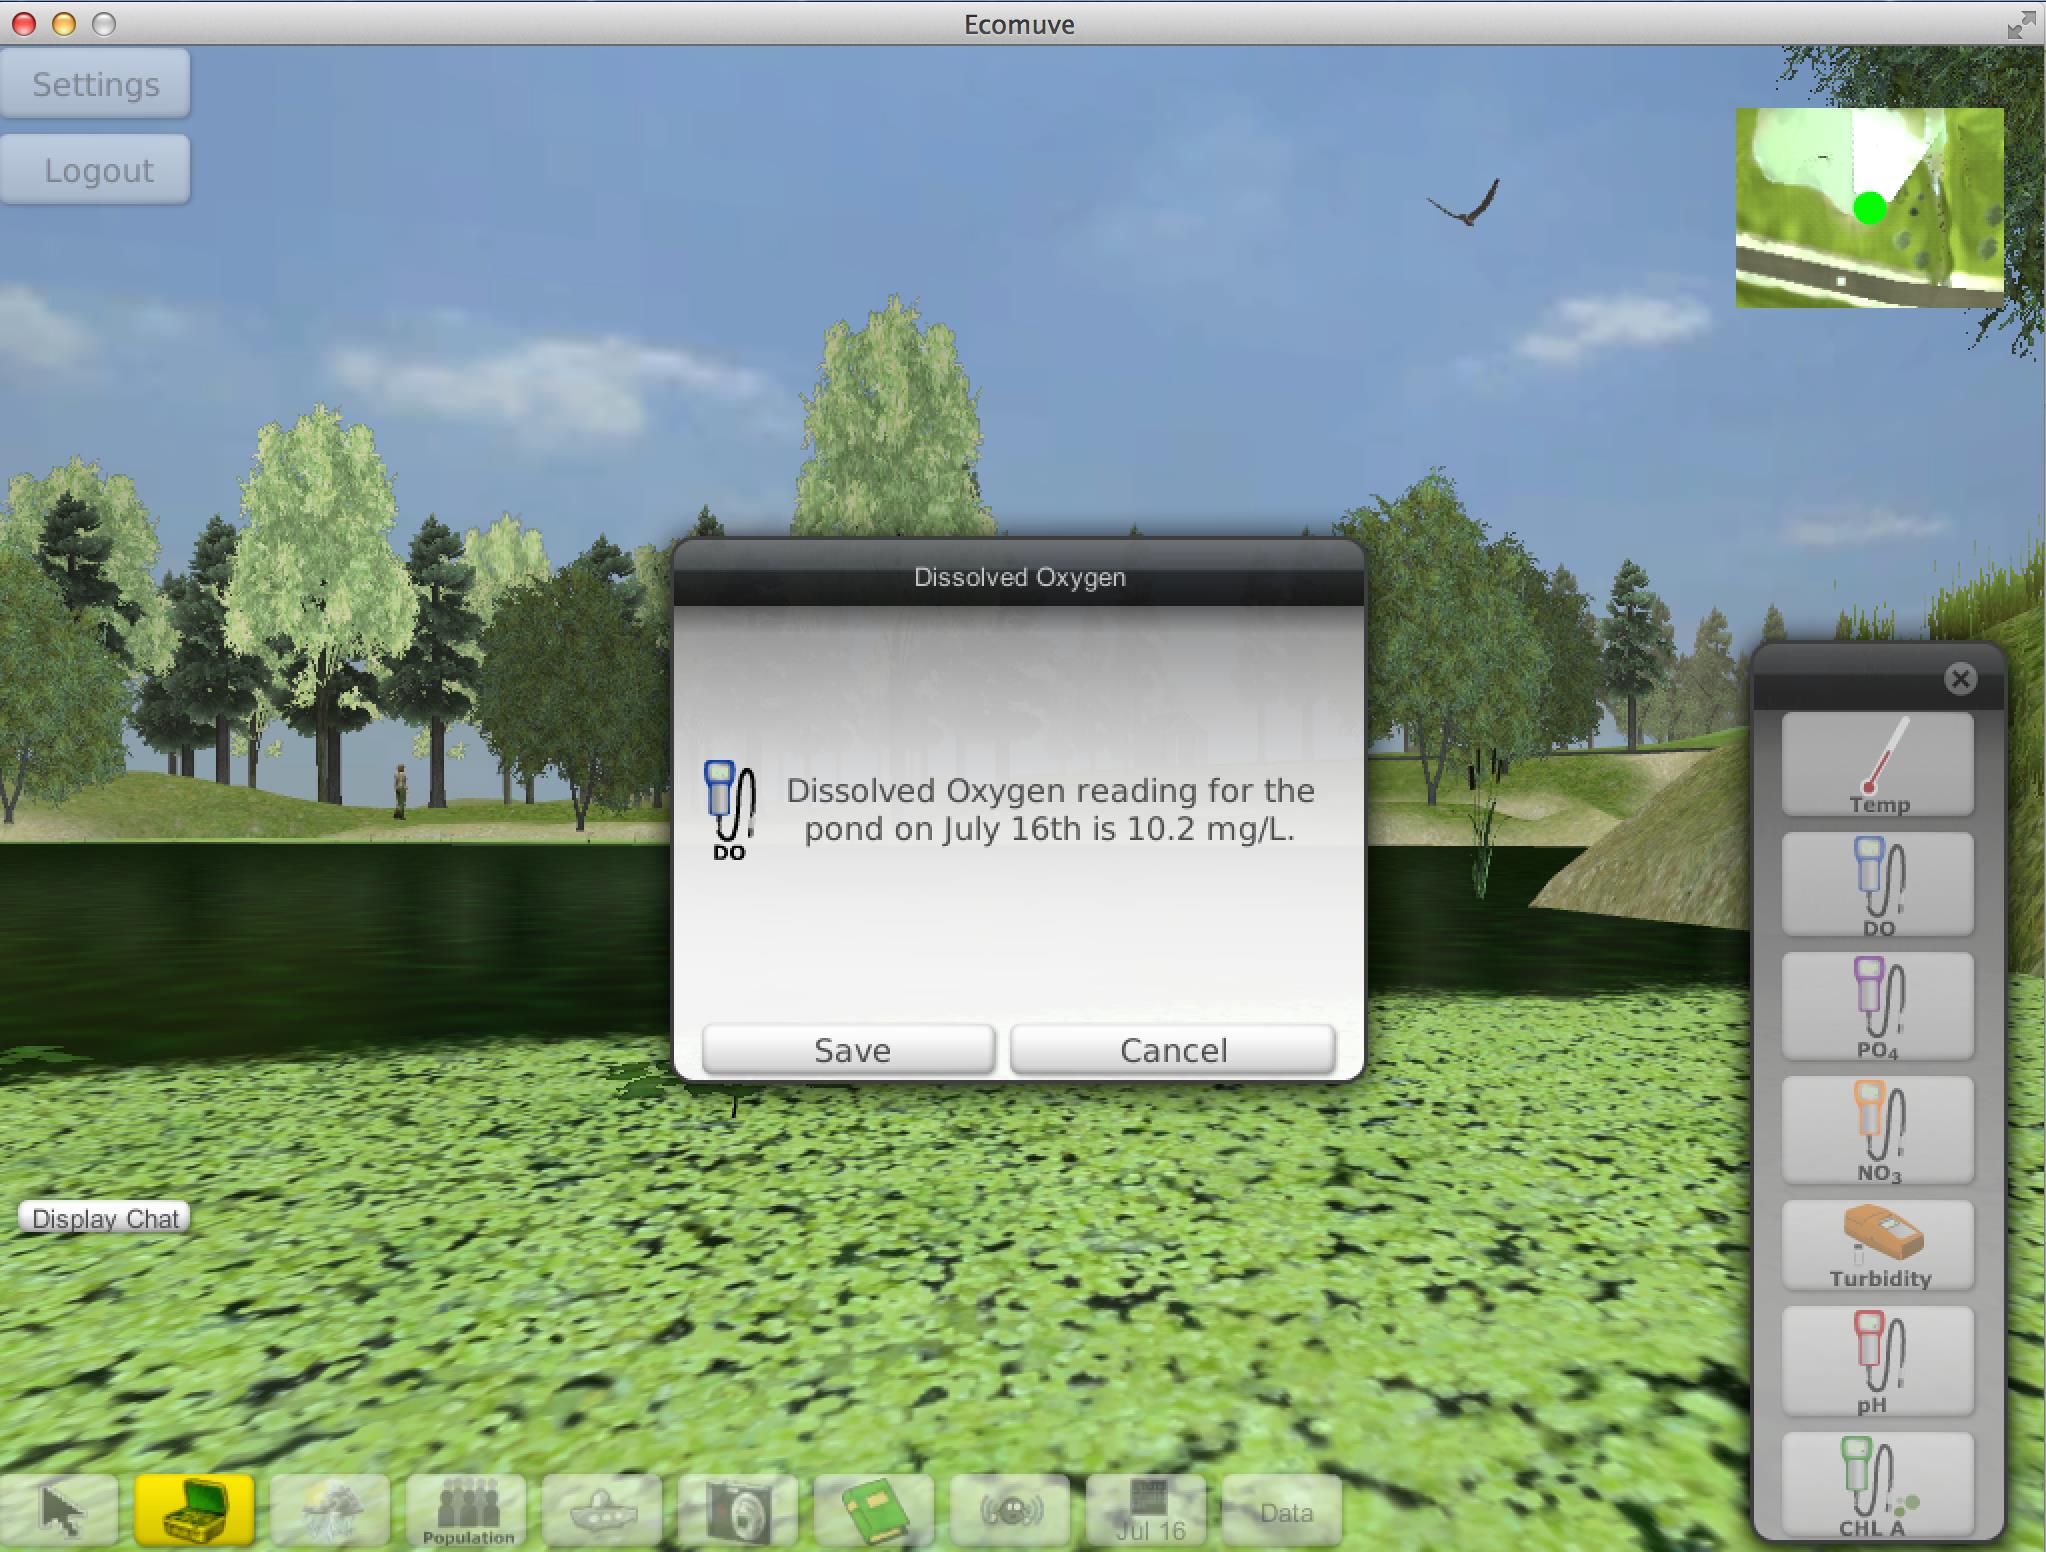
Students can experience turbidity directly by walking under the water of the pond and seeing how murky it looks on different days.


What was an unexpected outcome of the development process?

The types of “big data” about motivation and learning for each student that EcoMUVE can generate include: time-stamped logfiles of movements and interactions in the virtual world, chat-logs of utterances, and tables of data collected and shared. Other digital tools can provide data from concept maps that chart the flow of energy through the ecosystem and that document each student team’s assertions about its systemic causal relationships, with adduced supporting evidence. Using Go-Pro cameras, students’ collaborative behaviors outside of digital media can be documented. We would like to use this data to provide near-real time feedback to students and teacher, through various forms of visualization.

What were your main research findings from the IES development project?

After using EcoMUVE, students showed gains in learning of science content, and also improvements in their attitudes towards science, particularly in the beliefs they were capable and interested in being scientists. Teachers felt that the curriculum was feasible, well-aligned with standards, and supported student engagement and learning of science content, complex causality, and inquiry, and had multiple advantages over a similar non-MUVE curriculum. A study that looked at student motivation found that, while at first students were most enthusiastic about the 3D virtual world and game-like environment, over time their engagement centered on the inquiry-based pedagogy and the collaborative problem-solving.  Gains were also found in students’ complex causal reasoning about non-obvious causes; distant drivers of ecosystems dynamics and the system parameters; and processes, steady states and change over time.

How has the EcoMUVE project proceeded in recent years since the IES research project ended?  

Beginning in May, 2012, we’ve been pleased to be able to offer a standalone version of the EcoMUVE software for download through a free license from Harvard University. As of January, 2015, over 1,200 users have registered with the website. The EcoMUVE project receives e-mail inquiries almost every week from educators who are interested in the curriculum. In some cases, whole districts have adopted the EcoMUVE curriculum, including Cambridge, MA, and Peoria, AZ.

Internationally, researchers at the University of Hong Kong have been working with Harvard University to use EcoMUVE for professional development, to help teachers understand how to use scientific investigations as learning activities for students. Other collaborators include Sydney University, and Aalborg University in Copenhagen.

Looking ahead, what does the future hold for EcoMUVE?

We continue to make EcoMUVE available for download from our new website, http://ecolearn.gse.harvard.edu. We have been extending our research to develop EcoMOBILE, an extension of the EcoMUVE curriculum that blends immersive virtual environments with the use of mobile technologies during field trips to real ecosystems for observations and data collection. EcoMOBILE is funded by the National Science Foundation (NSF) and Qualcomm’s Wireless Reach Initiative. We have also just started a new research project, EcoXPT, also funded through NSF, designed to work alongside EcoMUVE to support experiment-based inquiry in immersive virtual environments.

Questions? Comments? Please send them to us at IESResearch@ed.gov.

About the Interviewees

Shari J. Metcalf is Project Director of the EcoMUVE project at the Harvard Graduate School of Education. She holds SB and SM degrees from MIT, and a PhD from the University of Michigan, where she designed and developed Model-It, a software tool for students building models of dynamic systems. Her professional focus is the design of educational software tools, and in particular on using modeling, simulation, and virtual immersive environments to support inquiry-based science learning.

Chris Dede is the Timothy E. Wirth Professor in Learning Technologies at Harvard’s Graduate School of Education.  Chris was the Principal Investigator of the EcoMUVE project. His fields of scholarship include emerging technologies, policy, and leadership.  His research includes grants from NSF, IES, and the Gates Foundation to design and study immersive simulations, transformed social interactions, and online professional development.