This analysis is the first in a of series of analyses of the public state and local education industry3 during the 2021–22 school year. This industry includes all persons employed by public elementary and secondary school systems and postsecondary institutions, including a variety of occupations, such as teachers and instructional aides, administrators and other professional staff, support staff, maintenance personnel, cafeteria workers, and transportation workers.4 The JOLTS data are tabulated at this sector level and do not permit separate detailed analyses at the elementary and secondary level or at the postsecondary level. To put the scope of this group in context, 48 percent of the staff employed by public elementary and secondary school systems were teachers, and 37 percent of full-time-equivalent (FTE) postsecondary staff within public degree-granting institutions were instructional faculty in 2019.5
This snapshot is focused on the December 2021 reporting period. To provide context for this period, estimates will be compared with the previous month’s estimates, as well as with December 2019 (before the pandemic) and December 2020. Subsequent analysis will review the cumulative change from July 2021 through June 2022.
The number of job openings in public state and local education was 320,000 on the last business day of December 2021, which was higher than in December 2019 or December 2020 (table 1). In percentage terms, 2.9 percent of jobs had openings in December 2021, which was higher than 2.0 percent in December 2019 and 1.9 percent in December 2020. This suggests a greater need for public state and local education employees in December 2021 than in December 2019 or December 2020. Additionally, the number of separations6 (126,000) in December 2021 exceeded the total number of hires (91,000), indicating a net decrease in the number of public state and local education employees from the number in the month before. The number of job openings at the end of December 2021 (320,000) was 3.5 times larger than the number of staff actually hired that month (91,000). This December 2021 ratio of openings to hires was higher than the ratio in December 2020 (2.9) and the ratio in December 2019 (2.6).
Hiring in the education sector happens on a cyclical basis with the academic calendar, meaning that patterns will differ between months.7 November 2021 data are also provided in table 1 to provide a sense of the month-to-month change in employment data. In November 2021, the number of job openings outpaced the number of hires by a margin of 167,000 positions, representing a ratio of job openings to hires of 2.3.
Table 1. Public state and local education job openings, hires, and separations: 2019, 2020, and 2021
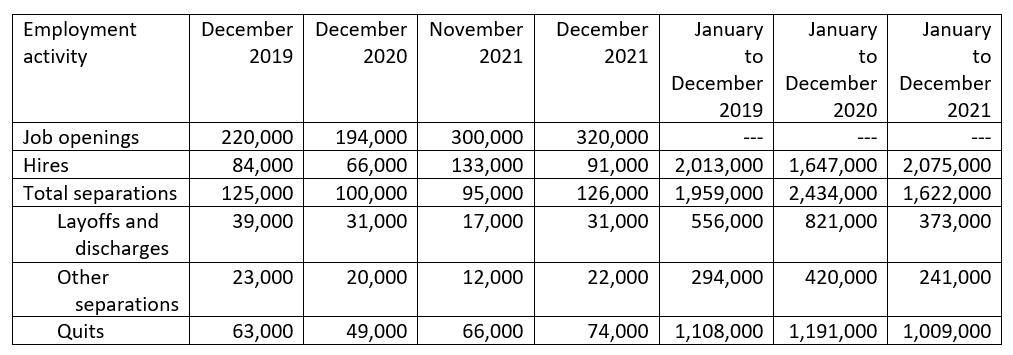
---Not available.
NOTE: Data are not seasonally adjusted. Detail may not sum to totals because of rounding.
SOURCE: U.S. Department of Labor, Bureau of Labor Statistics, Job Openings and Labor Turnover Survey (JOLTS), 2019, 2020, and 2021, based on data downloaded March 15, 2022.
Net Change in Employment
JOLTS data show the relationships of hires and separations throughout business cycles. Net employment changes result from the relationship between hires and separations. When the number of hires exceeds the number of separations, employment rises—even if the number of hires is steady or declining. Conversely, when the number of hires is less than the number of separations, employment declines—even if the number of hires is steady or rising. During the 2021 calendar year, hires for state and local education totaled 2,075,000. The number of separations was estimated at 1,622,000 (including 1,009,000 quits). Taken together, the public state and local education sector in 2021 experienced a net employment gain of 453,000. In contrast, there was a net employment loss of 787,000 in 2020, resulting from 1,647,000 hires and 2,434,000 separations. These totals include workers who may have been hired and separated more than once during the year. Annual net gains and losses indicate the importance of being able to consider multiple years of data when studying the overall staffing situation in our education system. The net employment gain in 2021 does not erase the larger net loss experienced in 2020.
Figure 1 shows the cyclical nature of state and local government education employee job openings, hires, and separations. The percentages in the figure reflect the number of job openings, hires, and separations during the month relative to the total employment in the state and local government education industry. In general, separations and hiring are higher in the summer and lower in the winter. Both trends reflect the school fiscal year (July through June).
Figure 1. Monthly percentage of job openings, hires, and separations for the state and local government education industry: January 2019 to December 2021
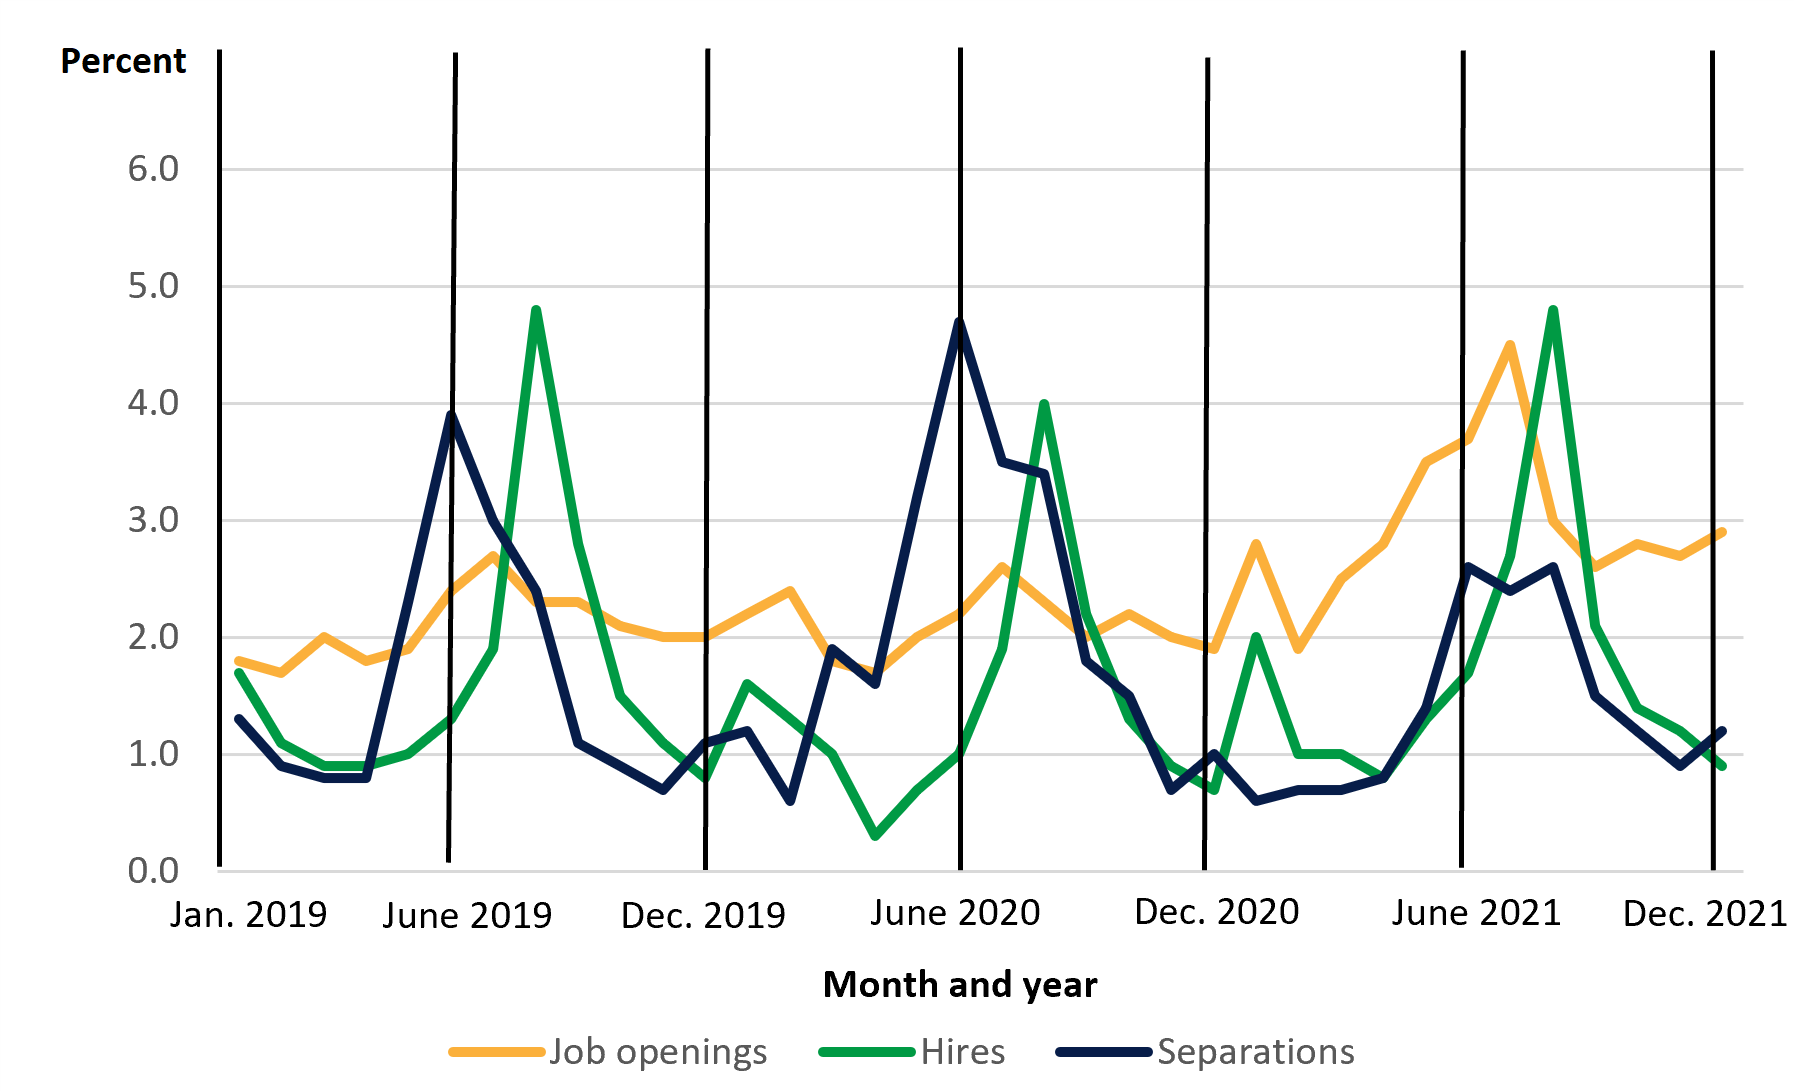
NOTE: Data are not seasonally adjusted.
SOURCE: U.S. Department of Labor, Bureau of Labor Statistics, Job Openings and Labor Turnover Survey (JOLTS), 2019, 2020, and 2021, based on data downloaded March 15, 2022.
Public State and Local Education Job Openings
Figure 2 shows the job openings in December 2021 compared with those in December 2019 and December 2020 across different industries. Overall, the total nonfarm job opening rate was 6.4 percent in December 2021, which was an increase of 2.3 percentage points over the rate in December 2020. The percentage of public state and local education sector jobs with openings was 2.9 percent (320,000) in December 2021, which was higher than the 2.0 percent (220,000) in December 2019 or 1.9 percent (194,000) in December 2020. The percentage of public state and local education sector job openings in December 2021 was not measurably different from the percentage in November 2021.
Figure 2. Rate of job openings, by major industry: December 2019, December 2020, and December 2021
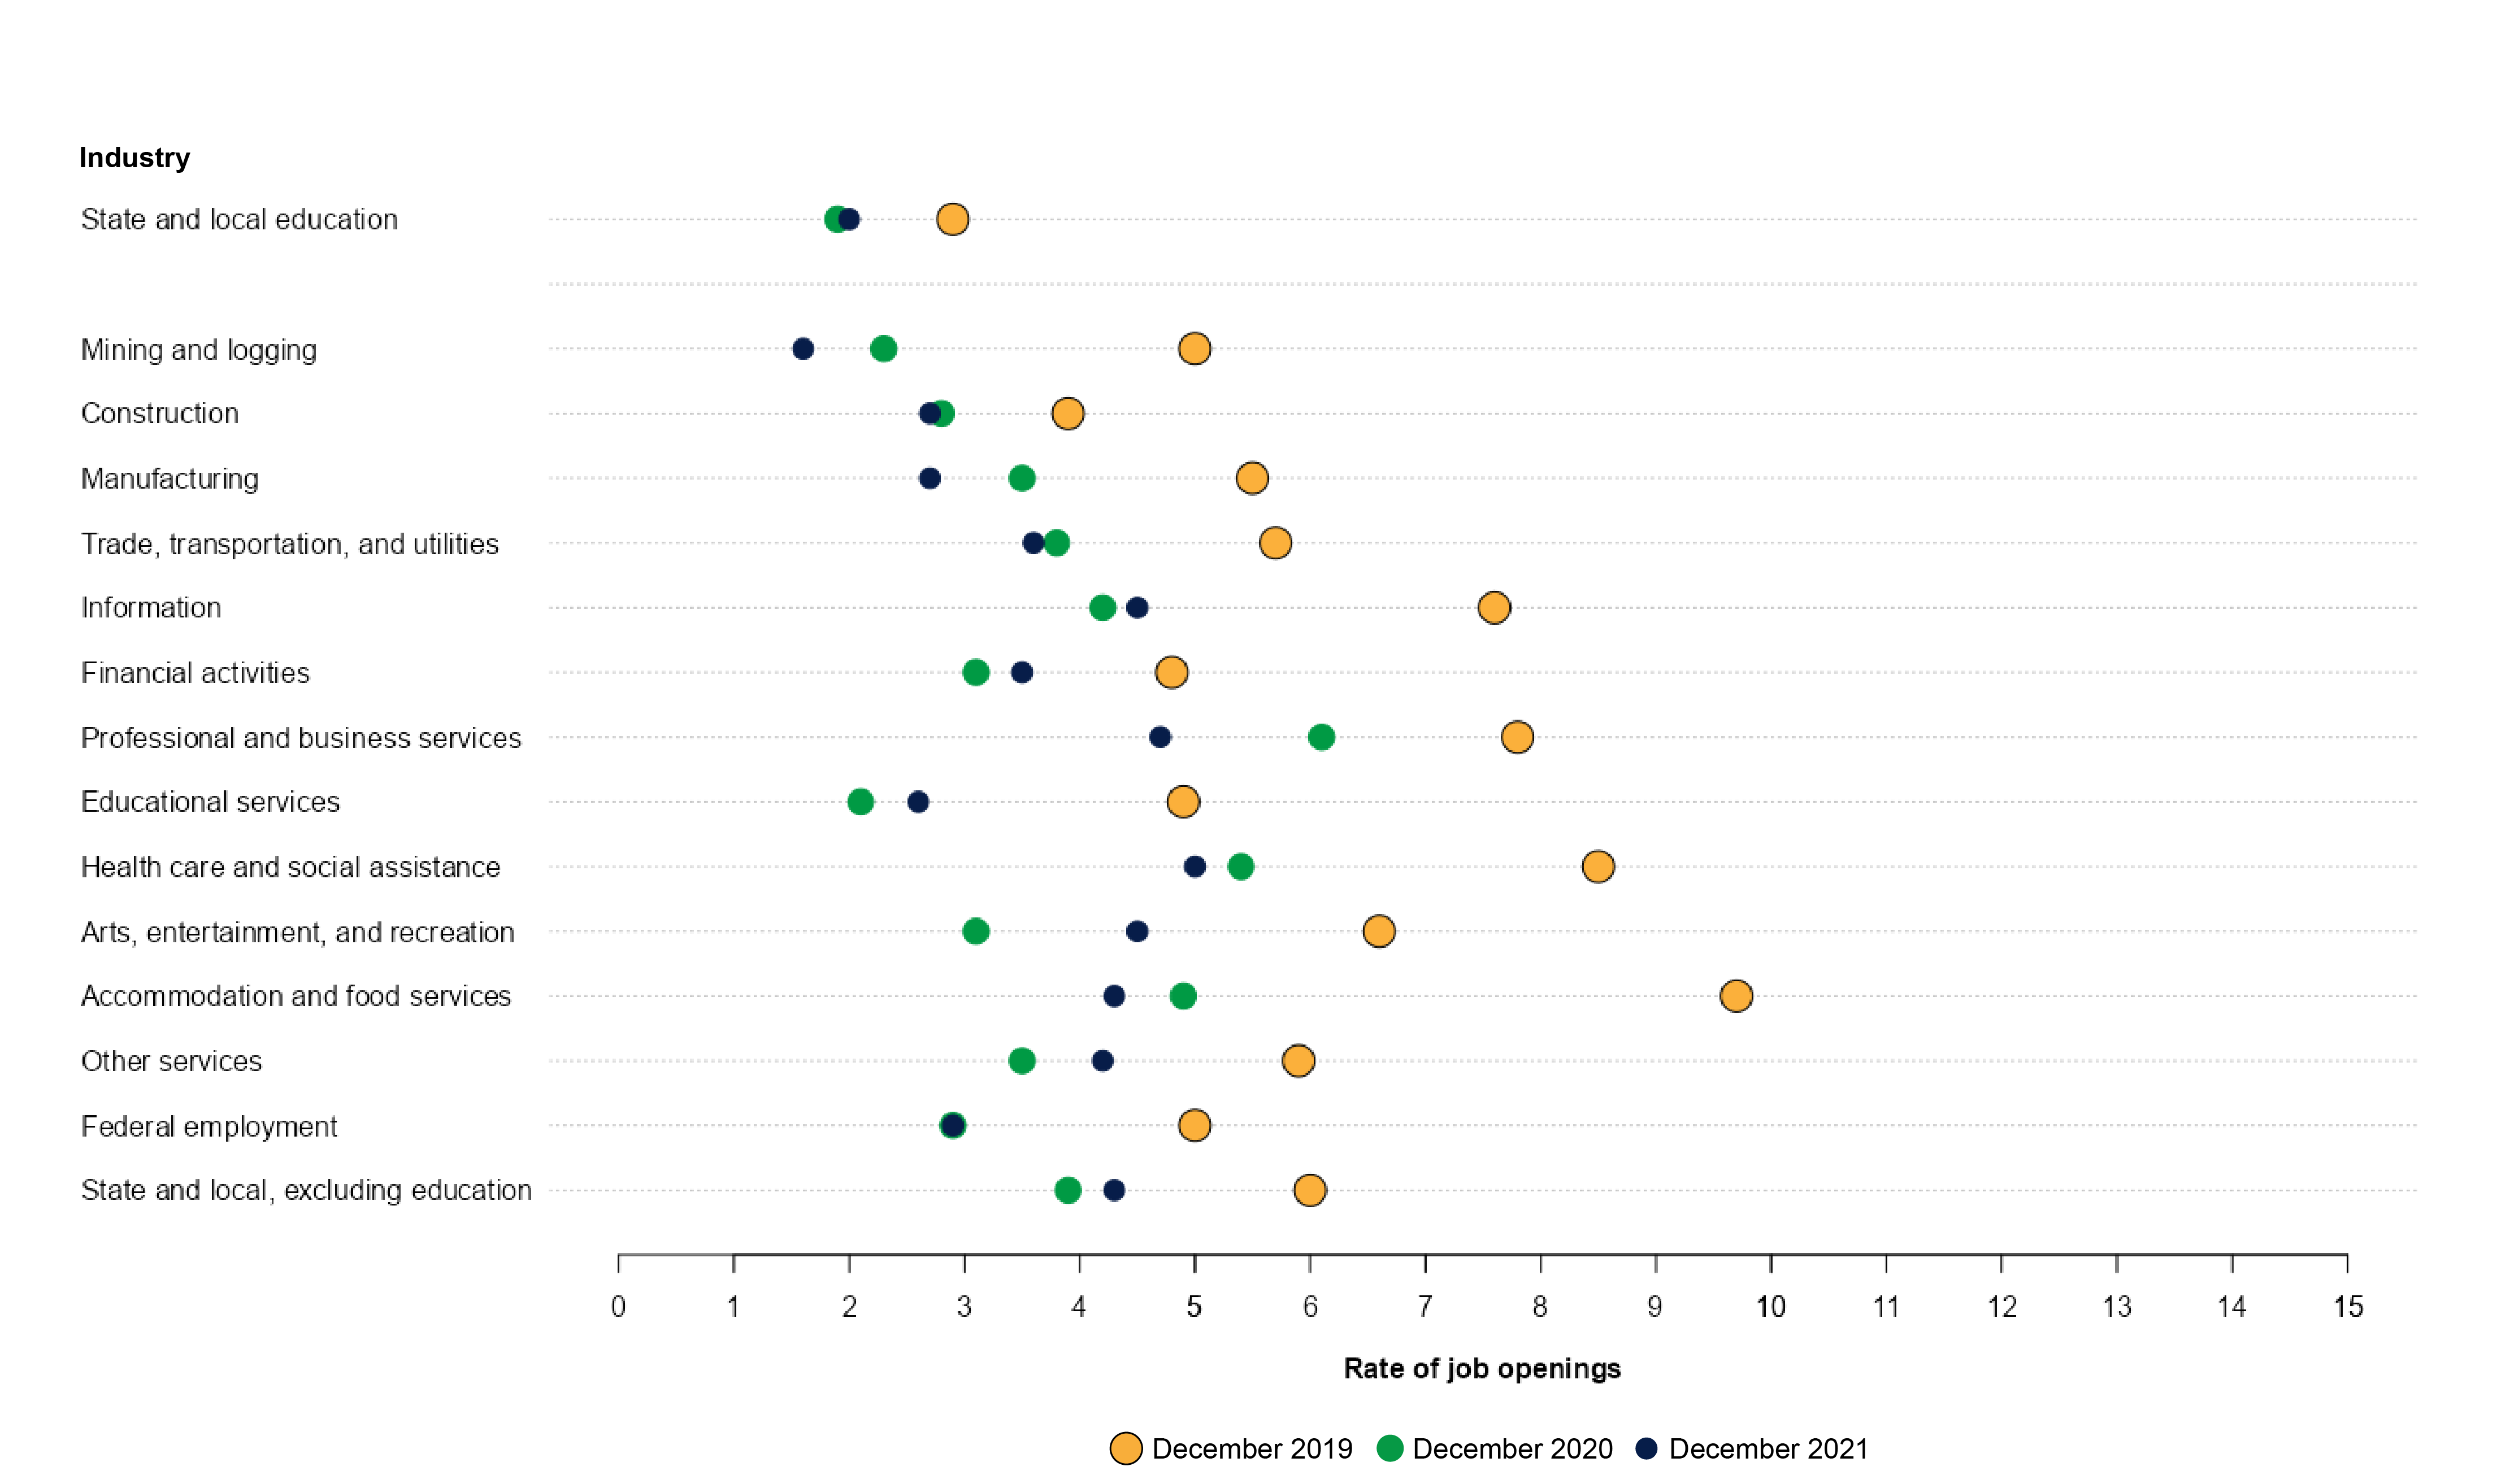
NOTE: Data are not seasonally adjusted.
SOURCE: U.S. Department of Labor, Bureau of Labor Statistics, Job Openings and Labor Turnover Survey (JOLTS), 2019, 2020, and 2021, based on data downloaded March 17, 2022.
Public State and Local Education Hires
Figure 3 shows hires across major industries as a percentage of total employment. Overall, the total nonfarm hire rate was 3.2 percent in December 2021, which was 0.3 percentage points higher than the rate in December 2020. The percentage of public state and local education sector hires was 0.9 percent (91,000) in December 2021, which was not measurably different from the number or rate in either December 2019 or December 2020. The percentage of public state and local education sector hires in December 2021 was lower than the 1.2 percent in November 2021 (133,000).
The gaps between hires and job openings in the public education sector were larger in December 2021 than in 2019 or 2020, due to a larger number of openings in December 2021. In December 2021, the gap between the rates of job openings and hires in education was 2.0 percentage points, compared with 1.2 in both December 2019 and December 2020.
Figure 3. Rate of hires, by major industry: December 2019, December 2020, and December 2021
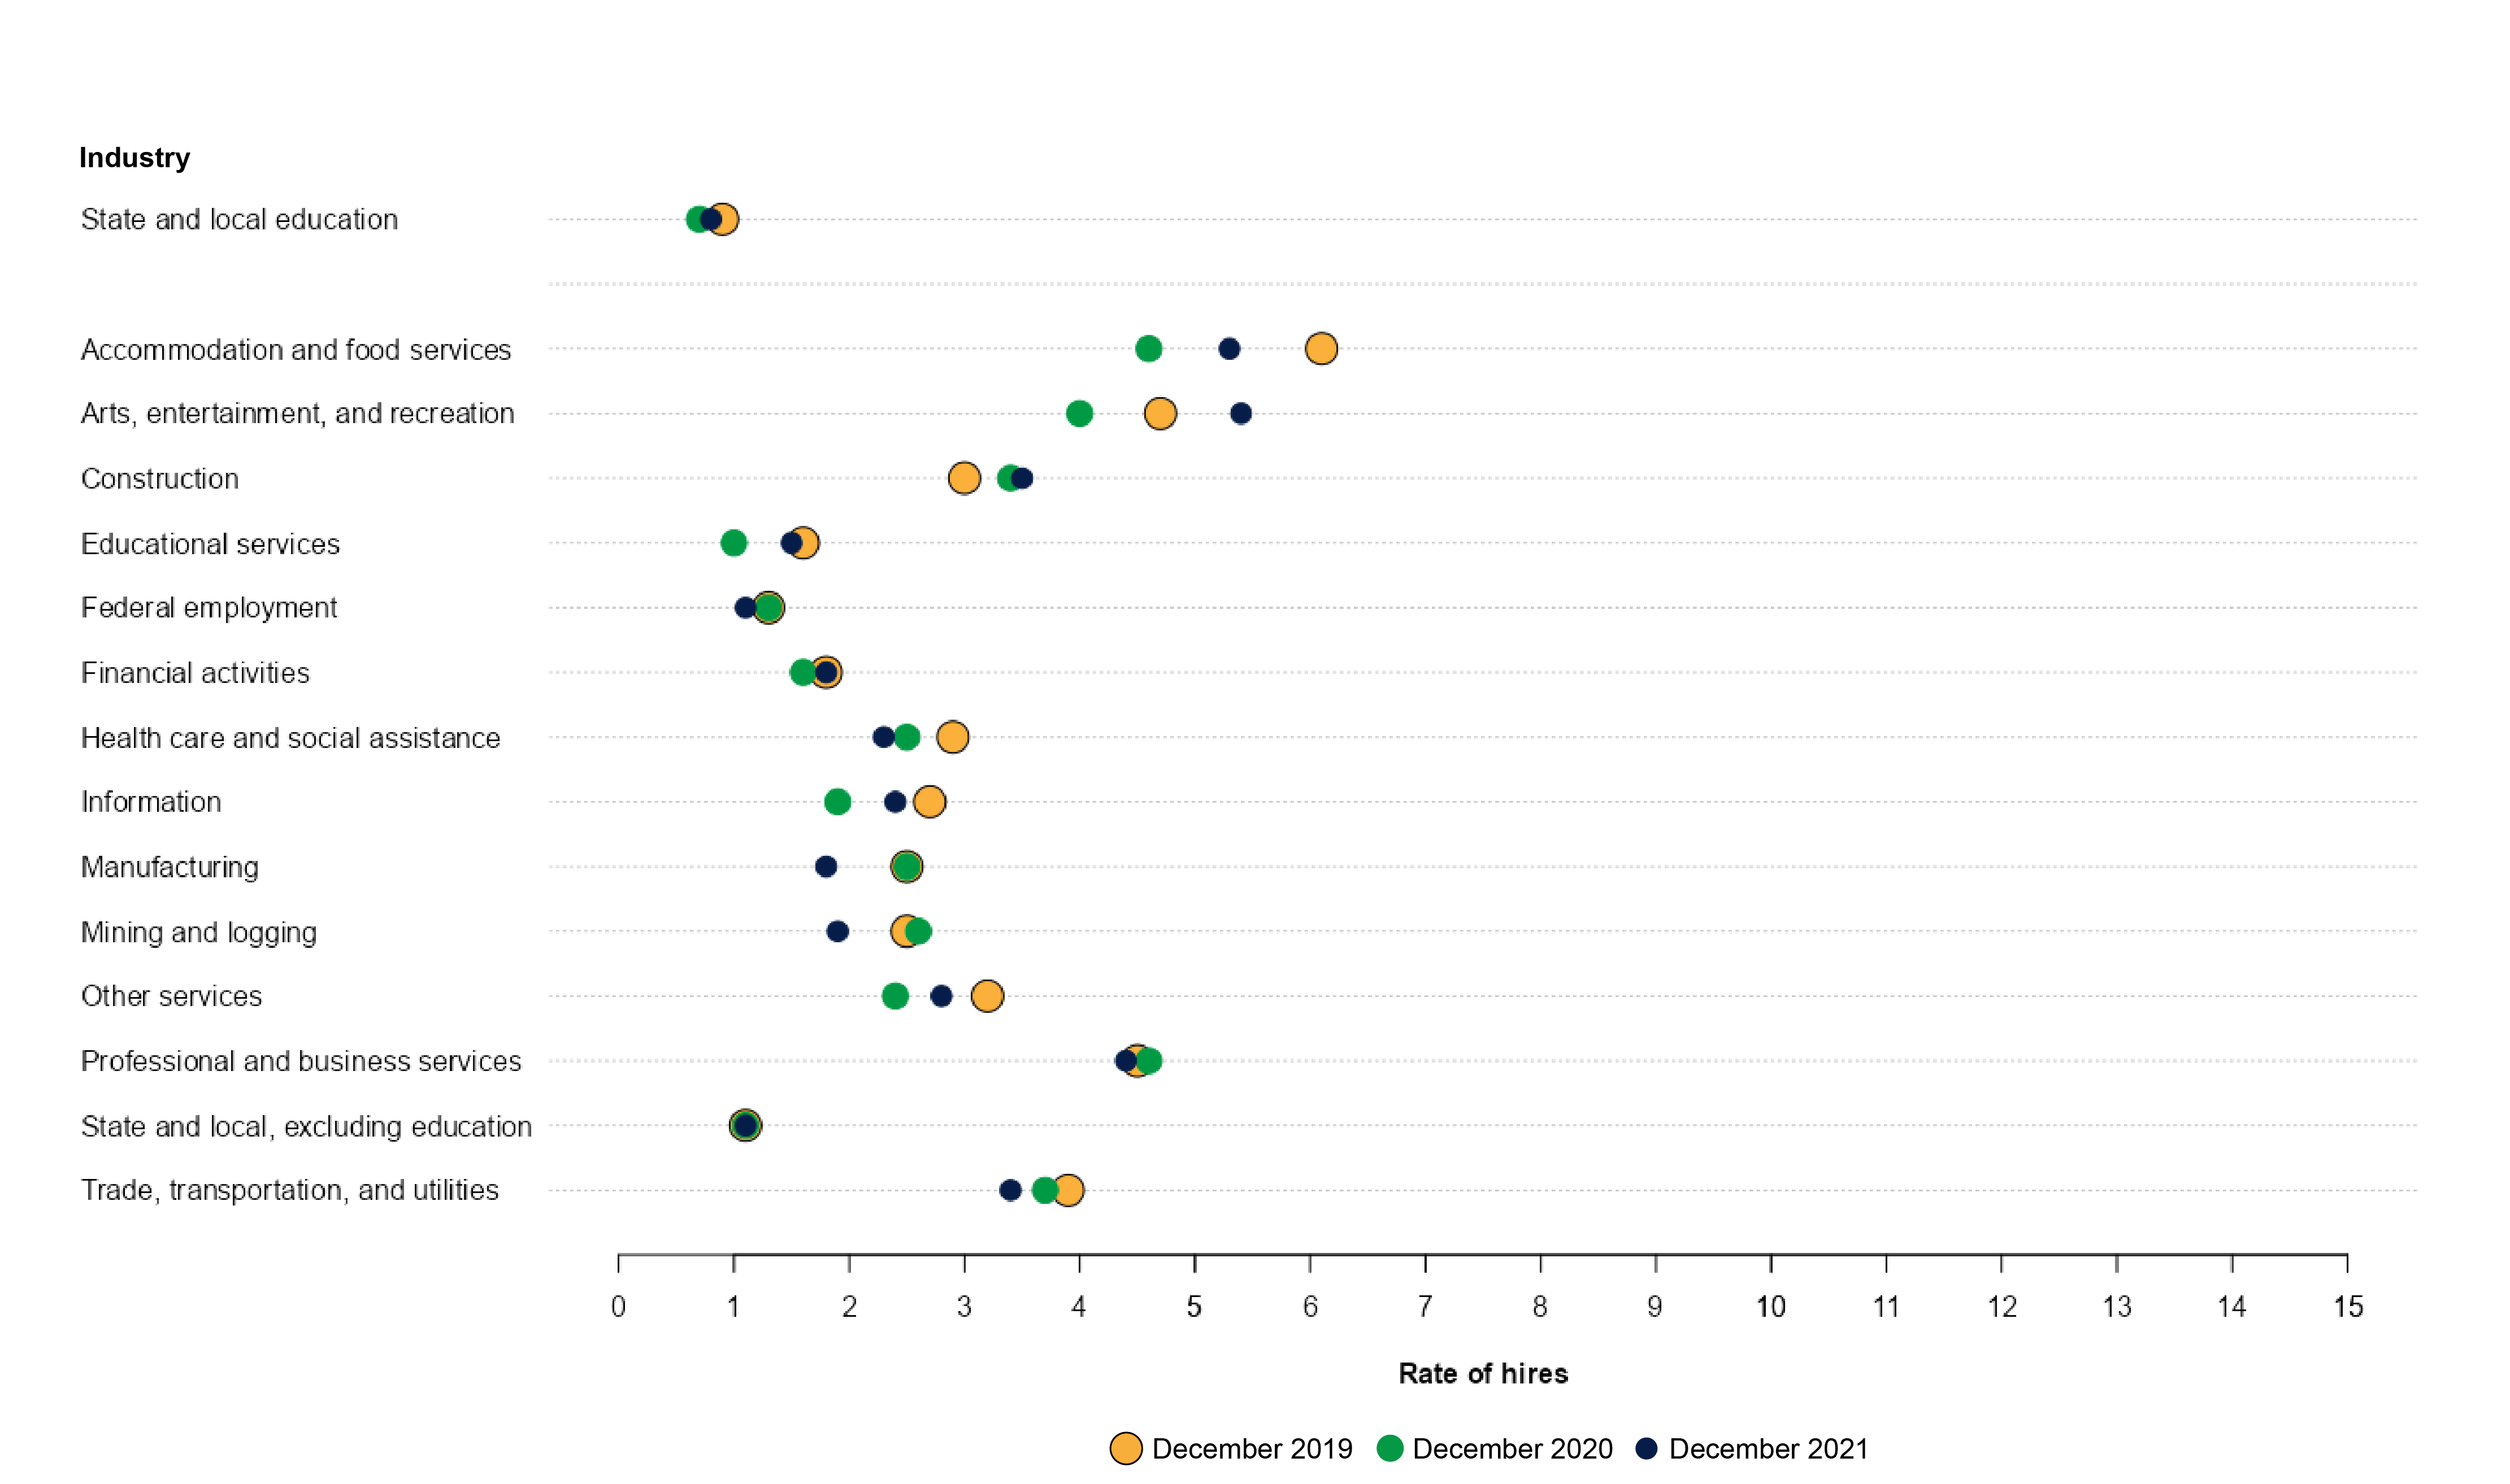
NOTE: Data are not seasonally adjusted.
SOURCE: U.S. Department of Labor, Bureau of Labor Statistics, Job Openings and Labor Turnover Survey (JOLTS), 2019, 2020, and 2021, based on data downloaded March 17, 2022.
Public State and Local Education Total Separations
Total separations include quits, layoffs and discharges, and other separations. Quits are generally voluntary separations initiated by the employee. Therefore, the quit rate can serve as a measure of workers’ willingness or ability to leave jobs. Layoffs and discharges are involuntary separations initiated by the employer. The other separations category includes separations due to retirement, death, disability, and transfers to other locations of the same firm.
Total separations for the public state and local education industry were 126,000, or 1.2 percent, in December 2021 (figure 4). Quits accounted for 59 percent of all separations for state and local education employees in December 2021. The quit rate was 0.7 percent for December 2021, which was about 0.2 percentage points higher than in December 2020, but not measurably different from the rate in December 2019. Quit rates for public state and local education employees were consistently lower than for private sector employees.8 For example, in December 2021 the total private sector quit rate was 2.8 percent.
Figure 4. Rate of total separations, by major industry: December 2019, December 2020, and December 2021
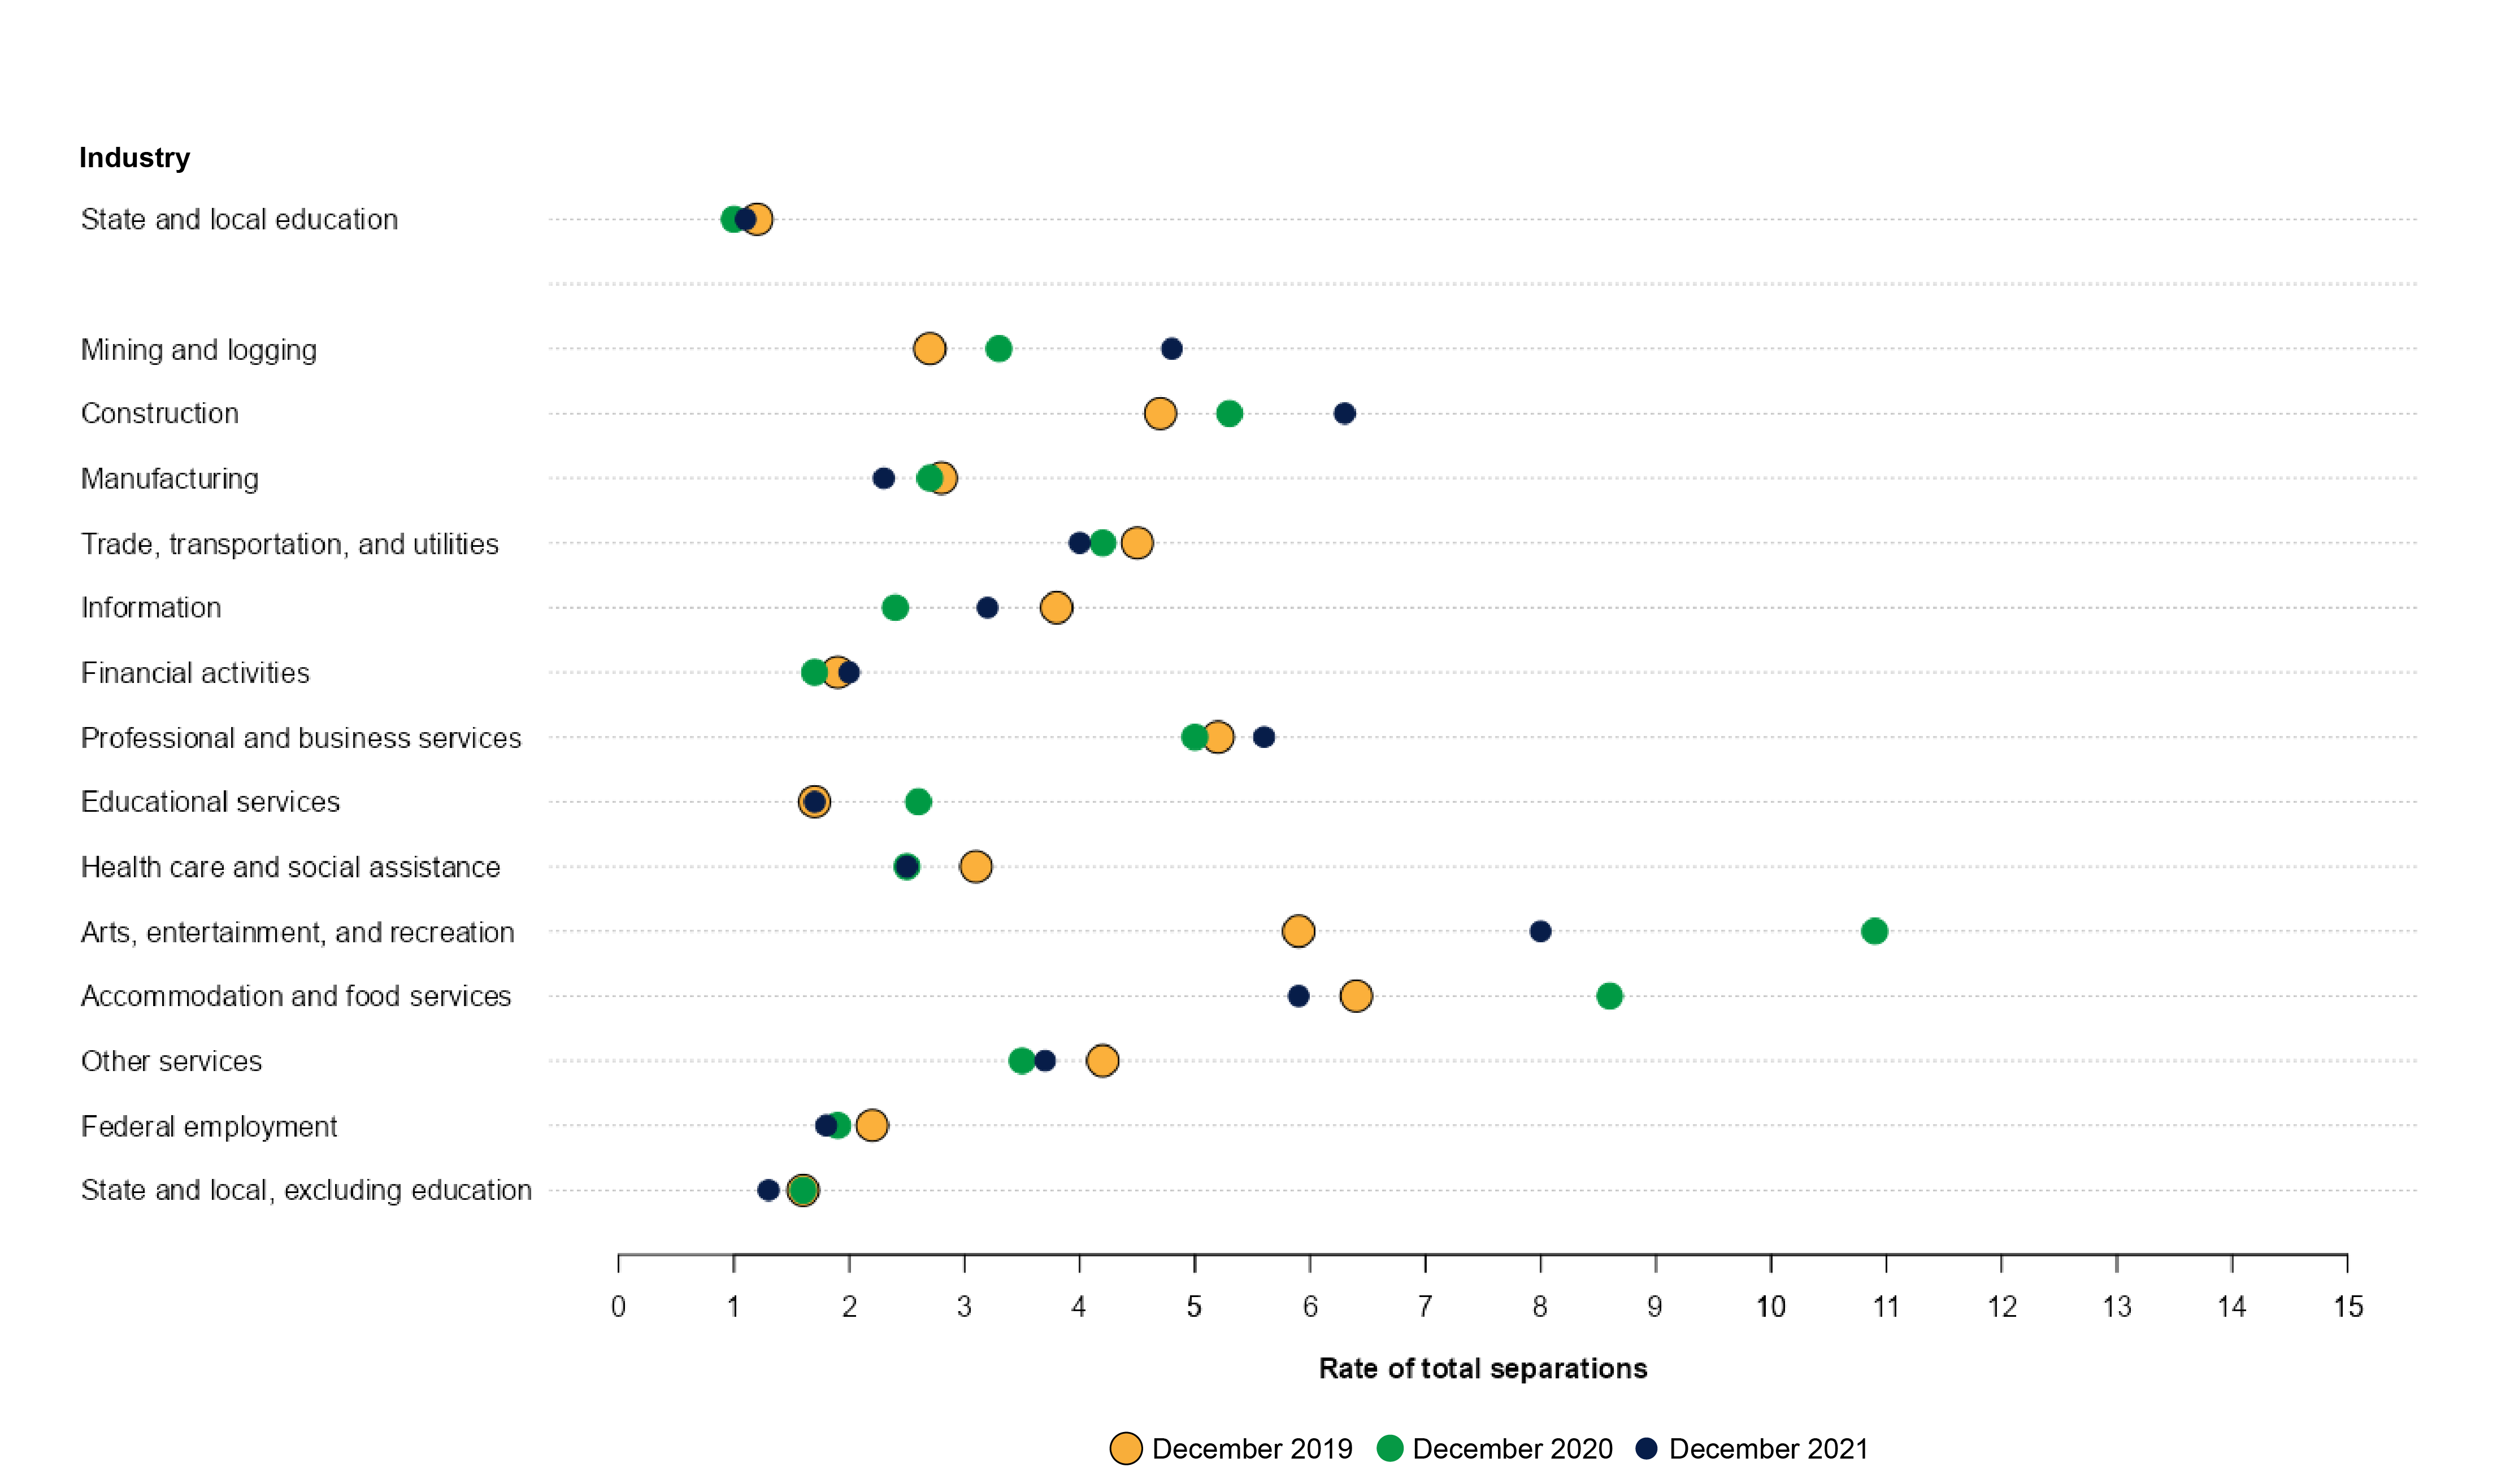
NOTE: Data are not seasonally adjusted.
SOURCE: U.S. Department of Labor, Bureau of Labor Statistics, Job Openings and Labor Turnover Survey (JOLTS), 2019, 2020, and 2021, based on data downloaded March 17, 2022.
Taken together, the data show that in recent years there generally have been fewer separations in the public education industry compared with other industries. The December 2021 separation rate for state and local education employees of 1.2 percent was higher than the November 2021 separation rate of 0.9 percent. Nevertheless, the separation rate for the state and local education industry was lower than for all other industries in December 2021.
At 2.9 percent, state and local education had the lowest percentage of jobs with openings in December 2021. However, that does not mean that staffing shortages were not a factor in the state and local education industry (figure 5). The ratio of job openings to hires for state and local education (3.5) in December 2021 is well above the average for all industries (2.1), indicating a high demand for employees in this industry and relative difficulty of filling available slots. The only industries with higher openings-to-hires ratios were the federal government (3.9) and state and local government, excluding education (5.6). Thus, while the openings-to-hires ratio was relatively higher for the state and local education industry, it was lower than the ratio for the federal government and for state and local government, excluding education.
Figure 5. Ratio of job openings to hires, by major industry: December 2021
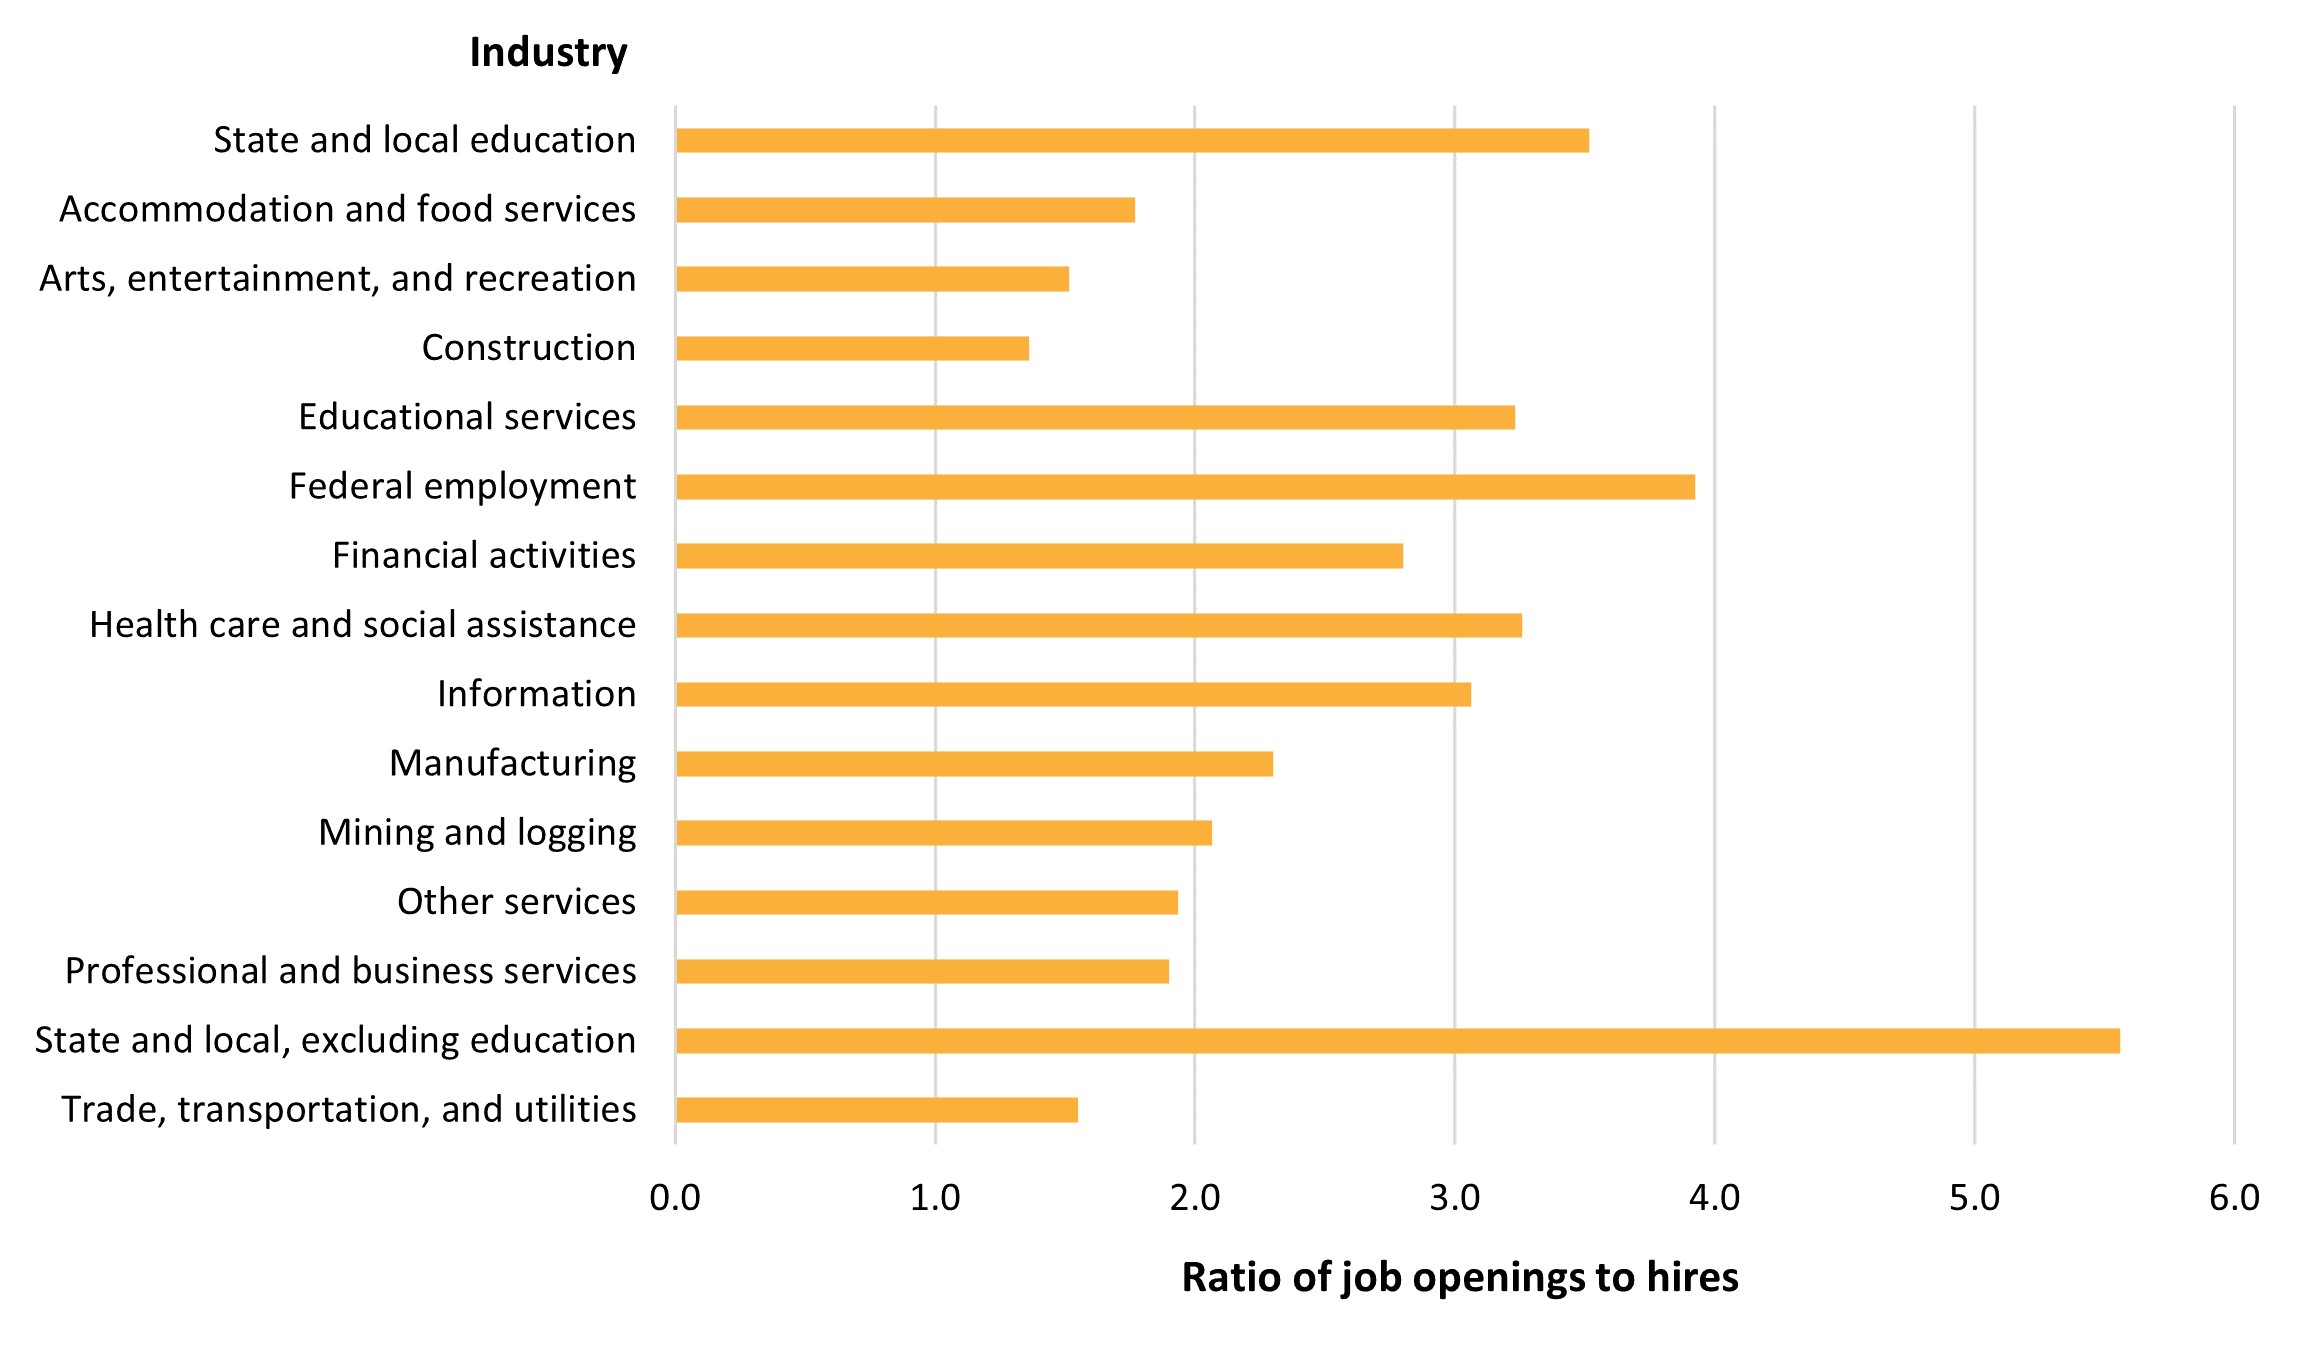
NOTE: Data are not seasonally adjusted.
SOURCE: U.S. Department of Labor, Bureau of Labor Statistics, Job Openings and Labor Turnover Survey (JOLTS), 2021, based on data downloaded March 17, 2022.
To understand the cumulative status of the employment situation at the end of the school year, we intend to provide an update of our analyses as these data become available.
Learn more about JOLTS and access additional data on job openings, hires, and separations. Be sure to follow NCES on Twitter, Facebook, LinkedIn, and YouTube to stay informed.
By Josue DeLaRosa, NCES
[3] JOLTS refers to this industry as state and local government education and uses ID 92.
[4] JOLTS does not collect occupation data.
[5] U.S. Department of Education, National Center for Education Statistics, Digest of Education Statistics, table 213.10, downloaded March 30, 2022, from https://nces.ed.gov/programs/digest/d21/tables/dt21_213.10.asp?current=yes, and table 314.10, downloaded March 30, 2022, from https://nces.ed.gov/programs/digest/d20/tables/dt20_314.10.asp?current=yes.
[6] Separations include all separations from the payroll during the entire reference month and are reported by type of separation: quits, layoffs and discharges, and other separations.
[7] Engel, M. (2012). The Timing of Teacher Hires and Teacher Qualifications: Is There an Association? Teachers College Record, 114(12): 1–29.
[8] The private sector includes all nonfarm employees except federal employment and state and local government employment.