IES Blog

Institute of Education Sciences

Measuring Student Safety: New Data on Bullying Rates at School

NCES is committed to providing reliable and up-to-date national-level estimates of bullying. As such, a new set of web tables focusing on bullying victimization at school was just released.  

These tables use data from the School Crime Supplement to the National Crime Victimization Survey, which collects data on bullying by asking a nationally representative sample of students ages 12–18 who were enrolled in grades 6–12 in public and private schools if they had been bullied at school. This blog post highlights data from these newly released web tables.

Some 19 percent of students reported being bullied during the 2021–22 school year. More specifically, bullying was reported by 17 percent of males and 22 percent of females and by 26 percent of middle school students and 16 percent of high school students. Moreover, among students who reported being bullied, 14 percent of males and 28 percent of females reported being bullied online or by text.

Students were also asked about the recurrence and perpetrators of bullying and about the effects bullying has on them. During the 2021–22 school year, 12 percent of students reported that they were bullied repeatedly or expected the bullying to be repeated and that the bullying was perpetrated by someone who was physically or socially more powerful than them and who was not a sibling or dating partner. When these students were asked about the effects this bullying had on them,

  • 38 percent reported negative feelings about themselves;
  • 27 percent reported negative effects on their schoolwork;
  • 24 percent reported negative effects on their relationships with family and friends; and
  • 19 percent reported negative effects on their physical health.

Explore the web tables for more data on how bullying victimization varies by student characteristics (e.g., sex, race/ethnicity, grade, household income) and school characteristics (e.g., region, locale, enrollment size, poverty level) and how rates of bullying victimization vary by crime-related variables such as the presence of gangs, guns, drugs, alcohol, and hate-related graffiti at school; selected school security measures; student criminal victimization; personal fear of attack or harm; avoidance behaviors; fighting; and the carrying of weapons.

Find additional information on this topic in the Condition of Education indicator Bullying at School and Electronic Bullying. Plus, explore more School Crime and Safety data and browse the Report on Indicators of School Crime and Safety: 2022.

NCES's Top Hits of 2021

As 2021—another unprecedented year—comes to a close and you reflect on your year, be sure to check out NCES’s annual list of top web hits. From reports and Condition of Education indicators to Fast Facts, APIs, blog posts, and tweets, NCES releases an array of content to help you stay informed about the latest findings and trends in education. Don’t forget to follow us on Twitter, Facebook, and LinkedIn to stay up-to-date in 2022!
 

Top five reports, by number of PDF downloads

1. Condition of Education 2020 (8,376)

2Digest of Education Statistics 2019 (4,427)

3. Status and Trends in the Education of Racial and Ethnic Groups 2018 (3,282)

4. Indicators of School Crime and Safety: 2019 (2,906)

5. Trends in High School Dropout and Completion Rates in the United States: 2019 (2,590)


Top five indicators from the Condition of Education, by number of web sessions

1. Students With Disabilities (100,074)

2. Racial/Ethnic Enrollment in Public Schools (64,556)

3. Characteristics of Public School Teachers (57,188)

4. Public High School Graduation Rates (54,504)

5. Education Expenditures by Country (50,20)


Top five Fast Facts, by number of web sessions

1. Back-to-School Statistics (162,126)

2. Tuition Costs of Colleges and Universities (128,236)

3. Dropout Rates (74,399)

4. Graduation Rates (73,855)

5. Degrees Conferred by Race and Sex (63,178)


Top five NCES/EDGE API requested categories of social and spatial context GIS data, by number of requests

1. K–12 Schools (including district offices) (4,822,590)

2. School Districts (1,616,374)

3. Social/Economic (882,984)

4. Locales (442,715)

5. Postsecondary (263,047)


Top five blog posts, by number of web sessions

1. Understanding School Lunch Eligibility in the Common Core of Data (8,242)

2. New Report Shows Increased Diversity in U.S. Schools, Disparities in Outcomes (3,463)

3. Free or Reduced Price Lunch: A Proxy for Poverty? (3,457)

4. Back to School by the Numbers: 2019–20 School Year (2,694)

5. Educational Attainment Differences by Students’ Socioeconomic Status (2,587)


Top five tweets, by number of impressions

1. CCD blog (22,557)


2. NAEP dashboard (21,551)


3. IPEDS data tools (21,323)


4. ACGR web table (19,638)


5. Kids’ Zone (19,390)


By Megan Barnett, AIR

New Report on Crime and Safety in Schools and on College Campuses

Crime in our nation’s schools and college campuses has generally declined over the past two decades, according to Indicators of School Crime and Safety 2019, a recently released NCES report. This report highlights new analyses of mental health services provided by public schools and the prevalence of school and school neighborhood problems. The report also covers topics such as victimization, school conditions, safety and security measures at school, and criminal incidents at postsecondary institutions.

In 2018, students ages 12–18 experienced 836,100 total victimizations (i.e., thefts and nonfatal violent victimizations) at school and 410,200 total victimizations away from school. These figures represent a rate of 33 victimizations per 1,000 students at school and 16 victimizations per 1,000 students away from school. From 1992 to 2018, the total victimization rate and the rates of specific crimes—thefts and violent victimizations—declined for students ages 12–18, both at school and away from school.

This edition of Indicators of School Crime and Safety examines new data on school shootings. While such events represent a small subset of the violent incidents that occur at schools, they are of high concern to those interested in the safety of our nation’s students. In school year 2018–19, there were 66 reported school shootings with casualties at public and private elementary and secondary schools (29 school shootings with deaths and 37 school shootings with injuries only). Between 2000–01 and 2018–19, the number of school shootings with casualties per year ranged from 11 to 66.

Student bullying was the most commonly reported discipline problem among public schools over the past two decades. In school year 2017–18, about 14 percent of public schools reported that bullying occurred among students at least once a week, representing a decrease from the 29 percent of schools that reported student bullying in 1999–2000. In 2017–18, about 15 percent of public schools reported that cyberbullying had occurred among students at least once a week either at school or away from school.

This edition of the report also contains an analysis of new survey items that asked administrators at schools serving fifth-graders about issues in neighborhoods around their schools. In spring 2016, “crime in the neighborhood” and “selling or using drugs or excessive drinking in public” were the two most commonly reported school neighborhood problems. Thirty-four percent of fifth-graders attended schools where crime in the neighborhood was a problem, and 31 percent attended schools where selling or using drugs or excessive drinking in public was a problem. For the five school neighborhood problems examined in the report, fifth-graders attending schools where these were a big problem or somewhat of a problem consistently had lower scores in reading, mathematics, and science than did those attending schools where these were not a problem.


In addition to reporting data on student victimizations and school safety conditions, Indicators of School Crime and Safety 2019 also includes information on the programs and practices that schools had in place to promote a safe school. The new report includes a special analysis of mental health services provided by public schools. During the 2017–18 school year, 51 percent of public schools reported providing diagnostic mental health assessments to evaluate students for mental health disorders. Thirty-eight percent of public schools reported providing treatment to students for mental health disorders. When asked about whether certain factors limited their efforts to provide mental health services in a major way, 52 percent of public schools reported that inadequate funding was a major limitation, and 41 percent reported that inadequate access to licensed mental health professionals was a major limitation.


The report also looked at safety and security practices. In school year 2017–18, about 92 percent of public schools had a written plan in place for procedures to be performed in the event of an active shooter. Forty-six percent had a plan for procedures in the event of a pandemic disease. Between 2005–06 and 2017–18, the percentage of public schools that reported having one or more security staff present at school at least once a week increased from 42 to 61 percent.

Shedding light on postsecondary campus safety and security, the report shows that the number of reported forcible sex offenses on college campuses increased greatly while the overall number of reported criminal incidents at postsecondary institutions fell. Between 2001 and 2017, the number of reported forcible sex offenses on college campus increased 372 percent (from 2,200 to 10,400 offenses) while the overall number of criminal incidents reported on postsecondary campuses decreased by 31 percent (from 41,600 to 28,900 incidents). However, in the most recent data (between 2016 and 2017), the overall number of criminal incidents reported on postsecondary campuses increased by 2 percent. In 2017, a total of 958 hate crimes were reported on college campuses, of which the most common types were destruction, damage, and vandalism (437 incidents) and intimidation (385 incidents). Race, religion, and sexual orientation were the categories of motivating bias most frequently associated with these hate crimes.

To view the full Indicators of School Crime and Safety 2019 report, please visit https://nces.ed.gov/pubsearch/pubsinfo.asp?pubid=2020063.


By Ke Wang, AIR

New Data Support Connection Between Hate-Related Words, Fear, Avoidance, and Absenteeism

Research shows that absenteeism is related to a number of negative outcomes for students, such as lower test scores and higher dropout rates, and often occurs when students feel unsafe, especially for those who experience hate-related harassment. Victims of prejudice or discrimination, including those who are called hate-related words, also experience poorer mental health and higher substance use compared with students who experience other types of harassment (Baams, Talamage, and Russell 2017).

The School Crime Supplement (SCS) defines hate-related words as insulting or bad names having to do with the victim’s race, religion, ethnic background or national origin, disability, gender, or sexual orientation. According to the 2017 SCS, 6 percent of students overall were called a hate-related word while at school. Of students who reported being called a hate-related word, a lower percentage of White students (26 percent) reported that the hate-related word was related to their race than did students who were Black (68 percent), Hispanic (52 percent), Asian (85 percent), and of All other races (64 percent). Additionally, female students were more likely than male students to be called a hate-related word related to their gender (23 vs. 7 percent).

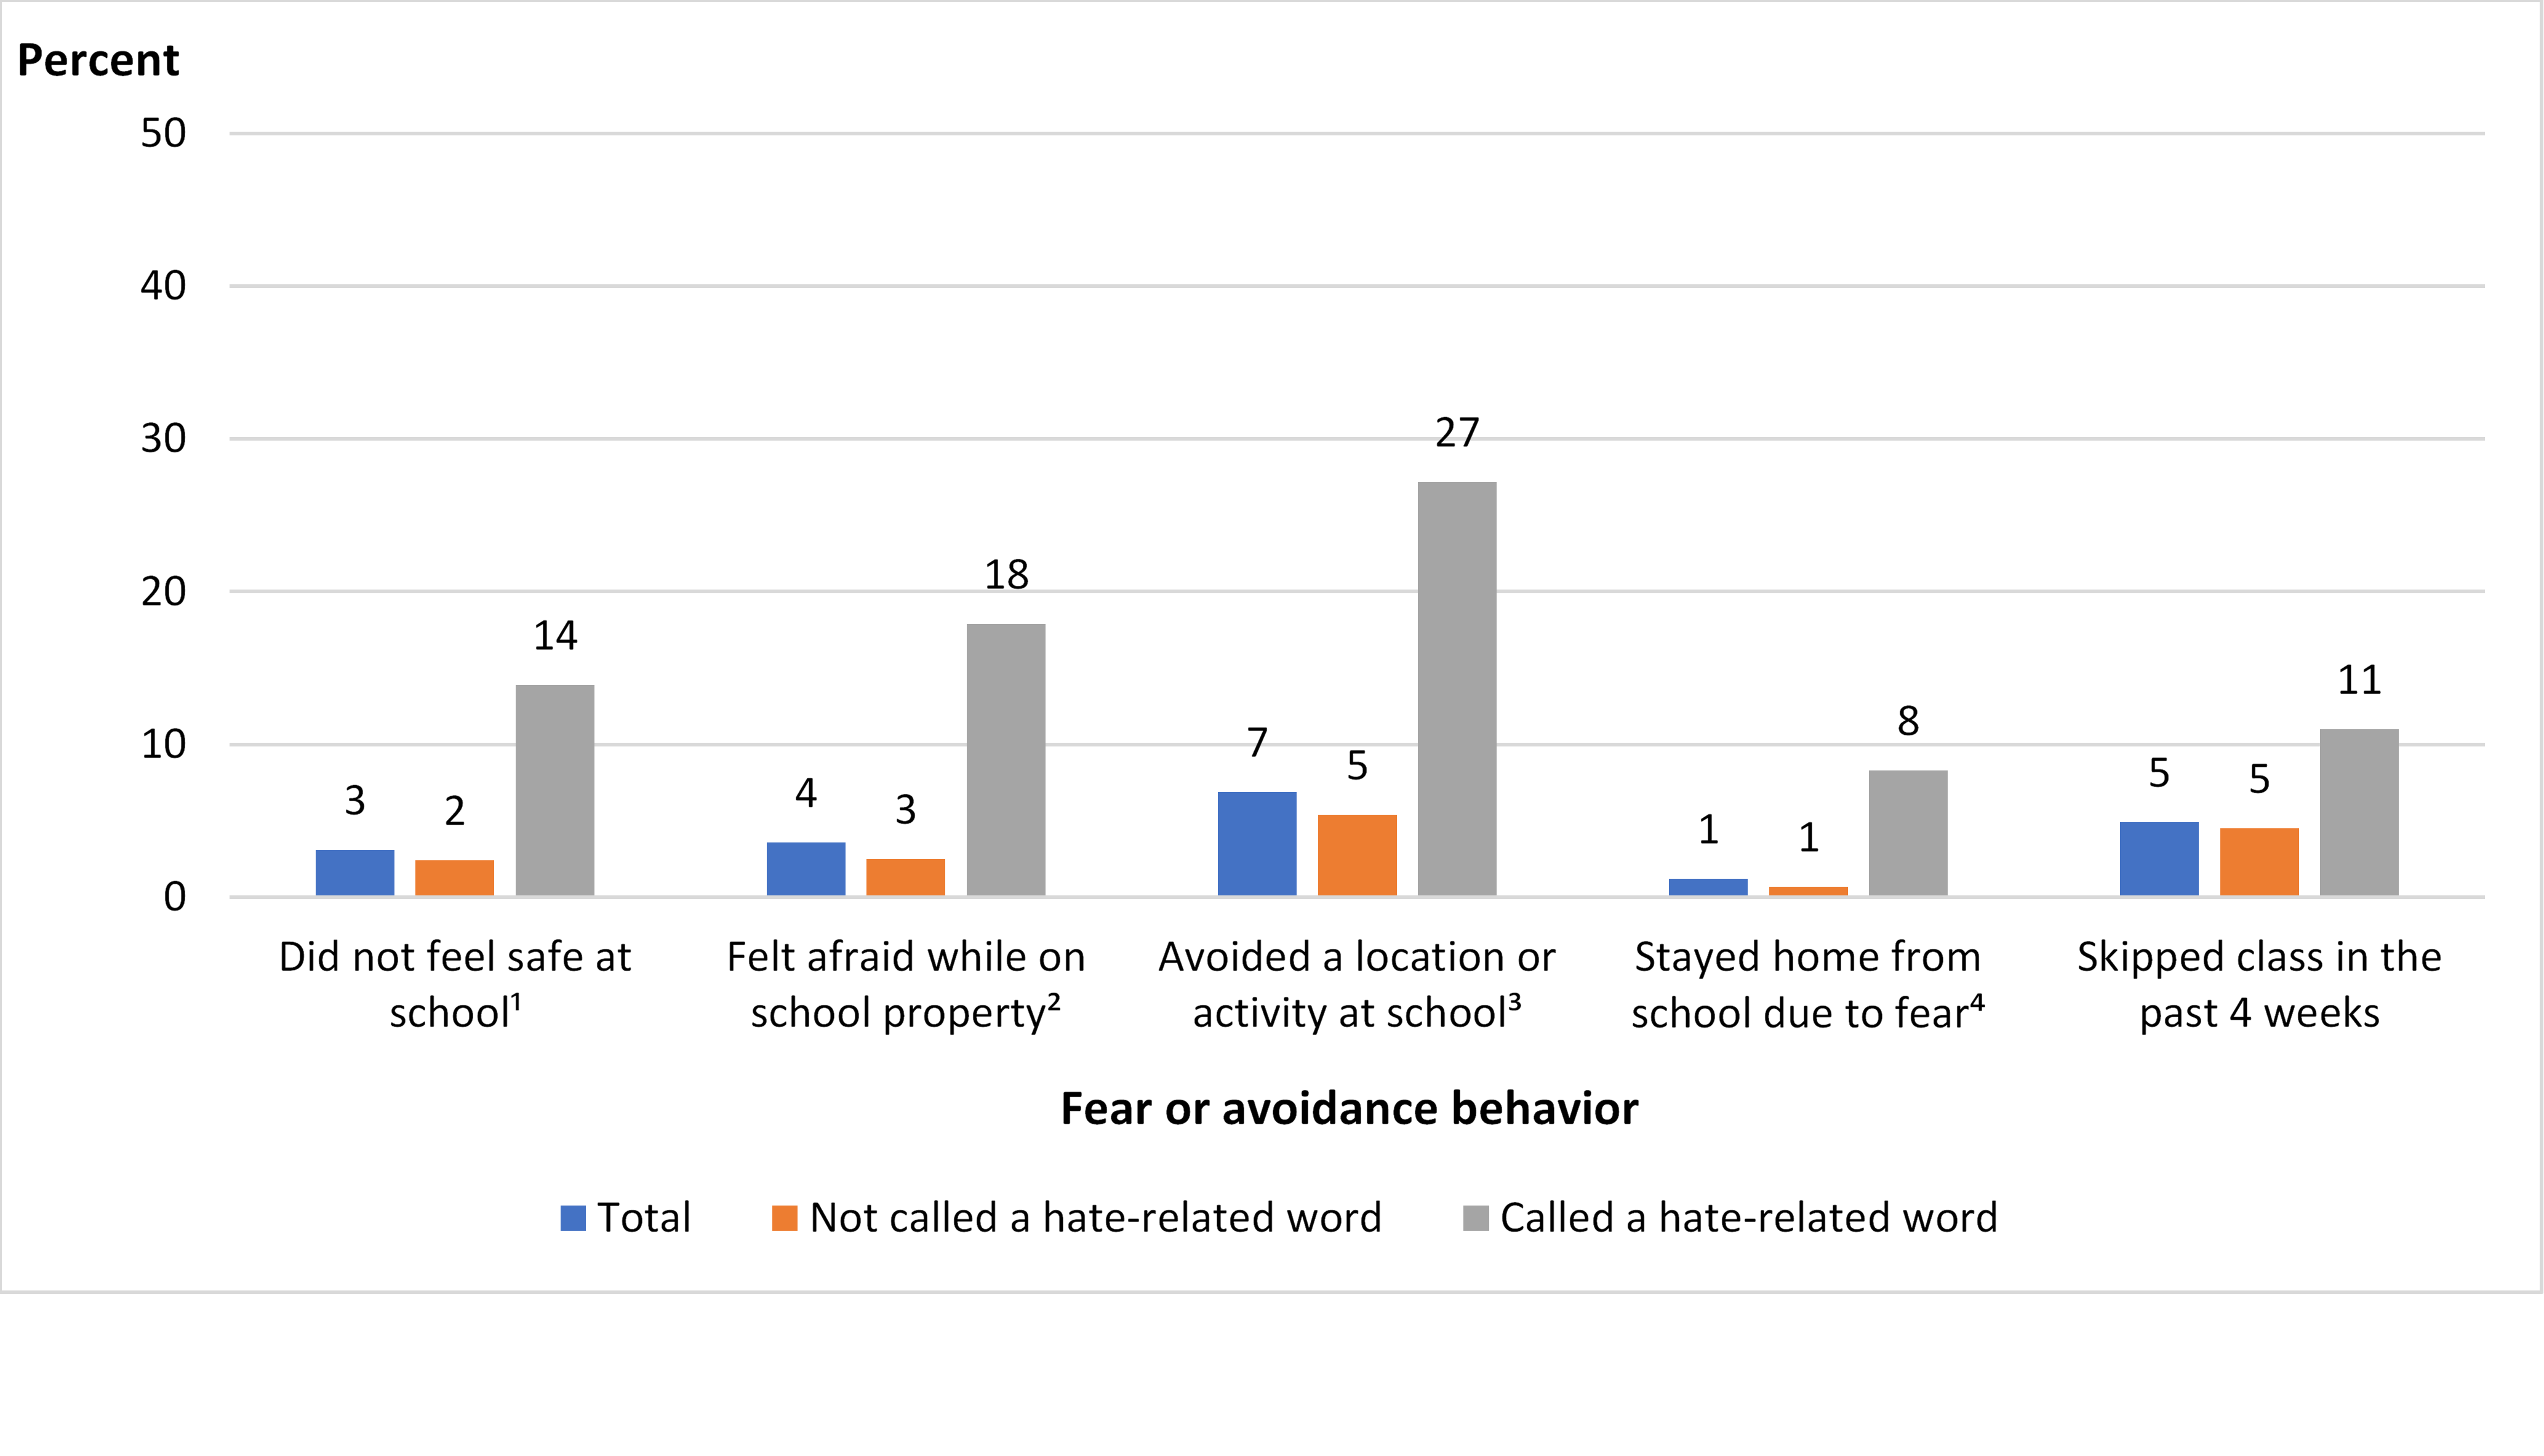
In the 2017 SCS, students who were called a hate-related word felt more fear, practiced more avoidance behaviors, stayed home more from school due to fear, and generally skipped classes more than students who were not called a hate-related word. Specifically, of those students who were called a hate-related word at school,

  • 14 percent did not feel safe at school (compared with 2 percent of students who were not called a hate-related word);
  • 18 percent were afraid that someone would attack or harm them on school property (compared with 3 percent of students who were not called a hate-related word);
  • 27 percent avoided some location, class, or activity at school (compared with 5 percent of students who were not called a hate-related word);
  • 8 percent stayed home from school due to fear that someone would attack or harm them (compared with 1 percent of students who were not called a hate-related word); and
  • 11 percent had skipped class sometime in the previous 4 weeks (compared with 5 percent of students who were not called a hate-related word).
     

Figure 1. Percentage of students ages 12 through 18 who reported being called a hate-related word at school, by student reports of fears and avoidance behaviors: School year 2016–17

1 Those who responded “disagree” or “strongly disagree” to the following question: “Thinking about your school, would you strongly agree, agree, disagree, or strongly disagree with the following? You feel safe in your school.”

2 Those who responded “sometimes” or “most of the time” to the following question: “How often are you afraid that someone will attack or harm you in the school building or on school property?”

3 Those who responded “yes” to one of the following questions: “During this school year, did you ever stay away from any of the following places: shortest route to school; the entrance into the school; any hallways or stairs in school; parts of the school cafeteria or lunchroom; any school restrooms; other places inside the school building; school parking lot; other places on school grounds; school bus or bus stop?”; “Did you avoid any activities at your school because you thought someone might attack or harm you?”; or “Did you avoid any classes because you thought someone might attack or harm you?”

4 Those who responded “yes” to the following question: “Did you stay home from school because you thought someone might attack or harm you in the school building, on school property, on a school bus, or going to or from school?”

NOTE: Figure data include only students who reported being enrolled in grades 6 through 12 and who did not receive any of their education through homeschooling during the school year reported. Students responded to the following question: “During this school year, has anyone called you an insulting or bad name at school having to do with your race, religion, ethnic background or national origin, disability, gender, or sexual orientation? We call these hate-related words.” Population size based on the 2017 SCS for all students meeting the age, grade, and school criteria is 25,023,000.

SOURCE: U.S. Department of Justice, Bureau of Justice Statistics, School Crime Supplement (SCS) to the National Crime Victimization Survey, 2017. See Table 16 in the crime table library.


You can find more information on student-reported experiences related to school crime and safety in NCES publications, including Student Reports of Bullying: Results From the 2017 School Crime Supplement to the National Crime Victimization Survey and the 2018 Indicators of School Crime and Safety.


By Christina Yanez and Rebecca Mann, Synergy Enterprises, Inc., and Rachel Hansen, NCES


Reference

Baams, L., Talmage, C., and Russell, S. (2017). Economic Costs of Bias-Based Bullying. School Psychology Quarterly, 32(3): 422–433.

New Data Available on Crime and Safety in Public Schools

The prevalence of crime in America’s public schools continues to be a topic of much concern and discussion among parents, students, educators, and policymakers. A new report from the National Center for Education Statistics (NCES) provides the latest data to help inform conversations and debate about school safety.

The report, Crime, Violence, Discipline, and Safety in U.S. Public Schools, presents new information from the 2017–18 School Survey on Crime and Safety (SSOCS). SSOCS is a nationally representative survey of school principals that collects detailed information on both incidents of crime in U.S. public schools and the practices and programs schools have implemented to promote school safety.

This report presents selected findings on a wide range of topics, including violent and nonviolent incidents, disciplinary problems and actions, security measures, security staff, mental health services, and limitations on crime prevention. In addition to presenting updates for data that have been published in prior SSOCS reports, the new report highlights topics not covered in previous reports, including the number of incidents involving the use or possession of a firearm or explosive device at school as well as the percentage of schools that have “panic buttons” or silent alarms that directly connect to law enforcement in the event of an incident.

Data on both school crime incidents and school safety practices are available by various school characteristics, such as school type, enrollment size, and locale (i.e., whether the school is located in an urban, suburban, or rural area).  

One key finding highlighted in the report is that most schools have written plans for various emergency scenarios. In school year 2017–18, the most common types of plans reported were for responses to natural disasters (94 percent), active shooters (92 percent), and bomb threats or incidents (91 percent).


The report also presented other key findings from the 2017–18 school year:

  • Seventy-one percent of U.S. public schools reported that at least one violent incident occurred at school during the school year.
  • Three percent of schools reported that there was at least one incident involving the possession of a firearm or explosive device at their school.
  • Forty-six percent of traditional public schools had a school resource officer present at school at least once a week, compared with only 19 percent of charter schools. Conversely, a higher percentage of charter schools than of traditional public schools had a security guard or other security personnel present at least once a week (35 vs. 21 percent).
  • Restorative circles were used more frequently in schools with a higher enrollment of minority students. A restorative circle is a formal mediation process led by a facilitator who brings affected parties of a problem together to explore what happened, reflect on their roles, and find solutions that address individual and community concerns. Among schools with at least 50 percent minority enrollment, half (50 percent) reported involving students in restorative circles. However, in schools with lower minority enrollment (20 to 50 percent), a lower percentage of schools reported involving students in restorative circles (38 percent).
  • Fifty-one percent of schools provided diagnostic mental health assessments to evaluate students for mental health disorders, and 38 percent provided treatment to students for mental health disorders.

To access the full report, please visit https://nces.ed.gov/pubs2019/2019061.pdf. SSOCS:2018 data files will be released later this year. Due to the sensitive nature of SSOCS data, researchers must apply for a restricted-use license to access the full SSOCS:2018 restricted-use data file. A public-use data file—with some sensitive variables removed—will be released after the restricted-use data file.


By Sam Correa and Melissa Diliberti (AIR) and Rachel Hansen (NCES)