IES Blog

Institute of Education Sciences

Differences in Postsecondary Persistence by Student and School Characteristics

By Cris de Brey

About 70 percent of first-time postsecondary students who started at 2-year or 4-year colleges in 2011-12 were either still enrolled or had attained a degree or certificate three years later. But a recent spotlight in the Condition of Education shows that there are differences in postsecondary persistence based on the type of institution attended and student demographics. 

Given the economic and employment benefits of postsecondary education, it’s important that students who enroll in postsecondary education persist to degree completion. Persistent students are those that were enrolled at any institution or had attained a degree or certificate 3 years after first enrolling. The spotlight uses data from the Beginning Postsecondary Students Longitudinal Study and focuses on differences in persistence rates by demographic and college or university characteristics.

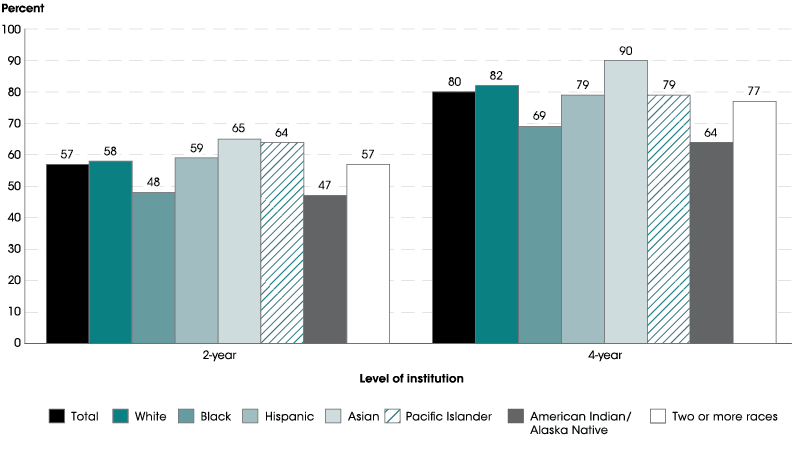
In spring 2014, the persistence rate for students who began at 2-year institutions in 2011–12 was 23 percentage points lower than for students who began at 4-year institutions (see Figure 1).


Figure 1. Persistence rates of first-time postsecondary students who began at 2- and 4-year institutions during the 2011–12 academic year, by race/ethnicity: Spring 2014
NOTE: Race categories exclude persons of Hispanic ethnicity. Students who first enrolled during the 2011–12 academic year are considered to have persisted if they were enrolled at any institution in Spring 2014 or had attained a degree or certificate by that time.
SOURCE: U.S. Department of Education, National Center for Education Statistics, 2012/14 Beginning Postsecondary Students Longitudinal Study (BPS:12/14). See Digest of Education Statistics 2016, table 326.50.


A gap between persistence rates at 2- and 4-year institutions was also observed for students who were White, Black, Hispanic, Asian, and of Two or more races. The difference in persistence rates between students who began at 2- and 4-year institutions ranged from 19 percentage points for Hispanic students to 25 percentage points for White students and Asian students.

Among students who began at 4-year institutions, Asian students had a higher persistence rate as of spring 2014 than White students. Both Asian and White students had a higher persistence rate than Hispanic, Black, and American Indian/Alaska Native students.

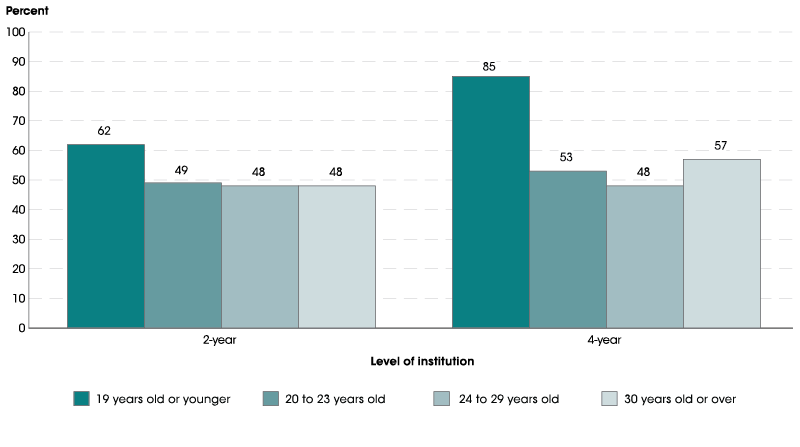
Looking at age differences, the persistence rate for students who were 19 years old or younger was higher than the rates for older students who began at both 2-year and 4-year institutions (see Figure 2).


Figure 2. Persistence rates of first-time postsecondary students who began at 2- and 4-year institutions during the 2011–12 academic year, by age when first enrolled: Spring 2014
NOTE: Students who first enrolled during the 2011–12 academic year are considered to have persisted if they were enrolled at any institution in Spring 2014 or had attained a degree or certificate by that time.
SOURCE: U.S. Department of Education, National Center for Education Statistics, 2012/14 Beginning Postsecondary Students Longitudinal Study (BPS:12/14). See Digest of Education Statistics 2016, table 326.50.


There was no measurable difference between the persistence rates for the oldest three age groups who began at either type of institution.

The persistence rate for students 19 years old or younger who began at 2-year institutions was 24 percentage points lower than the rate for their same-aged peers who began at 4-year institutions. Unlike the youngest students, there were no measurable differences in persistence rates by level of institution for students who began their postsecondary education when they were 20 to 23 years old, 24 to 29 years old, and 30 years old or over.

For more information on postsecondary persistence rates, see the full spotlight on this topic in the Condition of Education. 

Taking Education Research Out of the Lab and Into the Real World

The Institute of Education Sciences is committed to supporting research that develops and tests solutions to the challenges facing education in the United States and working to share the results of that research with a broad audience of policymakers and practitioners. In this blog post, Katherine Pears (pictured right), a principal investigator from the Oregon Social Learning Center, shares how an IES-funded grant supported not only the development and testing of an intervention, but its implementation in classrooms.

Sometimes when I tell people that I am a research scientist, they say "Ok, but what do you do?" What they are really asking is whether the work I am doing is helping students and families in actual schools and community. It’s a good question and the short answer is “Yes!” but moving programs from the research lab to children, families and schools takes time and funding. Here is how it worked with my program.

I wanted to help children at risk for school failure to start kindergarten with skills to help them to do better. I teamed up with Dr. Phil Fisher and others, and we built on years of research and program development at the Oregon Social Learning Center (OSLC) to create a program called Kids in Transition to School (KITS). This is a summer program that continues into the first few weeks of school and focuses not only on letters and numbers, but also on teaching children how to get along with others and how to learn (such as focusing their attention). We also train the KITS teachers to use positive teaching strategies and help parents learn the same techniques to increase the chances that children will succeed.

However, before a school will put a program like KITS in place, they need to have some proof that it will actually work. That is why we sought external funding to evaluate the program.  With funding from the Institute of Education Sciences (IES), as well as the Eunice Kennedy Shriver National Institute of Child Health and Human Development (NICHD) and the National Institute on Drug Abuse (NIDA), we were able to test KITS with three different groups of children at high risk for difficulties in school: children in foster care, children with developmental disabilities and behavior problems, and children from low-income neighborhoods. 

Across these studies, KITS led to positive outcomes for children and the parents. Funding from IES helped us show that the KITS Program worked with different groups of children and that it was a good candidate for use in school settings. In many cases, this is where the process of moving programs from research to practice can get bogged down due to a gap between researchers and the people in the education systems that could use the programs. IES is strongly committed to bridging that gap by supporting partnerships between researchers and practitioners. In our IES-funded study, we partnered with two of our local school districts and United Way of Lane County (UWLC). Working with the schools and community agencies helped us to both test KITS and develop plans for how the districts could keep the program going after the funding for the research study ended.

Our partnership with UWLC also enabled us to start a new project to bring KITS to more schools. With funding from the Corporation for National and Community Service (CNCS) Social Innovation Fund, UWLC offered grants to education foundations in Lane County, Oregon to implement KITS in the local school districts. The Social Innovation Fund allows promising programs to be brought to scale (i.e., made available to large numbers of people) by providing funding for community agencies to start and develop plans for sustaining these programs. In 2015, the KITS Program had about 30 educators serving about 120 children and families in 6 school districts in Lane County, Oregon. By summer 2017, two years into the grant, the KITS Program had trained 125 educators to serve approximately 435 children and families in 13 school districts in the county. That’s more than a threefold increase in the number of children and families served, as well as the number of teachers trained in the KITS Program.

We will continue to work with partners to evaluate the effects of the KITS program and make it available to more school districts. However, without the funding from IES and other federal agencies, we would not have been able to both test the program and partner with schools to make KITS a part of their everyday practice. 


IES-supported Technology to be Used in Hundreds of Schools

A technology-based instructional tool—developed and evaluated through IES funding—will now be put it to use in hundreds of schools across the country with the goal of improving students’ literacy outcomes. The United2Read Project was recently awarded a five-year Education Innovation and Research (EIR) expansion grant from the U.S. Department of Education. The EIR grants provide funding to develop, expand, and evaluate innovative, evidence-based programs designed to improve student achievement.

A2i (pictured right) includes a series of assessments to measure component literacy skills of students and provide information that teachers can use to individualize literacy instruction in Kindergarten through Grade 3.  The assessments cover a wide range of literacy skills, including vocabulary, decoding, word reading, spelling, sentence and paragraph writing, comprehension, and inferencing.

A2i assessments are given throughout the school year to monitor student progress, and A2i’s algorithms are updated in real-time to provide teachers with recommendations for instruction for each student and changes to grouping.

This project demonstrates the critical role IES plays in supporting research to develop innovative teaching and learning products and test those products for efficacy.  Over the past 13 years, A2i was developed, evaluated, and scaled with a progression of awards from IES, as well as the National Institutes of Health/National Institute of Child Health and Human Development (NIH/NICHD).

  • With a 2004 IES research grant, researchers at the University of Michigan and Florida State University conducted basic research to understand how the effects of different types of literacy instruction (e.g., phonics vs. meaning focused) depend on children’s constellation of language, phonological awareness, decoding and encoding, and comprehension skills. The team then used the findings from this initial work to build and test an initial version of A2i with first-grade students. The research demonstrated that instruction tailored to students’ skills and learning needs, and adjusted over time, is more effective than one-size-fits-all approaches.
  • With a 2007 IES research grant, the researchers expanded A2i into second- and third-grade classrooms. They also tested the effects of implementing the system with second-grade students who had received A2i-informed instruction in Grade 1, as well as those who had not.
  • With a 2013 IES research grant and grant support from NIH/NICHD, researchers at Florida State and Arizona State conducted seven randomized controlled studies examining the impact of A2i on student reading. The results suggest that individualizing literacy instruction with A2i recommendations led to stronger literacy gains for K-3 students. On average, students who used A2i across multiple years ended third grade reading at a grade 5 level. The research included students who qualified for the National School Lunch Program and who received special education services.
  • With a 2013 IES research grant to Arizona State University (which was later transferred in 2016 to University of California, Irvine) and a 2014 award from the ED/IES Small Business Innovation Research (SBIR) Program to Learning Ovations, an education technology development firm, the researchers upgraded the underlying data architecture of A2i to enable scale and implementation in classrooms across the nation. Research results demonstrated that the more teachers viewed student test scores, the greater the students’ literacy skill gains.
     

(Findings from all publications on the A2i software and related professional development are posted on Learning Ovations website.) 

The new EIR expansion grant was awarded to a consortium of researchers and developers, including researchers at UC Irvine, Learning Ovations, Digital Promise (a non-profit), and MDRC, a national evaluation firm. At least 300 schools and 100,000 students will be served through the grant, which will also support a large-scale effectiveness trial to measure the impact of the project on student reading achievement.

Ed Metz is a Research Scientist at IES, where he leads the SBIR and the Education Technology Research Grants programs.

Erin Higgins is an Education Research Analyst at IES, where she leads the Cognition and Student Learning Research Grants program.

Data on New Topics in the School Survey on Crime and Safety Shed Light on Emerging Areas of Interest

By Rachel Hansen, NCES; and Melissa Diliberti and Jana Kemp, AIR

For more than 15 years, the National Center for Education Statistics has administered the School Survey on Crime and Safety (SSOCS) to provide timely, high-quality data on crime and safety in U.S. public schools. Information collected on SSOCS includes the frequency and nature of crime; disciplinary actions; crime prevention and the involvement of law enforcement; and challenges to reducing and preventing crime. Conducted with a nationally representative sample of public schools, the sixth, and most recent, administration of SSOCS took place during the 2015–16 school year. The first report highlighting key findings from that survey was released in 2017.

For the 2015–16 survey, we included new and expanded questions on several topics to address emerging policy issues and to identify common practices in school safety, including:

  • School law enforcement, including questions on how schools involve sworn law enforcement officers in daily activities and whether schools outline the responsibilities of these officers at school. For instance, one new item asks whether law enforcement officers routinely wear a body camera, while another item asks if the school has a formalized policy defining officers’ use of firearms while at school;
  • Preventative measures used in public schools, including new questions on more recent security practices. For example, one new item asks schools to report whether they have a threat assessment team to identity students who might be a potential risk for violent or harmful behavior;
  • Preparations for crisis situations, such as whether schools drill students on the use of evacuation, lockdown, and shelter-in-place procedures. Other new items ask whether schools have panic buttons that directly connect to law enforcement and whether they have classroom doors that can be locked from the inside;
  • Student involvement in crime prevention, such as whether schools use peer mediation, student court, restorative circles, or social emotional learning training for students as part of a formal program intended to prevent or reduce violence; and
  • Staff training in discipline policies and practices, including those related to bullying and cyberbullying or strategies for students displaying signs of mental health disorders.

While previous administrations of SSOCS have asked schools to report the number of hate crimes that occurred during a given school year, the 2015–16 questionnaire asked schools to also report the bias (e.g., national origin or ethnicity, gender identity, etc.) that may have motivated these hate crimes. For the first time, the SSOCS questionnaire also asked schools to report the number of arrests that occurred at school.

In addition to these new and expanded questions, SSOCS continues to collect detailed information on schools’ safety practices, the number and type of crime incidents (e.g., sexual assault, physical attack or fight) that occur at school, and the extent to which schools involve law enforcement, parents, and other community groups in their efforts to reduce and prevent crime. To allow for trend comparisons, many items included on SSOCS questionnaires have remained consistent between survey administrations.

Due to the sensitive nature of SSOCS data, researchers must apply for a restricted-use license to access the SSOCS:2016 restricted-use data file. A public-use data file, with some variables removed, was released in March of 2018. Public-use data files from previous SSOCS administrations are also available on the SSOCS website and in DataLab