IES Blog

Institute of Education Sciences

CTE Programs Ripe for Research and Evaluation

Each February, the education community highlights the important of Career and Technical Education (CTE) by celebrating National CTE Month. And this year, we are celebrating a milestone—2017 marks 100 years of CTE legislation.  Participation in CTE classes and programs continues to grow and, as we discussed in a previous blog, there is a critical need for more research in this area of education.

IES is beginning to help fill the CTE research gap. In 2016, the IES National Center for Education Research (NCER) funded a new study led by Professor Shaun Dougherty at the University of Connecticut. Dr. Dougherty (pictured right) and his colleagues will examine the impact of attending a CTE-focused high school on students' achievement, high school graduation, and college enrollment. This will be one of only a handful of studies to provide causal evidence about the impact that CTE has on students.

Specifically, the researchers will compare the outcomes of students attending one of 16 high schools in the Connecticut Technical High School System (CTHSS), where all students participate in some form of CTE, with those of students attending a traditional comprehensive high school, with fewer opportunities to participate in CTE. In addition, the research team will conduct school observations and interviews regarding CTE delivery (e.g., number of CTE programs, industry credentials, and work-based learning opportunities offered) in both types of high schools.

Although this is the first time that Dr. Dougherty has served as a Principal Investigator on an IES-funded grant, he has conducted other research on CTE across the country. IES also sponsors other CTE-related initiatives, including the National Center for Education Statistics’ CTE Statistics Program (which has a new website).

CTE programs are poised to grow in the future as the labor market requires more skilled workers and students seek alternative educational options that lead to rewarding careers. The education field needs high-quality CTE-focused research to provide evidence to support practice. In addition, multidisciplinary perspectives on CTE are needed from researchers in related fields, such as cognitive science, educational psychology, organizational psychology, sociology and economics. Researchers from these fields, as well as others examining CTE questions, are welcome to apply for IES research grants.

Written by Corinne Alfeld, Education Research Analyst, NCER 

America’s Advanced Mathematics and Physics Students in a Global Context

By Dana Tofig, Communications Director, Institute of Education Sciences

In today’s increasingly global economy, there is a lot of interest in understanding how students in the United States (U.S.) are performing compared to their peers around the world. That is why the National Center for Education Statistics participates in and conducts several international assessments. One of those assessments—the Trends in International Mathematics and Science Study (TIMSS) Advanced—gives us a unique opportunity to see how our advanced students are performing in rigorous mathematics and physics classes as they complete high school. TIMSS Advanced is part of a broader data collection that also assesses the performance of 4th- and 8th-grade students in mathematics and science, the results of which are summarized in another blog entry.
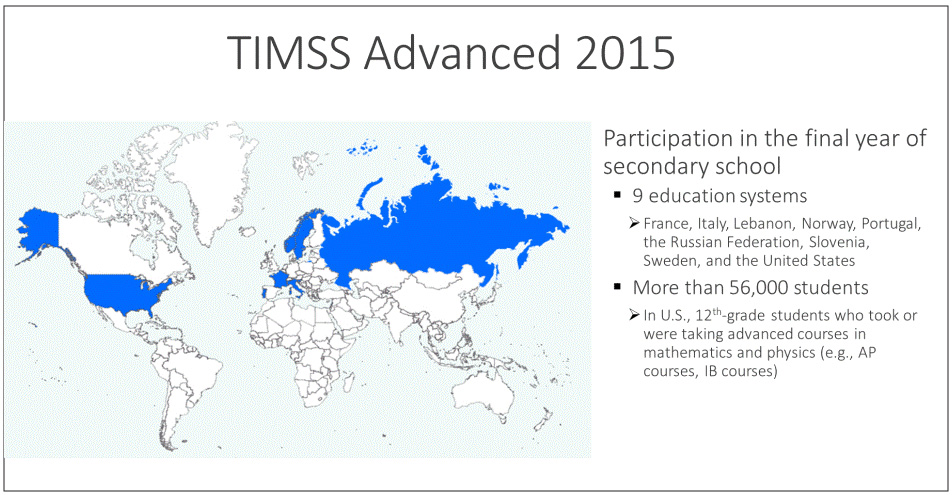
The TIMSS Advanced 2015 was administered to students from nine education systems that were in their final year of secondary school who had taken or were taking advanced mathematics or physics courses. In the U.S., the TIMSS Advanced was given to over 5,500 students in Grade 12 who were taking or had taken advanced mathematics courses covering topics in geometry, algebra and calculus, or a second-year physics course. The last time that the U.S. participated in TIMSS Advanced was 1995.

What Percentage of Students Take Advanced Mathematics and Physics?

Among the nine education systems participating in TIMSS Advanced 2015, the percentage of the corresponding age cohort (18-year-olds in the U.S.) taking advanced mathematics varies widely. This percentage, which TIMSS calls the “coverage index,” ranges from a low of 1.9 percent to a high of 34.4 percent. The U.S. falls in the middle, with 11.4 percent of 18-year-olds taking advanced mathematics courses.  The U.S. advanced mathematics coverage index in 2015 has nearly doubled since 1995, when it was 6.4 percent.
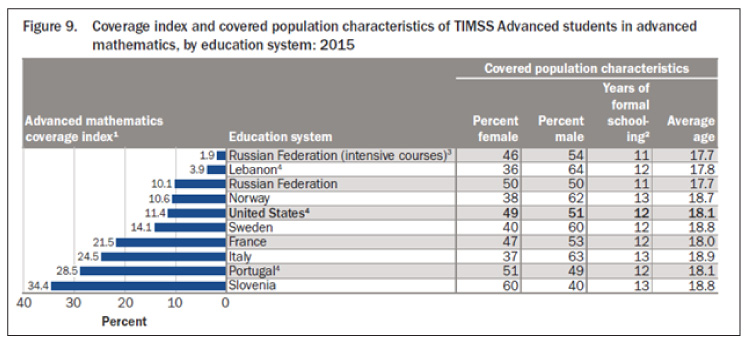
In the U.S. and two other participating systems—Portugal and Russian Federation—the students taking advanced mathematics were split fairly evenly between male and female. In the remaining systems, the students in the coverage index were majority male, except for Slovenia, where 60 percent were female. Interestingly, Slovenia had the highest coverage index, at 34.4 percent.

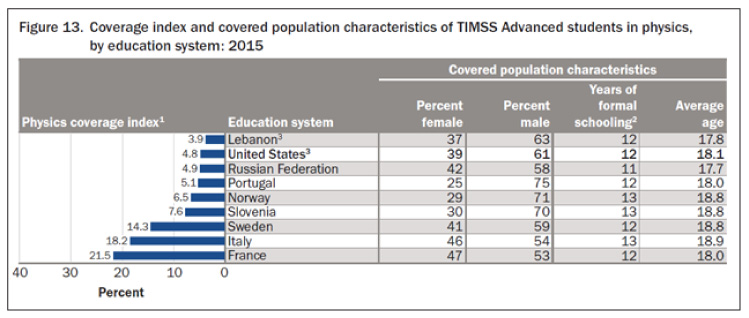
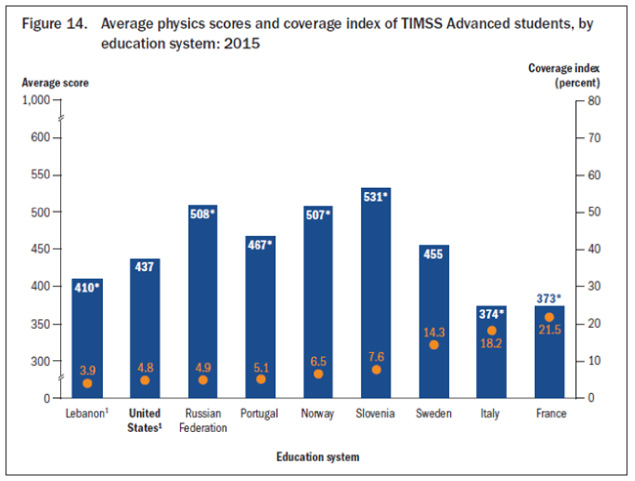
It’s a different story in science for the U.S. Among 18-year-olds in the U.S., 4.8 percent took Physics, which was among the lowest for the nine systems participating in TIMSS Advanced. Only Lebanon (3.9 percent) had a lower percentage, while France had the highest coverage index at 21.5 percent. Males made up a majority of physics students in all nine participating systems, including the U.S. 
How Did U.S. Students Perform in Advanced Mathematics?

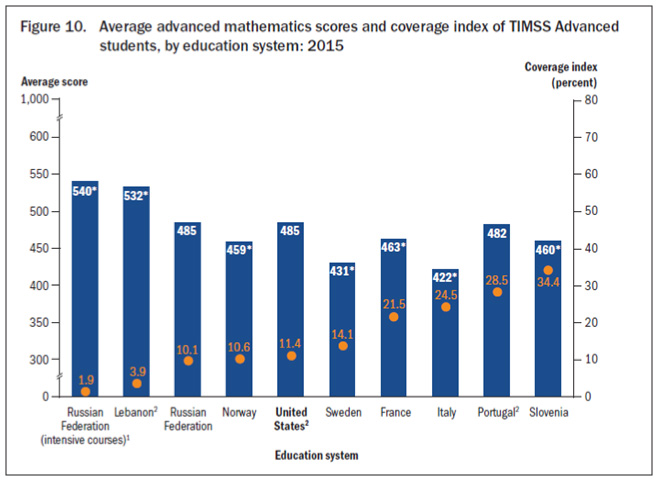
U.S. students scored 485 on TIMSS Advanced 2015 in advanced mathematics, which is not significantly different from the average U.S. score in 1995. It should be noted that on TIMSS 2015, given to a representative sample of fourth- and eighth-graders across the U.S., mathematics scores for both grades increased significantly from 1995 to 2015.

On TIMSS Advanced 2015 in advanced mathematics, two systems scored significantly higher than the U.S. (Lebanon and Russian Federation students who took intensive courses[1]) while five systems scored significantly lower (Norway, Sweden, France, Italy and Slovenia). The remaining two systems scored about the same as the U.S.
How Did U.S. Students Perform in Physics?

U.S. students scored 437 on TIMSS Advanced 2015 in physics, which was not statistically different than in 1995. No education system did better on physics in 2015 than 1995, but several did worse—four of the six systems that took the TIMSS Advanced in both 1995 and 2015 saw a significant drop in their scores.

Four of the nine countries participating in TIMSS Advanced 2015 in physics had a score that was significantly higher than the U.S. (Russian Federation, Portugal, Norway, and Slovenia) and three countries scored significantly lower than the U.S. (Lebanon, Italy and France). Sweden’s physics score was not significantly different than the U.S. 
A Note about Interpretation

It’s important to remember that there are differences in student characteristics and the structure of the various education systems that participated in TIMSS Advanced 2015. Those differences should be kept in mind when interpreting results. 


[1] Intensive courses are advanced mathematics courses that involve 6 or more hours per week. Results for students in these courses are reported separately from the results for other students from the Russian Federation taking courses that involve 4.5 hours per week. 

New Data From the Trends in International Mathematics and Science Study

How do U.S. students compare to their international peers? A look at the Trends in International Mathematics and Science Study at 4th and 8th-grade

By Lydia Malley

In today’s interconnected world, it is important to understand the skills of students in the U.S. relative to their international peers. To this end, NCES participates in a number of international assessments. Results from one of these assessments, the Trends in International Mathematics and Science Study (TIMSS), were released on November 29th. Our new report, Highlights from TIMSS and TIMSS Advanced 2015, compares the mathematics and science performance of U.S. fourth- and eighth-grade to that of their peers in over 60 countries or education systems across 6 continents. This report also presents results from TIMSS Advanced, which assessed the advanced mathematics and physics knowledge and skills of twelfth-graders in 9 countries. The results from TIMSS Advanced are discussed more in depth in another blog post.


TIMSS results show that the mathematic scores of U.S. fourth- and eighth-grade students have improved over time, while science scores have held relatively steady. TIMSS is designed to measure trends in mathematics and science achievement. Conducted every 4 years, TIMSS 2015 represents the sixth such study since TIMSS was first conducted in 1995.

Among the report’s key findings:

Fourth-grade mathematics:

  • Fourth-grade mathematics performance in the United States has improved since 1995.
  • Among 54 education systems that participated in the most recent TIMSS, average scores in 10 systems were higher than the U.S. average, 9 education systems were not measurably different from the U.S. average, and average scores in 34 systems were lower than the U.S. average.

Eighth-grade mathematics:

  • The eighth-grade average mathematics score of the United States in 2015 was higher than in any prior administration of TIMSS, since the first administration in 1995.
  • Among 43 education systems, average scores in 8 systems were higher than the U.S. average, 10 education systems were not measurably different from the U.S. average, and average scores in 24 systems were lower than the U.S. average.

Fourth-grade science:

  • Fourth-grade science performance in the United States in 2015 was not measurably different from the performance in 1995 or 2011.
  • Among 53 education systems that participated in the 2015 TIMSS, average scores in 7 systems were higher than the U.S. average, 7 education systems were not measurably different from the U.S. average, and average scores in 38 systems were lower than the U.S. average.

Eighth-grade science: U.S. eighth-graders’ average science score increased between 1995 and 2015, although the scores in the most recent years (2011 and 2015) were not measurably different.

  • Among 43 education systems, in 2015 average scores in 7 systems were higher than the U.S. average, in 9 education systems the average scores were not measurably different from the U.S. average, and average scores in 26 systems were lower than the U.S. average.

Results by Gender:

  • Males scored 7 points higher than females in fourth-grade mathematics, and eighth-grade mathematics scores for males and females were not measurably different.
  • Males scored four points higher than females in fourth-grade science and five points higher in eighth-grade science.


TIMSS is designed to align broadly with mathematics and science curricula in the participating education systems and, therefore, to reflect students’ school-based learning. TIMSS also collects information about educational contexts (such as students’ schools and teachers) that may be related to students’ achievement.

The full report is available at https://nces.ed.gov/timss/. In addition, TIMSS results are now easier than ever to access, with more than 60 tables and figures, reports, detailed descriptions of the assessments, technical notes and more available on the TIMSS 2015 website, at https://nces.ed.gov/timss/results15.asp.

TIMSS and TIMSS Advanced are sponsored by the International Association for the Evaluation of Educational Achievement (IEA) and managed in the United States by the National Center for Education Statistics (NCES), part of the U.S. Department of Education.

A National Picture of Career and Technical Education

By Lisa Hudson, National Center for Education Statistics

Happy National CTE Month! This month celebrates career and technical education (CTE), which is a significant component of the American educational system. 

Overall, 13 percent of the credits that public high school graduates earn are in CTE. Almost all public high school graduates (94 percent) earn at least some credits in CTE, with 36 percent of graduates earning at least 3 credits in CTE occupational fields, such as agriculture, business, and consumer services.  At the postsecondary level, where CTE is defined as subbaccalaureate occupational education, 39 percent of all credential awards are in CTE (see chart below).

These statistics are drawn from the CTE Statistics program at the National Center for Education Statistics (NCES), which provides national-level information on CTE at the secondary and postsecondary education levels, as well as information on occupational certification and licensure. This information  is designed to help the U.S. Department of Education and Congress evaluate the status of CTE as part of its deliberations on federal CTE legislation (currently, the 2006 Carl D. Perkins Act). This information also supports state and local CTE administrators and researchers in their efforts to develop, evaluate, and encourage effective CTE policies and programs.

Statistics, reports and summarized findings about CTE are available on the newly redesigned CTE Statistics website (see screenshot above). Here, you can find information organized into three categories—secondary education, postsecondary education, adults in general—and sorted by topic, including CTE delivery system and offerings; student participation; and student persistence, attainment, and labor market outcomes.  NCES updates the website as new data become available and new reports are produced. In the next two years, we plan to add updated information on participation in CTE by both high school and postsecondary students, as well as data on the foundational skills of adults and their participation in work-experience programs. 


Collecting CTE Statistics  

Statistics on CTE come from federally sponsored national data collections, primarily NCES data collected from schools, teachers, students, and individuals in households.  These data collections are not specifically focused on CTE. Rather, they are general purpose education or demographic surveys from which information on CTE is extracted.  The CTE Statistics website includes a list of these data sources, with links to each data source’s website, where information is provided on how to access the data.

Since CTE is embedded in the larger framework of education, it makes sense that the data collection system for CTE should, itself, be embedded in general education surveys. Using this structure we can learn more about CTE in relation to general education programs. For instance, we can compare postsecondary students who major in CTE fields with those who major in academic fields (CTE students tend to be older) and determine the proportion of the typical high school students’ curriculum that is devoted to CTE (13 percent, as noted above). We can also evaluate how high school students’ participation in CTE relates to their participation in other subject areas, their academic achievement, and their experiences after high school (it’s complicated).
 
Stay Informed
 

Visit the CTE Statistics website often to see what’s new. You can also sign up for automatic email updates using The IES newsflash (Under National Center for Education Statistics, select “Adult and career information.”) If you have thoughts, questions, or ideas, send us an email.