IES Blog

Institute of Education Sciences

Program for the International Assessment of Adult Competencies (PIAAC) 2022–23 Data Collection Begins

Last month, the National Center for Education Statistics (NCES) kicked off a major survey of adults (ages 16–74) across the nation to learn about their literacy skills, education, and work experience. Information collected through this survey—officially known as Cycle 2 of the Program for the International Assessment of Adult Competencies (PIAAC) in the United States—is used by local, state, and national organizations, government entities, and researchers to learn about adult skills at the state and local levels (explore these data in the PIAAC Skills Map, shown below).


Image of PIAAC Skills Map on state and county indicators of adult literacy and numeracy


Specifically, these data are used to support educational and training initiatives organized by local and state programs. For example, the Houston Mayor’s Office for Adult Literacy has used the PIAAC Skills Map data in developing the Adult Literacy Blueprint, a comprehensive plan for coordinated citywide change to address the systemic crisis of low literacy and numeracy in the city. In addition, the Kentucky Career and Technical College System developed a comprehensive data-driven app for workforce pipeline planning using the county-level PIAAC Skills Map data as one of the education pipeline indicators.

This is not the first time NCES is administering PIAAC. NCES collected PIAAC data three times between 2011 and 2017, when the first cycle of this international study was administered in 39 countries. Developed by the Organization for Economic Cooperation and Development (OECD), PIAAC measures fundamental cognitive and workplace skills needed for individuals to participate in society and for economies to prosper. Among these fundamental skills are literacy, numeracy, and digital problem-solving. Data from the first cycle of PIAAC (2011–17) provided insights into the relationships between adult skills and various economic, social, and health outcomes—both across the United States as a whole and for specific populations of interest (e.g., adults who are women, immigrants, older, employed, parents, or incarcerated). The OECD and NCES have published extensively using these data.

The current cycle (Cycle 2) of PIAAC will resemble the first cycle in that interviewers will visit people’s homes to ask if they are willing to answer background questionnaire and take a self-administered test of their skills. However, unlike the first cycle when respondents could respond to the survey on paper or on a laptop, this cycle will be conducted entirely on a tablet. PIAAC is completely voluntary, but each respondent is specifically selected to provide invaluable information that will help us learn about the state of adult skills in the country (participants can also receive an incentive payment for completing the survey).

PIAAC’s background questionnaire includes questions about an individual’s demographics, family, education, employment, skill use, and (new in Cycle 2 and unique to the United States) financial literacy. The PIAAC test or “direct assessment” measures literacy, numeracy, and (new in Cycle 2) adaptive problem-solving skills of adults.1

Each sampled person’s response is not only kept confidential but also “anonymized” before the data are released (so that no one can ever definitively identify an individual from personal characteristics in the datafile).

The international report and data for PIAAC Cycle 2 is scheduled to be released by the OECD in December 2024.

Be sure to follow NCES on TwitterFacebookLinkedIn, and YouTube and subscribe to the NCES News Flash to stay up-to-date on PIAAC report and data releases and resources.


By Saida Mamedova, AIR, Stephen Provasnik, NCES, and Holly Xie, NCES


[1] Data is collected from adults ages 16–74 in the United States and ages 16–65 in the other countries.

NCES Releases a New Interactive Data Visualization Tool on Revenues, Expenditures, and Attendance for Public Elementary and Secondary Education

To accompany the recently released Revenues and Expenditures for Public Elementary and Secondary Education FY 2020, NCES has created an interactive data visualization tool to highlight the per pupil revenues and expenditures (adjusted for inflation) and average daily attendance (ADA) trends from the fiscal year (FY) 2020 National Public Education Financial Survey.

This tool allows users to see national or state-specific per pupil amounts and year-to-year percentage changes for both total revenue and current expenditures by using a slider to toggle between the two variables. Total revenues are shown by source, and total current expenditures are shown by function and subfunction. Clicking on a state in the map will display data for the selected state in the bar charts.

The tool also allows users to see the ADA for each state. It is sortable by state, ADA amount, and percentage change. It may also be filtered to easily compare selected states. Hovering over the ADA of a state will display another bar graph with the last 3 years of ADA data.

Revenues and Expenditures

Between FY 2019 and FY 2020, inflation-adjusted total revenues per pupil increased by 1.8 percent (to $15,711). Of these total revenues for education in FY 2020, the majority were provided by state and local governments ($7,461 and $7,056, respectively).

The percentage change in revenues per pupil from FY 2019 to FY 2020 ranged from +15.4 percent in New Mexico to -2.4 percent in Kentucky. Total revenues per pupil increased in 38 states and the District of Columbia and decreased in 12 states between FY 2019 and FY 2020.


[click to enlarge image]Image of revenues tab of the Finance Visualization Tool showing revenues per pupil for public elementary and secondary education in FY 2019 and FY 2020


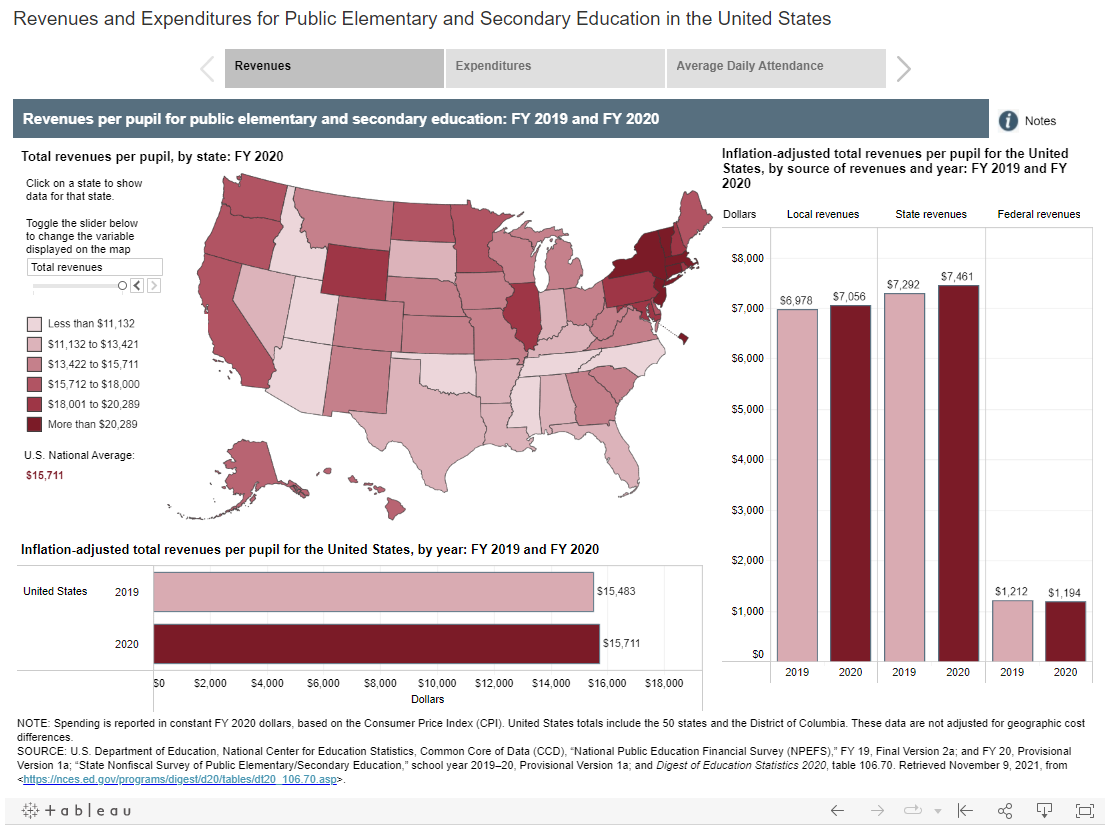
In FY 2020, current expenditures per pupil for the United States were $13,489, up 0.5 percent from FY 2019, after adjusting for inflation. Current expenditures per pupil ranged from $8,287 in Utah to $25,273 in New York. After New York, current expenditures per pupil were highest in the District of Columbia ($23,754), Vermont ($22,124), New Jersey ($21,385), and Connecticut ($20,889). After Utah, current expenditures per pupil were lowest in Idaho ($8,337), Arizona ($8,694), Oklahoma ($9,395), and Nevada ($9,548).

The states with the largest increases in current expenditures per pupil from FY 2019 to FY 2020, after adjusting for inflation, were New Mexico (+9.3 percent), Illinois (+5.7 percent), Kansas (+4.0 percent), Texas (+3.7 percent), and Indiana (+3.7 percent). The states with the largest decreases were Delaware1 (-12.8 percent), Connecticut (-2.7 percent), Arizona (-2.4 percent), Alaska (-2.0 percent), and Arkansas (-1.9 percent).

Average Daily Attendance (ADA)

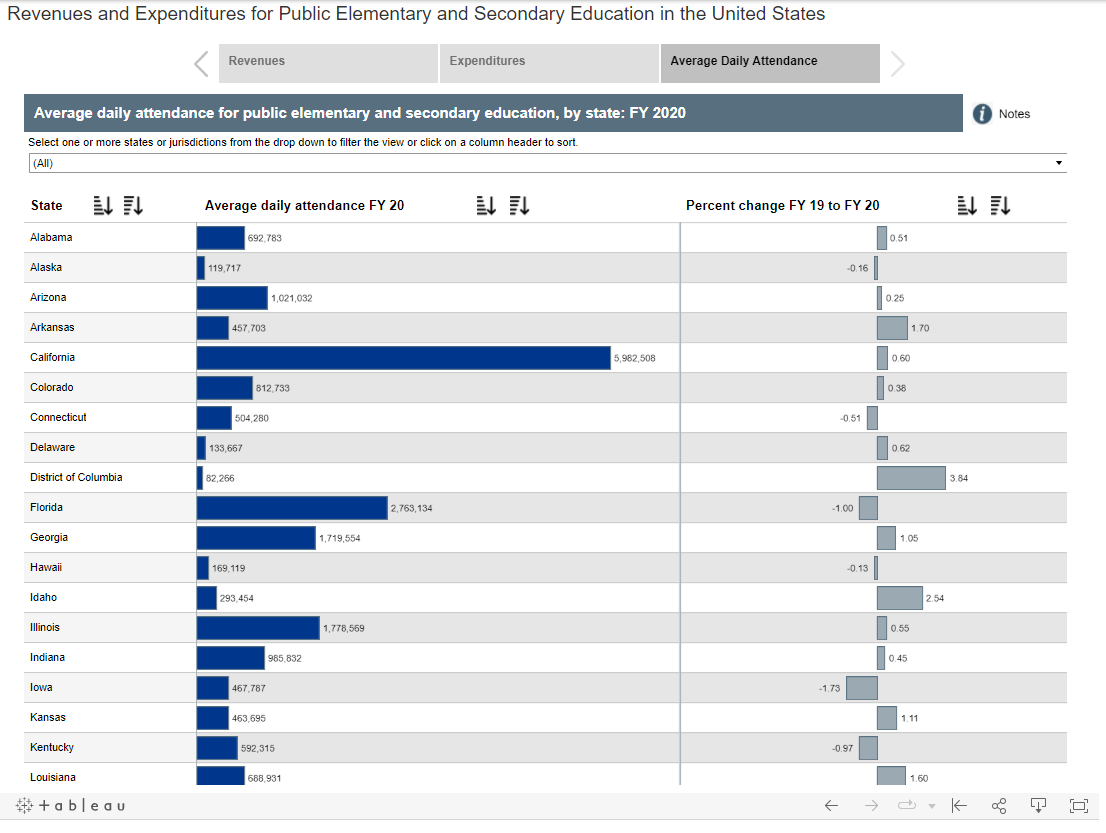
During FY 2020, many school districts across the country closed their school buildings for in-person learning and began providing virtual instruction in an effort to prevent the spread of COVID-19. In order to collect the most consistent and measurable data possible, the U.S. Department of Education provided flexibility for states to report average daily attendance data for the 2019–20 school year.

Between FY 2019 and FY 2020, ADA decreased in 14 states, with the largest decrease at 2.4 percent in New Mexico. ADA increased in the remaining 36 states and the District of Columbia, with the largest increase at 4.1 percent in South Dakota. In 43 states, the ADA in FY 2020 was within 2 percent of the previous year’s ADA.


[click to enlarge image]

Image of Average Daily Attendance tab of the Finance Visualization Tool showing average daily attendance for public elementary and secondary education by state in FY 2020


To explore these and other data on public elementary and secondary revenues, expenditures, and ADA, check out our new data visualization tool.

Be sure to follow NCES on TwitterFacebookLinkedIn, and YouTube and subscribe to the NCES News Flash to stay up-to-date on the latest from the National Public Education Financial Survey.


By Stephen Q. Cornman, NCES, and Malia Howell and Jeremy Phillips, U.S. Census Bureau


[1] In Delaware, the decline in current expenditures per pupil is due primarily to a decrease in the amount reported for employee benefits paid by the state on behalf of local education agencies (LEAs). The state reviewed this decline and provided corrected data that will be published in the final file.

Changes in Pupil/Teacher Ratios in 2020: Impacts of the COVID-19 Pandemic

The COVID-19 pandemic has brought enormous challenges to the education system, including a historic decline in enrollment in fall 2020—the largest since during World War II. Due to the relatively small decrease in the number of teachers, there was a significant drop in the pupil/teacher ratio.  

The National Center for Education Statistics (NCES) releases key statistics, including school staffing data, compiled from state administrative records through the Common Core of Data (CCD). In 2019, about 48 percent of public school staff were teachers (3.2 million) and 13 percent were instructional aides (0.9 million). NCES’s new School Pulse Panel survey found that in January 2022, about 61 percent of public schools with at least one vacancy reported that the pandemic increased the number of teacher and staff vacancies, and 57 percent of schools with at least one vacancy found that the pandemic forced them to use teachers outside their normal duty areas.

Pupil/teacher ratios provide a measure of the quantity of instructional resources available to students by comparing the number of students with the total full-time equivalent (FTE) of all teachers, including special education teachers. The public and private elementary and secondary average class size is larger than the pupil/teacher ratio since it normally does not factor into team teaching, specialty teachers, or special education classes. Between fall 2019 and fall 2020, enrollment in public elementary and secondary schools1 decreased by 2.7 percent.2 This decrease was larger than the 0.2 percent (6,700)3 decrease in the number of public school teachers. Since fall 2020, public school enrollment decreased by a larger amount than did the number of teachers. Thus, the pupil/teacher ratio declined in school year 2020–21 by a relatively large 0.5 pupils per teacher, from 15.9 to 15.4 pupils per teacher (figure 1). This is the largest 1-year decrease in more than 4 decades. In comparison, the pupil/teacher ratio for private schools was 11.4 in 2019–20 (the latest year of actual data available). It is worth noting that pupil/teacher ratios vary across schools with different characteristics (table 208.10).

Viewed over a longer term, the pupil/teacher ratio in public schools in 2019–20 (15.9) was only slightly lower than in 2010–11 (16.0), so nearly all the change during the 2010–11 to 2020–21 period occurred in the last year. The pupil/teacher ratio for private schools decreased from 12.5 in 2010–11 to 11.4 in 2019–20.


Figure 1. Pupil/teacher ratio in public and private elementary and secondary schools: 2010–11 to 2020–21

Line graph showing pupil/teacher ratio in public and private elementary and secondary schools from 2010–11 to 2020–21

NOTE: Data in this figure represent the 50 states and the District of Columbia. Data for teachers are expressed in full-time equivalents (FTE). Counts of private school enrollment include prekindergarten through grade 12 in schools offering kindergarten or higher grades. Counts of private school teachers exclude teachers who teach only prekindergarten students. Counts of public school teachers and enrollment include prekindergarten through grade 12. The pupil/teacher ratio includes teachers for students with disabilities and other special teachers, while these teachers are generally excluded from class size calculations. Ratios for public schools reflect totals reported by states and differ from totals reported for schools or school districts.  The school year 2020–21 pupil/teacher ratio shown in this figure includes only states which reported both membership and FTE teacher counts for SY 2020–21.

SOURCE: U.S. Department of Education, National Center for Education Statistics, Digest of Education Statistics 2021, table 208.20; Common Core of Data, table 2.


The declines in pupil/teacher ratios in public schools were not consistent across states between 2019–20 and 2020–21 (figure 2). The relatively large enrollment decreases in many states—along with the smaller decreases or even increases in the number of teachers in fall 2020—led to decreases in the pupil/teacher ratios for most states. Three states (Nevada, Florida, and Ohio) reported increases in their pupil/teacher ratios, and the rest of the states reporting data had decreases in their pupil/teacher ratios. The states with the largest decreases in their pupil/teacher ratios were Indiana (-1.3 pupils per teacher), Arizona (-1.1 pupils per teacher), Kansas (-0.9 pupils per teacher), and Kentucky (-0.9 pupils per teacher).4


Figure 2. Change in pupil/teacher ratios in public elementary and secondary schools, by state: 2019–20 to 2020–21

Map of United States showing increases and decreases in pupil/teacher ratios in public elementary and secondary schools from 2019–20 to 2020–21

NOTE: Data for Illinois and Utah are not available.

SOURCE: U.S. Department of Education, National Center for Education Statistics, Common Core of Data (CCD), “State Nonfiscal Public Elementary/Secondary Education Survey,” 2019–20 v.1a, table 2, and 2020–21 v.1a, table 2.


By Tom Snyder, AIR


[1] Counts of public school teachers and enrollment include prekindergarten through grade 12.

[2] Enrollment data are for fall of the school year while pupil/teacher ratios are based on school years.

[3] Includes imputed teacher FTE data for Illinois and Utah.

[4] Although Oregon had a 2 pupil per teacher decrease based on the Summary Table 2 for 2019–20 and 2020–21, Oregon did not submit prekindergarten data for 2020–21, so the ratios were not comparable.

National Spending for Public Schools Increases for the Sixth Consecutive Year in School Year 2018–19

NCES just released a finance tables report, Revenues and Expenditures for Public Elementary and Secondary Education: FY19 (NCES 2021-302), which draws from data in the National Public Education Financial Survey (NPEFS). The results show that spending1 on elementary and secondary education increased in school year 2018–19 (fiscal year [FY] 2019), after adjusting for inflation. This is the sixth consecutive year that year-over-year education spending increased since 2012–13. This increase follows declines in year-over-year spending for the prior 4 years (2009–10 to 2012–13).

Current expenditures per pupil2 for the day-to-day operation of public elementary and secondary schools rose to $13,187 in FY19, an increase of 2.1 percent from FY18, after adjusting for inflation (figure 1).3 Current expenditures per pupil also increased over the previous year in FY18 (by 0.9 percent), in FY17 (by 1.7 percent), in FY16 (by 2.8 percent), in FY15 (by 2.7 percent), and in FY14 (by 1.2 percent). In FY19, education spending was 11.8 percent higher than the lowest point of the Great Recession in FY13 and 6.1 percent higher than spending prior to the Great Recession in FY10.


Figure 1. National inflation-adjusted current expenditures per pupil for public elementary and secondary school districts: FY10 through FY19

NOTE: Spending is reported in constant FY19 dollars, based on the Consumer Price Index (CPI).
SOURCE: U.S. Department of Education, National Center for Education Statistics, Common Core of Data (CCD), "National Public Education Financial Survey," fiscal years 2010 through 2018 Final Version 2a; and fiscal year 2019, Provisional Version 1a; and Digest of Education Statistics 2019, retrieved January 8, 2021, from https://nces.ed.gov/programs/digest/d19/tables/dt19_106.70.asp.


Without adjusting for geographic cost differences, current expenditures per pupil ranged from $7,950 in Utah to $24,882 in New York (figure 2). In addition to New York, current expenditures per pupil were highest in the District of Columbia ($22,831), New Jersey ($21,331), Vermont ($21,217), and Connecticut ($21,140). In addition to Utah, current expenditures per pupil were lowest in Idaho ($8,043), Arizona ($8,773), Nevada ($9,126), and Oklahoma ($9,203).


Figure 2. Current expenditures per pupil for public elementary and secondary education, by state: FY19

NOTE: These data are not adjusted for geographic cost differences.
SOURCE: U.S. Department of Education, National Center for Education Statistics, Common Core of Data (CCD), “National Public Education Financial Survey (NPEFS),” FY19, Provisional Version 1a and “State Nonfiscal Survey of Public Elementary/Secondary Education,” school year 2018–19, Provisional Version 1a.


These new NPEFS data offer researchers extensive opportunities to investigate state and national patterns of revenues and expenditures. Explore the report and learn more.


[1] Spending refers to current expenditures. Current expenditures comprise expenditures for the day-to-day operation of schools and school districts for public elementary/secondary education, including expenditures for staff salaries and benefits, supplies, and purchased services. Current expenditures include instruction, instruction-related support services (e.g., social work, health, psychological services), and other elementary/secondary current expenditures but exclude expenditures on capital outlay, other programs, and interest on long-term debt.
[2] Per pupil expenditures are calculated using student membership derived from the State Nonfiscal Survey of Public Elementary/Secondary Education. In some states, adjustments are made to ensure consistency between membership and reported fiscal data. More information on these adjustments can be found in the data file documentation at https://nces.ed.gov/ccd/files.asp.
[3] In order to compare spending from one year to the next, expenditures are converted to constant dollars, which adjusts figures for inflation. Inflation adjustments utilize the Consumer Price Index (CPI) published by the U.S. Department of Labor, Bureau of Labor Statistics. For comparability to fiscal education data, NCES adjusts the CPI from a calendar year to a school fiscal year basis (July through June). See Digest of Education Statistics 2019, table 106.70, retrieved January 8, 2021, from https://nces.ed.gov/programs/digest/d19/tables/dt19_106.70.asp.


By Stephen Q. Cornman NCES; Lei Zhou, Activate Research; and Malia Howell, U.S. Census Bureau

The “Where” of Going to College: Residence, Migration, and Fall Enrollment

Newly released provisional data from the Integrated Postsecondary Education Data System’s (IPEDS) Fall Enrollment (EF) survey provides an updated look at whether beginning college students are attending school in their home state or heading elsewhere.  

In fall 2018, the number of first-time degree/certificate-seeking students enrolled at Title IV postsecondary institutions (beginning college students) varied widely across states, ranging from 3,700 in Alaska to 400,300 in California (figure 1). College enrollment is strongly correlated with the number of postsecondary institutions within each state, as more populous and geographically large states have more institutional capacity to enroll more students. Most states (32 out of 50) and the District of Columbia enrolled fewer than 50,000 beginning college students in fall 2018 and only six states (California, Texas, New York, Florida, Pennsylvania, and Ohio) enrolled more than 100,000 beginning college students.


Figure 1. Number of first-time degree/certificate-seeking undergraduate students enrolled at Title IV institutions, by state or jurisdiction: Fall 2018SOURCE: U.S. Department of Education, National Center for Education Statistics, IPEDS, Spring 2019, Fall Enrollment component (provisional data).


As a result of students migrating outside their home states to attend college, some postsecondary institutions enroll students who are not residents of the same state or jurisdiction in which it is located. Among beginning college students in fall 2018, the share of students who were residents of the same state varied widely, from 31 percent in New Hampshire to 93 percent in Texas and Alaska (figure 2). For a majority of states (27 out of 50), residents comprised at least 75 percent of total beginning college student enrollment. Only three states (Rhode Island, Vermont, and New Hampshire) and the District of Columbia enrolled more nonresidents than residents among their fall 2018 beginning college students.


Figure 2. Percent of first-time degree/certificate-seeking undergraduate students enrolled at Title IV institutions in the state or jurisdiction who are residents of the same state or jurisdiction: Fall 2018

SOURCE: U.S. Department of Education, National Center for Education Statistics, IPEDS, Spring 2019, Fall Enrollment component (provisional data).


States experience varying levels of out-migration (i.e., residents leaving the state to attend college) and in-migration (i.e., nonresidents coming into the state to attend college). For example, in fall 2018, California experienced the largest number of residents out-migrating to attend college in a different state (44,800) but gained 37,800 nonresidents in-migrating to attend college in the state, for an overall negative net migration of beginning college students (figure 3). In contrast, New York also experienced a large number of residents out-migrating for college (33,800) but gained 43,300 nonresidents, for an overall positive net migration of beginning college students.


Figure 3. Number of first-time degree/certificate-seeking undergraduate students at Title IV institutions who migrate into and out of the state or jurisdiction: Fall 2018

NOTE: The migration of students refers to students whose permanent address at the time of application to the institution is located in a different state or jurisdiction than the institution. Migration does not indicate a permanent change of address has occurred. Migration into the state or jurisdiction may include students who are nonresident aliens, who are from the other U.S. jurisdictions, or who reside outside the state or jurisdiction and are enrolled exclusively in online or distance education programs. Migration into the state or jurisdiction does not include individuals whose state or jurisdiction of residence is unknown.

SOURCE: U.S. Department of Education, National Center for Education Statistics, IPEDS, Spring 2019, Fall Enrollment component (provisional data).


Approximately three-quarters of states (37 out of 50) and the District of Columbia had a positive net migration of beginning college students in fall 2018 (figure 4). The remaining one-quarter of states (13 out of 50) had more residents out-migrate for college than nonresidents in-migrate for college, resulting in a negative net migration of beginning college students. Net migration varied widely by state, with New Jersey experiencing the largest negative net migration (28,500 students) and Utah experiencing the largest positive net migration (14,400 students).


Figure 4. Net migration of first-time degree/certificate-seeking undergraduate students at Title IV institutions, by state or jurisdiction: Fall 2018

NOTE: Net migration is the difference between the number of students entering the state or jurisdiction to attend school (into) and the number of students (residents) who leave the state or jurisdiction to attend school elsewhere (out of). A positive net migration indicates more students coming into the state or jurisdiction than leaving to attend school elsewhere.

SOURCE: U.S. Department of Education, National Center for Education Statistics, IPEDS, Spring 2019, Fall Enrollment component (provisional data).


The newly released IPEDS Fall Enrollment data provide tremendous insights into the geographic mobility of beginning college students. Additional analyses on residence and migration can be conducted using the full IPEDS data files. For example, the data can identify to which states and types of institutions beginning college students out-migrate and, conversely, from which states postsecondary institutions recruit their incoming classes.


By Roman Ruiz, AIR