The coronavirus pandemic forced teachers across the world to immediately transition instruction to a virtual setting in early 2020. To understand U.S. teachers’ level of preparedness for this shift in an international context, this blog examines recent international data from U.S. teachers’ responses to questions on the following topics:
- Their perceptions of information and communications technologies (ICT) resources
- Their use of ICT for instruction prior to the pandemic
In general, the results suggest that U.S. teachers are more resourced in ICT than their international peers, and they use ICT at a similar frequency at school when teaching.
Teachers’ perceptions of ICT resources at their school
The quantity and quality of ICT resources available in school systems prior to the coronavirus pandemic may impact teachers’ access to such resources for instructional purposes while classrooms are functioning in a virtual format. The United States participated in the 2018 International Computer and Information Literacy Study (ICILS), which asked questions about ICT resources to a nationally representative sample of eighth-grade teachers from 14 education systems.
The results from this study show that 86 percent of eighth-grade teachers both in the United States and across ICILS 2018 education systems “strongly agreed” or “agreed” that ICT is considered a priority for use in teaching (figure 1). Compared with the ICILS 2018
averages,[1] higher percentages of U.S. eighth-grade teachers “strongly agreed” or “agreed” with various statements about the use of ICT.
While 86 percent of U.S. eighth-grade teachers “strongly agreed” or “agreed” that “ICT is considered a priority for use in teaching,” only 61 percent “strongly agreed” or “agreed” that “there is sufficient opportunity for me to develop expertise in ICT” (figure 1). Additionally, 62 percent of U.S. eighth-grade teachers “strongly agreed” or “agreed” that “there is enough time to prepare lessons that incorporate ICT.” These disparities may have had an impact on teacher capacity during the sudden shift to 100 percent online learning as a result of the coronavirus pandemic, which would be a good topic for future research and analyses.
Figure 1. Percentage of eighth-grade teachers who reported that they “strongly agree” or “agree” with statements about using ICT in teaching at school, by statement: 2018
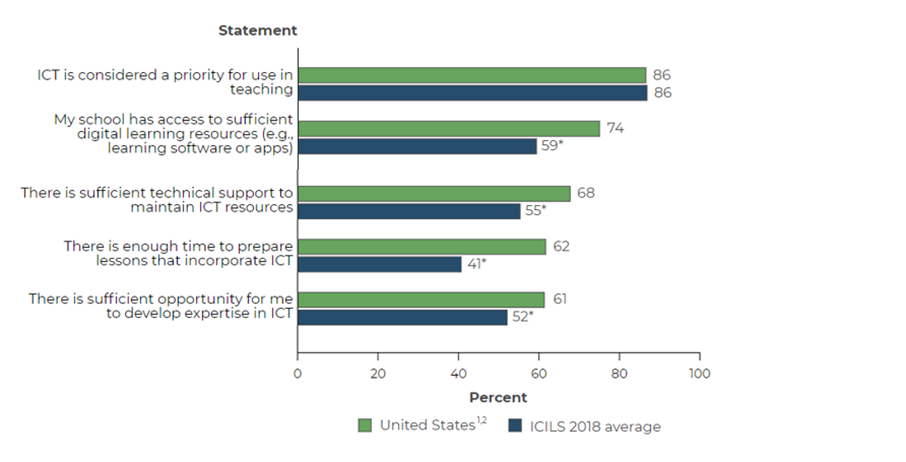 * p < .05. Significantly different from the U.S. estimate at the .05 level of statistical significance.
¹ Did not meet the guidelines for a sample participation rate of 85 percent and not included in the international average.
² National Defined Population covers 90 to 95 percent of National Target Population.
NOTE: ICT = information and communications technologies. The ICILS 2018 average is the average of all participating education systems meeting international technical standards, with each education system weighted equally. Statements are ordered by the percentages of U.S. teachers reporting “strongly agree” or “agree” from largest to smallest.
SOURCE: International Association for the Evaluation of Educational Achievement (IEA), The International Computer and Information Literacy Study (ICILS), 2018. Modified reproduction of figure 17 from U.S. Results from the 2018 ICILS Web Report.
Teachers’ perceptions of the use of ICT for instruction
Teachers’ views on the role of ICT in virtual instruction during the coronavirus pandemic are not yet clear. However, in 2018, when instruction was conducted in physical classrooms, most U.S. eighth-grade teachers participating in ICILS expressed positive perceptions about “using ICT in teaching and learning at school,” as did many teachers internationally.
Among eighth-grade teachers in the United States, 95 percent agreed that ICT “enables students to access better sources of information,” 92 percent agreed that ICT “helps students develop greater interest in learning,” and 92 percent agreed that ICT “helps students work at a level appropriate to their learning needs.” On average across other education systems participating in ICILS, at least 85 percent of teachers agreed with each of these statements (Fraillon et al. 2019).
Seventy-five percent of U.S. eighth-grade teachers in 2018 agreed that ICT “improves academic performance of students,” which was higher than the ICILS international average of 71 percent. The percentages of teachers who agreed with this statement varied across education systems, from three-quarters or more of teachers in Chile, Denmark, Kazakhstan, and Portugal to less than half of teachers in Finland and North Rhine-Westphalia (Germany).
Frequency of teachers’ use of ICT
Teachers’ reported use of ICT for instruction in physical classroom settings may provide insight into their level of experience as they transition to virtual settings during the coronavirus pandemic.
In 2018, half of U.S. eighth-grade teachers reported “using ICT at school when teaching” every day, which was not significantly different from the ICILS average of 48 percent. However, the U.S. percentage was lower than the percentages of teachers in Moscow (76 percent), Denmark (72 percent), and Finland (57 percent) (figure 2).
Figure 2. Percentage of eighth-grade teachers who reported using ICT at school every day when teaching, by education system: 2018
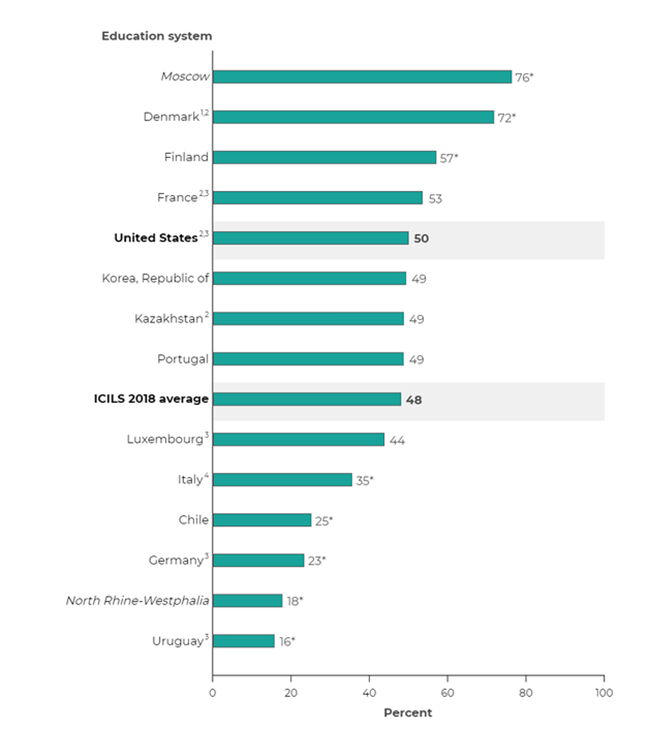
* p < .05. Significantly different from the U.S. estimate at the .05 level of statistical significance.
¹ Met guidelines for sample participation rates only after replacement schools were included.
² National Defined Population covers 90 to 95 percent of National Target Population.
³ Did not meet the guidelines for a sample participation rate of 85 percent and not included in the international average.
⁴ Data collected at the beginning of the school year.
NOTE: ICT = information and communications technologies. The ICILS 2018 average is the average of all participating education systems meeting international technical standards, with each education system weighted equally. Education systems are ordered by their percentages of teachers reporting using ICT at school when teaching from largest to smallest. Italics indicate the benchmarking participants.
SOURCE: International Association for the Evaluation of Educational Achievement (IEA), The International Computer and Information Literacy Study (ICILS), 2018. Modified reproduction of figure 15 from U.S. Results from the 2018 ICILS Web Report.
For more information on teachers and technology, check out NCES’s ICILS 2018 website, the international ICILS website, and the earlier NCES blog “New Study on U.S. Eighth-Grade Students’ Computer Literacy.”
By Amy Rathbun, AIR, and Stephen Provasnik, NCES
[1] The ICILS average is the average of all participating education systems meeting international technical standards, with each education system weighted equally. The United States did not meet the guidelines for a sample participation rate of 85 percent, so it is not included in the international average.
Reference
Fraillon, J., Ainley, J., Schulz, W., Friedman, T., and Duckworth, D. (2019). Preparing for Life in a Digital World: IEA International Computer and Information Literacy Study 2018 International Report. Amsterdam: International Association for the Evaluation of Educational Achievement.