IES Blog

Institute of Education Sciences

Measuring Student Safety: New Data on Bullying Rates at School

NCES is committed to providing reliable and up-to-date national-level estimates of bullying. As such, a new set of web tables focusing on bullying victimization at school was just released.  

These tables use data from the School Crime Supplement to the National Crime Victimization Survey, which collects data on bullying by asking a nationally representative sample of students ages 12–18 who were enrolled in grades 6–12 in public and private schools if they had been bullied at school. This blog post highlights data from these newly released web tables.

Some 19 percent of students reported being bullied during the 2021–22 school year. More specifically, bullying was reported by 17 percent of males and 22 percent of females and by 26 percent of middle school students and 16 percent of high school students. Moreover, among students who reported being bullied, 14 percent of males and 28 percent of females reported being bullied online or by text.

Students were also asked about the recurrence and perpetrators of bullying and about the effects bullying has on them. During the 2021–22 school year, 12 percent of students reported that they were bullied repeatedly or expected the bullying to be repeated and that the bullying was perpetrated by someone who was physically or socially more powerful than them and who was not a sibling or dating partner. When these students were asked about the effects this bullying had on them,

  • 38 percent reported negative feelings about themselves;
  • 27 percent reported negative effects on their schoolwork;
  • 24 percent reported negative effects on their relationships with family and friends; and
  • 19 percent reported negative effects on their physical health.

Explore the web tables for more data on how bullying victimization varies by student characteristics (e.g., sex, race/ethnicity, grade, household income) and school characteristics (e.g., region, locale, enrollment size, poverty level) and how rates of bullying victimization vary by crime-related variables such as the presence of gangs, guns, drugs, alcohol, and hate-related graffiti at school; selected school security measures; student criminal victimization; personal fear of attack or harm; avoidance behaviors; fighting; and the carrying of weapons.

Find additional information on this topic in the Condition of Education indicator Bullying at School and Electronic Bullying. Plus, explore more School Crime and Safety data and browse the Report on Indicators of School Crime and Safety: 2022.

OMB Releases Initial Set of Recommended Revisions to the Federal Race and Ethnicity Standards

Recently, the Office of the Chief Statistician, within the Office of Management and Budget (OMB), released an initial set of recommended revisions for OMB’s Statistical Policy Directive No. 15 (SPD 15), which provides the statistical standards for collecting and reporting race and ethnicity data across federal agencies. The revisions were proposed by an Interagency Technical Working Group.

This is the next step in a process that began last summer with a simple goal: to ensure that the standards better reflect the diversity of the American people. The initial proposals—developed by federal government staff representing more than 20 agencies—include the following:

  • collecting race and ethnicity together with a single question
  • adding a response category for Middle Eastern and North African that is separate and distinct from the “White” category
  • updating SPD 15’s terminology, definitions, and question wording

These recommendations are preliminary—not final—and they do not represent the positions of OMB or the agencies participating in the Working Group.

The Working Group is committed to a full, transparent revision process and remains on track to reach the goal of completing these important revisions by the summer of 2024.

The Working Group Wants to Hear Directly From the American People

The public’s participation in this process will play a critical role in helping the Working Group improve the way federal agencies safely and accurately collect and use information on the race and ethnicity of our diverse population.

Interested stakeholders can read the full Federal Register Notice and provide comments, participate in one of the Working Group’s bi-monthly virtual listening sessions or upcoming virtual town halls, and schedule a listening session.

Be sure to follow NCES on TwitterFacebookLinkedIn, and YouTube and subscribe to the NCES News Flash to receive notifications about the revision process and opportunities to engage with the Working Group.

Knock, Knock! Who’s There? Understanding Who’s Counted in IPEDS

The Integrated Postsecondary Education Data System (IPEDS) is a comprehensive federal data source that collects information on key features of higher education in the United States, including characteristics of postsecondary institutions, college student enrollment and academic outcomes, and institutions’ employees and finances, among other topics.

The National Center for Education Statistics (NCES) has created a new resource page, Student Cohorts and Subgroups in IPEDS, that provides data reporters and users an overview of how IPEDS collects information related to postsecondary students and staff. This blog post highlights key takeaways from the resource page.

IPEDS survey components collect counts of key student and staff subgroups of interest to the higher education community.

Data users—including researchers, policy analysts, and prospective college students—may be interested in particular demographic groups within U.S. higher education. IPEDS captures data on a range of student and staff subgroups, including race/ethnicity, gender, age categories, Federal Pell Grant recipient status, transfer-in status, and part-time enrollment status.

The Outcome Measures (OM) survey component stands out as an example of how IPEDS collects student subgroups that are of interest to the higher education community. Within this survey component, all entering degree/certificate-seeking undergraduates are divided into one of eight subgroups by entering status (i.e., first-time or non-first-time), attendance status (i.e., full-time or part-time), and Pell Grant recipient status.

Although IPEDS is not a student-level data system, many of its survey components collect counts of students and staff by subgroup.

Many IPEDS survey components—such as Admissions, Fall Enrollment, and Human Resources—collect data as counts of individuals (i.e., students or staff) by subgroup (e.g., race/ethnicity, gender) (exhibit 1). Other IPEDS survey components—such as Graduation Rates, Graduation Rates 200%, and Outcome Measures—also include selected student subgroups but monitor cohorts of entering degree/certificate-seeking students over time to document their long-term completion and enrollment outcomes. A cohort is a specific group of students established for tracking purposes. The cohort year is based on the year that a cohort of students begins attending college.


Exhibit 1. IPEDS survey components that collect counts of individuals by subgroup

Table showing IPEDS survey components that collect counts of individuals by subgroup; column one shows the unit of information (student counts vs. staff counts); column two shows the survey component


IPEDS collects student and staff counts by combinations of interacting subgroups.

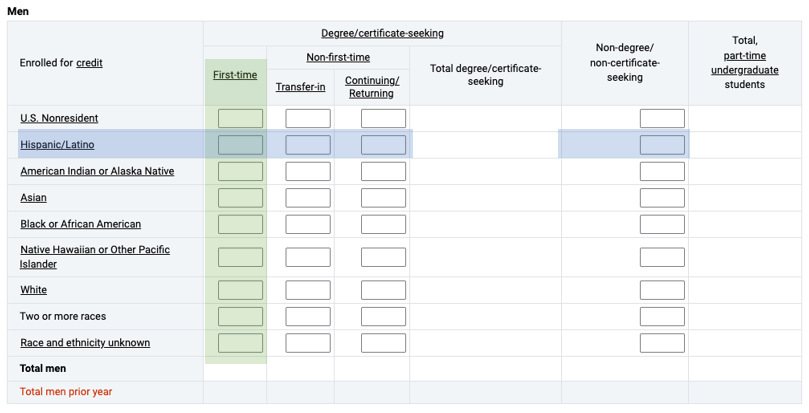
For survey components that collect student or staff counts, individuals are often reported in disaggregated demographic groups, which allows for more detailed understanding of specific subpopulations. For example, the Fall Enrollment (EF) and 12-month Enrollment (E12) survey components collect total undergraduate enrollment counts disaggregated by all possible combinations of students’ full- or part-time status, gender, degree/certificate-seeking status, and race/ethnicity. Exhibit 2 provides an excerpt of the EF survey component’s primary data collection screen (Part A), in which data reporters provide counts of students who fall within each demographic group indicated by the blank cells.


Exhibit 2. Excerpt of IPEDS Fall Enrollment (EF) survey component data collection screen for full-time undergraduate men: 2022­–23

[click image to enlarge]

Image of IPEDS Fall Enrollment survey component data collection screen for full-time undergraduate men in 2022–23

NOTE: This exhibit reflects the primary data collection screen (Part A) for the 2022–23 Fall Enrollment (EF) survey component for full-time undergraduate men. This screen is duplicated three more times for undergraduate students, once each for part-time men, full-time women, and part-time women. For survey materials for all 12 IPEDS survey components, including complete data collection forms and detailed reporting instructions, visit the IPEDS Survey Materials website.


As IPEDS does not collect data at the individual student level, these combinations of interacting subgroups are the smallest unit of information available in IPEDS. However, data users may wish to aggregate these smaller subgroups to arrive at larger groups that reflect broader populations of interest.

For example, using the information presented in exhibit 2, a data user could sum all the values highlighted in the green column to arrive at the total enrollment count of full-time, first-time men. As another example, a data user could sum all the values highlighted in the blue row to determine the total enrollment count of full-time Hispanic/Latino men. Note, however, that many IPEDS data products provide precalculated aggregated values (e.g., total undergraduate enrollment), but data are collected at these smaller units of information (i.e., disaggregated subgroup categories).

Student enrollment counts and cohorts align across IPEDS survey components.

There are several instances when student enrollment or cohort counts reported in one survey component should match or very closely mirror those same counts reported in another survey component. For example, the number of first-time degree/certificate-seeking undergraduate students in a particular fall term should be consistently reported in the Admissions (ADM) and Fall Enrollment (EF) survey components within the same data collection year (see letter A in exhibit 3).


Exhibit 3. Alignment of enrollment counts and cohorts across IPEDS survey components
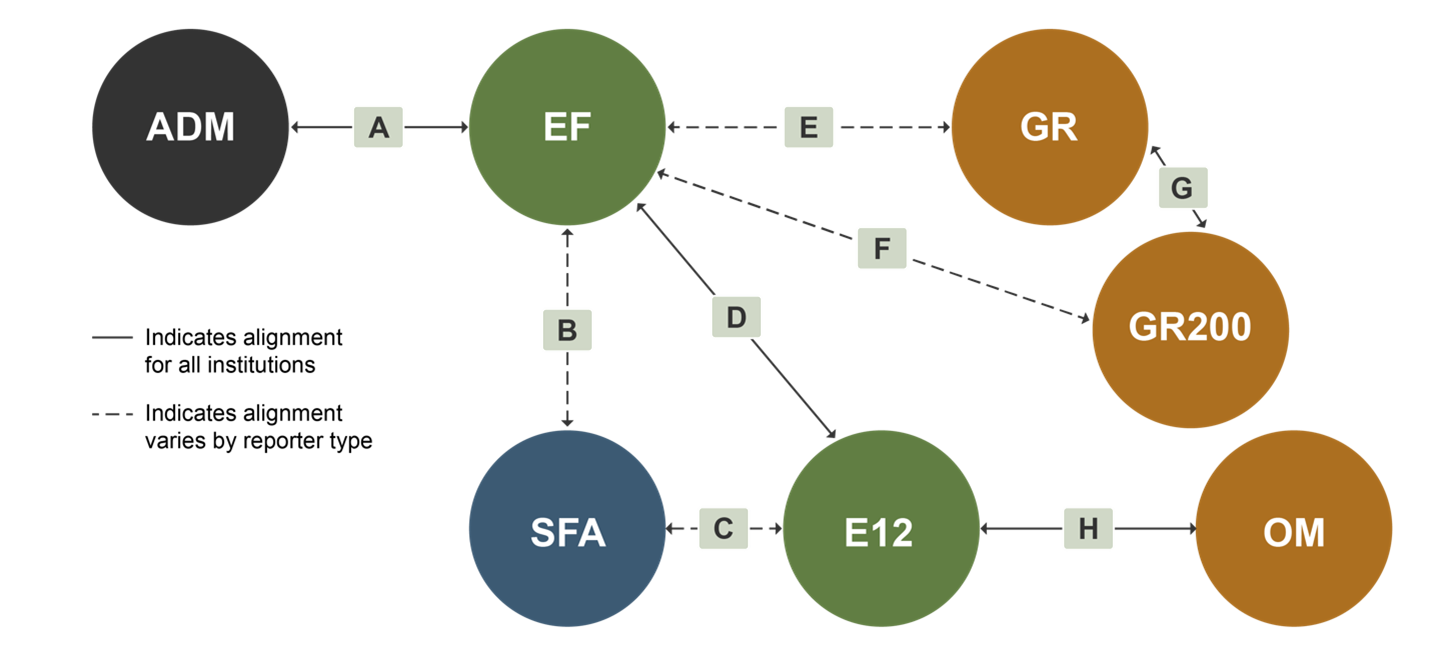
Infographic showing the alignment of enrollment counts and cohorts across IPEDS survey components


For a full explanation of the alignment of student counts and cohorts across IPEDS survey components (letters A to H in exhibit 3), visit the Student Cohorts and Subgroups in IPEDS resource page.

Be sure to follow NCES on TwitterFacebookLinkedIn, and YouTube, follow IPEDS on Twitter, and subscribe to the NCES News Flash to stay up-to-date on IPEDS data releases and resources.


By Katie Hyland and Roman Ruiz, AIR

Summer Learning During the COVID-19 Pandemic

As the school year comes to a close, many families are considering opportunities to continue learning over the summer months. Summer learning has often been seen as a way to supplement instruction during the regular school year. The U.S. Department of Education’s “COVID-19 Handbook” notes that summer learning “can offer another opportunity to accelerate learning, especially for those students most impacted by disruptions to learning during the school year.” Data from the Household Pulse Survey (HPS), which NCES developed in partnership with the U.S. Census Bureau and other federal statistical agencies, explores access to summer learning opportunities by school type, racial/ethnic group, household educational attainment level, and income level.

The HPS1 provides data on how people’s lives have been impacted by the coronavirus (COVID-19) pandemic. Phase 3.2 of the HPS introduced questions on the summer education activities of children enrolled in public or private school or homeschooled, following the end of the normal school year in spring 2021. Adults 18 years old and over who had children under 18 in the home enrolled in school were asked if any of the children had attended a traditional summer school program because of poor grades; attended a summer school program to help catch up with lost learning time during the pandemic; attended school-led summer camps for subjects like math, science, or reading; and/or worked with private tutors to help catch up with lost learning time during the pandemic. Adults were allowed to select all categories that applied. Data from Phase 3.2 of the HPS, covering September 15 to 27, 2021, are discussed in this blog post.

Among adults with children enrolled in public or private school or homeschooled, 26 percent reported children were enrolled in any summer education activities after the end of the normal school year in spring of 2021 (figure 1). The most reported summer education activity was attending a summer school program to catch up on lost learning time during the pandemic (10 percent). Eight percent reported children attended school-led summer camps for subjects like math, science, or reading and 7 percent each reported children attended a traditional summer school program because of poor grades or worked with private tutors to catch up with lost learning time during the pandemic.


Figure 1. Among adults 18 years old and over who had children under age 18 in the home enrolled in school, percentage reporting participation in summer education activities after the end of the normal school year in spring of 2021, by type of summer activity: September 15 to 27, 2021

Bar chart showing percentage of adults 18 years old and over who had children under age 18 in the home enrolled in school reporting participation in summer education activities after the end of the normal school year in Spring of 2021, by type of summer activity, from the September 15 to 27, 2021, phase of the Household Pulse Survey

1 Does not equal the total of the subcategories because respondents could report multiple types of summer education activities.
NOTE: Data in this figure are considered experimental and do not meet NCES standards for response rates. The 2021 Household Pulse Survey, an experimental data product, is an Interagency Federal Statistical Rapid Response Survey to Measure Household Experiences during the coronavirus pandemic, conducted by the U.S. Census Bureau in partnership with 16 other federal agencies and offices. The number of respondents and response rate for the period reported in this table were 59,833 and 5.6 percent. The final weights are designed to produce estimates for the total persons age 18 and older living within housing units. These weights were created by adjusting the household level sampling base weights by various factors to account for nonresponse, adults per household, and coverage. For more information, see https://www.census.gov/programs-surveys/household-pulse-survey/technical-documentation.html. Although rounded numbers are displayed, the figures are based on unrounded data.  
SOURCE: U.S. Department of Commerce, Census Bureau, Household Pulse Survey, September 15 to 27, 2021. See Digest of Education Statistics 2021, table 227.60.


There were no significant differences in the overall percentage of adults reporting any summer education activities for their children by school type (public school, private school, or homeschooled). However, there were differences in the most common type of summer education activity reported for those with children in public school versus private school. Among adults with children in public school, the most reported summer activity was attending a summer school program to catch up with lost learning during the pandemic (11 percent) (figure 2). Among adults with children in private school, higher percentages reported children attended school-led summer camps for subjects like math, science, or reading or worked with private tutors to catch up with lost learning time during the pandemic (11 percent, each), compared with the percentage who reported children attended a traditional summer school program because of poor grades (3 percent). There were no significant differences among adults with homeschooled children by type of summer education activity.


Figure 2. Among adults 18 years old and over who had children under age 18 in the home enrolled in school, percentage reporting participation in summer education activities after the end of the normal school year in spring of 2021, by control of school and type of summer activity: September 15 to 27, 2021

Bar chart showing percentage of adults 18 years old and over who had children under age 18 in the home enrolled in school reporting participation in summer education activities after the end of the normal school year in Spring of 2021, by control of school and type of summer activity, from the September 15 to 27, 2021, phase of the Household Pulse Survey

NOTE: Figure excludes percentage of adults reporting any summer education activities for their children or that their children did not participate in any summer activities. Data in this figure are considered experimental and do not meet NCES standards for response rates. The 2021 Household Pulse Survey, an experimental data product, is an Interagency Federal Statistical Rapid Response Survey to Measure Household Experiences during the coronavirus pandemic, conducted by the U.S. Census Bureau in partnership with 16 other federal agencies and offices. The number of respondents and response rate for the period reported in this table were 59,833 and 5.6 percent. The final weights are designed to produce estimates for the total persons age 18 and older living within housing units. These weights were created by adjusting the household level sampling base weights by various factors to account for nonresponse, adults per household, and coverage. For more information, see https://www.census.gov/programs-surveys/household-pulse-survey/technical-documentation.html. Although rounded numbers are displayed, the figures are based on unrounded data.
SOURCE: U.S. Department of Commerce, Census Bureau, Household Pulse Survey, September 15 to 27, 2021. See Digest of Education Statistics 2021, table 227.60.


Children’s participation in any summer education activities in the summer of 2021 varied across racial/ethnic groups. The percentage of adults reporting any summer activities for their children was higher for Black adults (44 percent) than for all other racial/ethnic groups (figure 3). While lower than the percentage of Black adults reporting any summer activities for their children, the percentages of Asian and Hispanic adults (33 and 32 percent, respectively) were both higher than the percentage of White adults (20 percent).


Figure 3. Among adults 18 years old and over who had children under age 18 in the home enrolled in school, percentage reporting participation in any summer education activities after the end of the normal school year in spring of 2021, by adult’s race/ethnicity: September 15 to 27, 2021

Bar chart showing percentage of adults 18 years old and over who had children under age 18 in the home enrolled in school reporting participation in summer education activities after the end of the normal school year in Spring of 2021, by adult’s race/ethnicity, from the September 15 to 27, 2021, phase of the Household Pulse Survey

1 Includes persons reporting Pacific Islander alone, persons reporting American Indian/Alaska Native alone, and persons of Two or more races.
NOTE: Data in this figure are considered experimental and do not meet NCES standards for response rates. The 2021 Household Pulse Survey, an experimental data product, is an Interagency Federal Statistical Rapid Response Survey to Measure Household Experiences during the coronavirus pandemic, conducted by the U.S. Census Bureau in partnership with 16 other federal agencies and offices. The number of respondents and response rate for the period reported in this table were 59,833 and 5.6 percent. The final weights are designed to produce estimates for the total persons age 18 and older living within housing units. These weights were created by adjusting the household level sampling base weights by various factors to account for nonresponse, adults per household, and coverage. For more information, see https://www.census.gov/programs-surveys/household-pulse-survey/technical-documentation.html. Race categories exclude persons of Hispanic ethnicity.
SOURCE: U.S. Department of Commerce, Census Bureau, Household Pulse Survey, September 15 to 27, 2021. See Digest of Education Statistics 2021, table 227.60.            


There were also some differences observed in reported participation rates in summer education activities by the responding adult’s highest level of educational attainment. Children in households where the responding adult had completed less than high school were more likely to participate in summer education activities (39 percent) than were those in households where the responding adult had completed some college or an associate’s degree (25 percent), a bachelor’s degree (22 percent), or a graduate degree (25 percent) (figure 4). Similarly, children in households where the responding adult had completed high school2 were more likely to participate in summer education activities (28 percent) than were those in households where the responding adult had completed a bachelor’s degree (22 percent). There were no significant differences in children’s participation rates between other adult educational attainment levels.


Figure 4. Among adults 18 years old and over who had children under age 18 in the home enrolled in school, percentage reporting participation in any summer education activities after the end of the normal school year in spring of 2021, by adult’s highest level of educational attainment: September 15 to 27, 2021

Bar chart showing percentage of adults 18 years old and over who had children under age 18 in the home enrolled in school reporting participation in summer education activities after the end of the normal school year in Spring of 2021, by adult’s highest level of educational attainment, from the September 15 to 27, 2021, phase of the Household Pulse Survey

1 High school completers include those with a high school diploma as well as those with an alternative credential, such as a GED.
NOTE: Data in this figure are considered experimental and do not meet NCES standards for response rates. The 2021 Household Pulse Survey, an experimental data product, is an Interagency Federal Statistical Rapid Response Survey to Measure Household Experiences during the coronavirus pandemic, conducted by the U.S. Census Bureau in partnership with 16 other federal agencies and offices. The number of respondents and response rate for the period reported in this table were 59,833 and 5.6 percent. The final weights are designed to produce estimates for the total persons age 18 and older living within housing units. These weights were created by adjusting the household level sampling base weights by various factors to account for nonresponse, adults per household, and coverage. For more information, see https://www.census.gov/programs-surveys/household-pulse-survey/technical-documentation.html. Although rounded numbers are displayed, the figures are based on unrounded data.  
SOURCE: U.S. Department of Commerce, Census Bureau, Household Pulse Survey, September 15 to 27, 2021. See Digest of Education Statistics 2021, table 227.60


The percentage of adults reporting that children participated in summer education activities also varied across households with different levels of income in 2020. The percentages of adults reporting that children participated in any summer education activities were higher for those with a 2020 household income of less than $25,000 (34 percent) and $25,000 to $49,999 (33 percent) than for all other higher household income levels. There were no significant differences in reported participation rates among adults with 2020 household income levels of $50,000 to $74,999, $75,000 to $99,999, $100,000 to $149,999, and $150,000 or more.

Learn more about the Household Pulse Survey and access data tables, public use files, and an interactive data tool. For more detailed data on the summer education activities discussed in this blog post, explore the Digest of Education Statistics, table 227.60. To access other data on how the COVID-19 pandemic has impacted education, explore our School Pulse Panel dashboard.

Be sure to follow us on Twitter, Facebook, LinkedIn, and YouTube to stay up-to-date on the latest findings and trends in education, including those on summer learning activities.


By Ashley Roberts, AIR


[1] The speed of the survey development and the pace of the data collection efforts led to policies and procedures for the experimental HPS that were not always consistent with traditional federal survey operations. For example, the timeline for the surveys meant that opportunities to follow up with nonrespondents were very limited. This has led to response rates of 1 to 10 percent, which are much lower than the typical target response rate set in most federal surveys. While the responses have been statistically adjusted so that they represent the nation and states in terms of geographic distribution, sex, race/ethnicity, age, and educational attainment, the impact of survey bias has not been fully explored.

[2] High school completers include those with a high school diploma as well as those with an alternative credential, such as a GED.

Research Roundup: NCES Celebrates Black History Month

Looking at data by race and ethnicity can provide a better understanding of education performance and outcomes than examining statistics that describe all students. In observation of Black History Month, this blog presents NCES findings on the learning experiences of Black students throughout their education careers as well as the characteristics of Black teachers and faculty.

K–12 Education

  • Students
    • Of the 49.4 million students enrolled in public preK–12 schools in fall 2020, 7.4 million were Black students. 


    • In 2019–2020, some 9 percent of private school students were Black non-Hispanic.
       
    • In 2019, some 51 percent of Black 8th-grade students were in a school that reported offering a programming class. Eighty-four percent of Black 8th-grade students were in a school that offered algebra classes that were equivalent to high school algebra classes.
       
  • Teachers
    • In 2017–18, about 7 percent of all public school teachers self-identified as Black, compared with 3 percent of all private school teachers.
       
    • Twelve percent of all female career or technical education (CTE) public school teachers were Black women in 2017–18.
       
    • In 2017–18, about half of Black or African American teachers (51 percent) taught in city schools, compared with 31 percent of all teachers. 
       
    • Black or African American teachers had a higher rate of post-master’s degree education (13 percent) than did all teachers (9 percent) in 2017–18.
       
    • In 2017–18, about two-thirds (66 percent) of Black or African American teachers taught in the South, compared with 39 percent of all teachers.


Postsecondary Education

  • Students
    • Female enrollment at HBCUs has been higher than male enrollment in every year since 1976.
       
    • In fall 2019, nearly 2.5 million Black students were enrolled in a degree-granting postsecondary institution, compared with the 1.0 million who were enrolled in fall 1976.
       
    • In 2019–20, postsecondary institutions awarded 55,642 STEM degrees/certificates to Black students.


  • Faculty and Institutions
    • In fall 2019, there were 27,323 full-time Black female faculty members at degree-granting postsecondary institutions, compared with 19,874 Black male faculty members.
       
    • In fall 2020, there were 101 degree-granting Historically Black Colleges and Universities (HBCUs) located in the 50 states, D.C., and the U.S. Virgin Islands—52 public institutions and 49 private nonprofit institutions.
       

By Kyle Argueta, AIR