IES Blog

Institute of Education Sciences

Public Charter School Expenditures by School Level

How do we achieve the best education results for the best price? This is a central question among researchers and policymakers alike. In this blog post, we share outcomes from school year 2017–18 concerning public charter school spending at the elementary, middle, and high school levels to help inform the discussion on charter school costs and benefits to the broader education system.

The first modern charter law in the United States was passed in Minnesota in 1991. Since that time, the number of charter schools has grown tremendously as an option in public elementary and secondary education. In 2017–18, the United States had 7,086 public charter schools in 44 states and the District of Columbia. In a decade, from 2007–08 to 2017–18, the number of public charter schools in the United States increased more than 70 percent, representing a little more than 7 percent of all public schools at the end of this time period (figure 1).


Figure 1. Number of public charter schools in the United States: School years 2007–08 through 2017–18

Line graph showing the number of public charter schools in the United States for school years 2007–08 through 2017–18

NOTE: These data include counts of operational public elementary/secondary charter schools for the 50 states and the District of Columbia.
SOURCE: U.S. Department of Education, National Center for Education Statistics, Common Core of Data (CCD), 2007–08 through 2017–18.


Nearly half (47 percent) of all public charter schools in the United States are classified as elementary schools, 11 percent are classified as middle schools, and 28 percent are classified as high schools (figure 2). The remainder (14 percent) have other grade-level configurations and do not fall into any of these categories.


Figure 2. Percentage of public charter schools in the United States, by school level: School year 2017–18

Pie chart showing percentage of public charter schools in the United States, by school level (elementary, middle, high, and other) for school year 2017–18

NOTE: These data reflect operational public elementary/secondary charter schools for the 50 states and the District of Columbia from the Common Core of Data (CCD) for 2017. School-level categories are taken from the Documentation to NCES’ Common Core of Data for school year 2017–18, whereby “Elementary” includes schools with students enrolled in grades K–4 that offer more elementary grades than middle grades; “Middle” includes schools with students enrolled in grades 5–8 that offer more middle grades than elementary or secondary grades; “High” includes schools with students enrolled in grade 12 and other secondary grades that offer more high grades than middle grades; and “Other” includes schools with both elementary and high grades or grades at all three levels (elementary, middle, and high). Excludes 2,360 schools categorized in the CCD as adult education, not applicable, not reported, prekindergarten-only, secondary, and ungraded.
SOURCE: U.S. Department of Education, National Center for Education Statistics, Civil Rights Data Collection (CRDC), 2017–18.


According to expenditure data captured in the Civil Rights Data Collection (CRDC), public schools in the United States spent $330.94 billion in 2017–18, or more than $6,600 per pupil. Reports of national school expenditures based on data from the CRDC are significantly lower than those estimated using the National Public Education Financial Survey (NPEFS) from the Common Core of Data (CCD). This could be attributed to data on spending for school nutrition, operations and maintenance, and transportation being captured in the NPEFS but not collected in the CRDC. However, the CRDC data allow for comparisons of public charter and noncharter schools at the school level. In 2017–18, spending among public noncharter schools fell just under the national average of $6,500 per pupil. Like other schools in the U.S. public school system, charter schools do not charge tuition and instead receive district and state funding based on their enrollment. Public charter schools spent more than $26.83 billion in 2017–18, or just more than $8,900 per pupil, thus exceeding the national average.

The per pupil school expenditures of public charter schools across school levels1 are different from those of public noncharter schools. This analysis compares spending between public elementary, middle, and high schools in 2017–18. (Mixed-level and other schools are excluded because they have variable grade levels and other characteristics that can make expenditures incomparable across school types.) Across school levels, per pupil expenditures among public charter schools exceeded the national average, while per pupil expenditures among public noncharter schools were closer to the national average. Specifically, for public charter schools, per pupil expenditures were highest for elementary schools ($8,400), followed by high schools ($8,200) and middle schools ($8,100) (figure 3). However, for public noncharter schools, per pupil expenditures were highest for high schools ($6,600), followed by elementary schools ($6,400) and middle schools ($6,100).


Figure 3. Per pupil public school expenditures, by public charter school status and school level: School year 2017–18  

Horizontal stacked bar chart showing per pupil public school expenditures, by public charter school status and school level, for school year 2017–18


NOTE: Rounded to nearest multiple of 100. Analytical universe restricted to charter schools in both the CRDC and CCD that could be linked or matched using unique identification numbers.
SOURCE: U.S. Department of Education, National Center for Education Statistics, Civil Rights Data Collection (CRDC), 2017–18.


The CRDC splits school expenditures into personnel or staff expenditures (e.g., salaries of teachers and of instructional, support, and administrative staff) and nonpersonnel expenditures (e.g., the cost of books, computers, instructional supplies, and professional development for teachers). (Nonpersonnel expenditures do not include those for school nutrition, operations, maintenance, or transportation to and from school.) Figures 4 and 5 show that across school levels in 2017–18, both public charter and noncharter schools tended to spend more per pupil on salaries and less per pupil on nonpersonnel expenditures. The differences between public charter and noncharter schools are particularly noticeable in comparisons of nonpersonnel expenditures, where charter schools spent considerably more per pupil than noncharter schools, most prominently at the elementary school level ($3,400 vs. $800). The figures also show that among public charter schools, middle schools had higher salary expenditures but lower nonpersonnel expenditures than did elementary or high schools. These findings demonstrate the importance of considering school level when examining public charter school spending.


Figure 4. Per pupil public school salary expenditures, by public charter school status and school level: School year 2017–18

Horizontal stacked bar chart showing per pupil public school salary expenditures, by public charter school status and school level, for school year 2017–18

NOTE: Rounded to nearest multiple of 100. Analytical universe restricted to charter schools in both the CRDC and CCD that could be linked or matched using unique identification numbers.
SOURCE: U.S. Department of Education, National Center for Education Statistics, Civil Rights Data Collection (CRDC), 2017–18.


Figure 5. Per pupil public school nonpersonnel expenditures, by public charter school status and school level: School year 2017–18

Horizontal stacked bar chart showing per pupil public school nonpersonnel expenditures, by public charter school status and school level, for school year 2017–18

NOTE: Rounded to nearest multiple of 100. Analytical universe restricted to charter schools in both the CRDC and CCD that could be linked or matched using unique identification numbers.
SOURCE: U.S. Department of Education, National Center for Education Statistics, Civil Rights Data Collection (CRDC), 2017–18.


Thoughts for Future Research

Since 2009, the CRDC—a mandatory data collection—has collected school expenditure data from elementary and secondary public schools and school districts. The 2017–18 findings suggest that public charter schools spent nearly 200 to 300 percent more on nonpersonnel expenditures per pupil than did public noncharter schools. However, there are concerns about districts’ ability to accurately report school expenditure data, including those for public charter schools. While the CRDC is currently the only complete national database of school-level spending, the CCD has partial school-level fiscal data for about 30 states, and NCES is making an effort to increase this voluntary reporting. Future studies could include a more targeted analysis of spending among public charter schools by geographic settings, student enrollee characteristics, school size, and school type.

Civil Rights Data Collection

Since 1968, the U.S. Department of Education has collected data on key education and civil rights issues in our nation’s public schools. The CRDC collects a variety of information, including data on student enrollment and educational programs and services, most of which is disaggregated by race/ethnicity, sex, limited English proficiency, and disability. The CRDC informs the Office of Civil Rights’ overall strategy for administering and enforcing the civil rights statutes for which it is responsible. The CRDC collects data only from public schools (i.e., no data are collected from private schools). The CRDC data files can be found here: https://ocrdata.ed.gov/.


By Jennifer Hudson, Ph.D., and Jennifer Sable (AIR) and Christopher D. Hill, Ph.D. (NCES)


[1] For the purposes of this blog post, school-level categories are taken from the Documentation to NCES’ Common Core of Data for SY 2017–18:  “Elementary” includes schools with students enrolled in grades K through 4 that offer more elementary grades than middle grades. “Middle” includes schools with students enrolled in grades 5 through 8 that offer more middle grades than elementary or secondary grades. “High” include schools with students enrolled in grade 12 and other secondary grades that offer more high grades than middle grades.  “Other” includes schools with both elementary and high grades or grades at all three levels (elementary, middle, and high).

Celebrating National Principals Month With the National Teacher and Principal Survey (NTPS)

October is National Principals Month. Whether developing a long-term strategic vision or carrying out the day-to-day management of school operations, our nation’s principals and school administrators are essential leaders in our children’s education. This blog provides information about the backgrounds of our public school principals, including the education that they received. Data are drawn from the 2017–18 National Teacher and Principal Survey (NTPS).

The NTPS collects information about school conditions and the demographics of K–12 public and private school teachers and principals directly from the school staff themselves. Data are available both nationally and by state (via the NTPS State Dashboard) and are used by policymakers and researchers to make funding and other policy decisions.


Demographics and Characteristics of Principals

  • In the 2017–18 school year, 1 percent of all public school principals were Asian, 11 percent were Black or African American, 9 percent were Hispanic, regardless of race,1 less than 1 percent were Native Hawaiian or other Pacific Islander, 78 percent were White, and 2 percent were Other2 races.
     
  • Seventy-nine percent of all principals in traditional public schools were White, compared with 67 percent of principals in public charter schools (figure 1).
     
  • Fifty-four percent of all public school principals were female. A higher percentage of primary school principals were female (67 percent) than were middle school (40 percent), high school (33 percent), or combined school (43 percent) principals.  

Figure 1. Percentage of school principals, by race/ethnicity and school type: 201718


Educational Attainment and Professional Experiences of Principals

NCES would like to thank every principal and administrator whose guidance and determination advances successes for public school students across the United States each and every day.

The data in this blog would not be possible without the participation of teachers, principals, and school staff in the NTPS. We have recently concluded the 2020–21 NTPS; to learn more about teachers’ and principals’ experiences during the coronavirus pandemic, please stay tuned for an upcoming report.

If you or your school was contacted about participating in the 2021–22 Teacher Follow-up Survey (TFS) or Principal Follow-up Survey (PFS) and you have questions, please email ntps@census.gov or call 1-888-595-1338.

For more information about the National Teacher and Principal Survey (NTPS), please visit https://nces.ed.gov/surveys/ntps/. More findings and details are available in the NTPS schoolteacher, and principal reports.


By Julia Merlin, NCES


[1] Principals who selected Hispanic, which includes Latino, as their ethnicity are referred to as Hispanic regardless of race. All other race categories in this blog exclude persons of Hispanic ethnicity.

[2] Other includes American Indian/Alaska Native and Two or more races.

[3] For the 2017–18 NTPS, the last school year was the 2016–17 school year.

New Report on School Choice in the United States

Across the United States, parents have an increasing number of educational options for their children, including traditional public schools, public charter schools, private schools, and homeschooling. Although the majority of students attend traditional public schools, the numbers of students attending public charter schools or homeschool programs are growing, according to recently released data.

Using survey data from the National Center for Education Statistics (NCES), the newly released School Choice in the United States: 2019 report provides information on student enrollment; individual, family, and school characteristics of students enrolled in different educational settings; achievement; school crime and safety; and differences in the school choice options that parents select and their satisfaction with their children’s school.


School Enrollment Trends

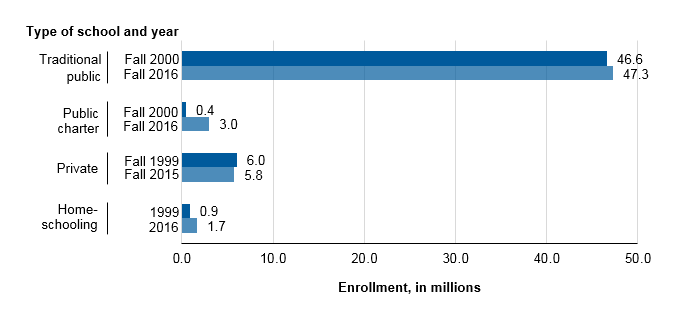
Over time, the numbers of students enrolled in traditional public schools, public charter schools, and homeschool programs have increased (see figure 1). Enrollment in traditional public schools was 1 percent higher in fall 2016 (47.3 million) than in fall 2000 (46.6 million). 

Public charter schools grew at a much more rapid rate in that time, with enrollment increasing by more than 500 percent, from 0.4 million in fall 2000 to 3.0 million in fall 2016. Enrollment in homeschool programs has also grown, nearly doubling from 1999 (0.9 million) to 2016 (1.7 million). However, private school enrollment fell 4 percent between fall 1999 and fall 2015.


Figure 1. Enrollment in traditional public schools, public charter schools, private schools, and homeschooling
SOURCE: U.S. Department of Education, National Center for Education Statistics, Common Core of Data (CCD), “Public Elementary/Secondary School Universe Survey,” 2000–01 and 2016–17; Private School Universe Survey (PSS), 1999–2000 and 2015–16; Parent Survey and Parent and Family Involvement in Education Survey of the National Household Education Surveys Program (Parent-NHES:1999 and PFI-NHES:2016).


Student and School Characteristics

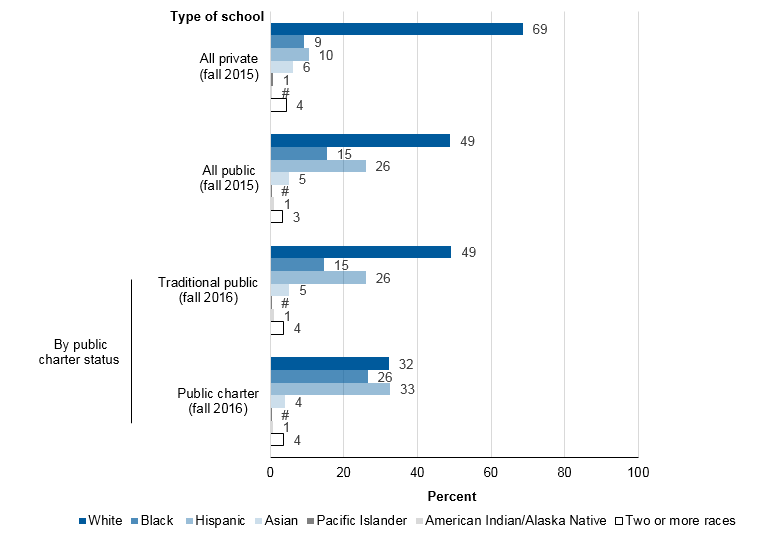
This report also explores enrollment in different school options across a range of characteristics, including students’ racial/ethnic background (see figure 2), family composition, household poverty status, parent education and employment, and more.

For example, public schools enrolled higher percentages of Black and Hispanic students than did private schools in fall 2015. Within the public school sector, public charter schools enrolled higher percentages of Black and Hispanic students and lower percentages of White and Asian/Pacific Islander students than did traditional public schools in fall 2016. And, the percentages of students who were homeschooled in 2016 were higher for White and Hispanic students than for Black and Asian students.


Figure 2. Percentage distribution of elementary and secondary enrollment, by school type and student race/ethnicity: 2015 and 2016
 

#Rounds to zero.
NOTE: Figure excludes homeschooled children. Race categories exclude persons of Hispanic ethnicity. Although rounded numbers are displayed, the figures are based on unrounded data. Detail may not sum to totals because of rounding.
SOURCE: U.S. Department of Education, National Center for Education Statistics, Private School Universe Survey (PSS), 2015–16; and Common Core of Data (CCD), "Public Elementary/Secondary School Universe Survey," 2016–17.


In 2016, about 58 percent of public charter school students were enrolled in schools in cities, compared with 29 percent of traditional public school students; traditional public school students were more likely than public charter school students to attend schools in suburban areas, towns, and rural areas.

In 2015, about 43 percent of private school students were enrolled in schools in cities, and 40 percent were enrolled in schools in suburban areas. However, homeschooling in 2016 was more prevalent among students in rural areas than among those in cities and suburban areas.


Parental Choice

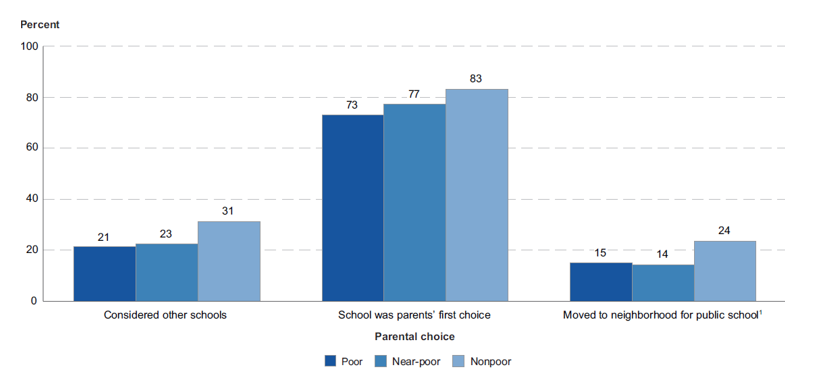
In 2016, parents whose children were enrolled in public or private schools were asked about their decisions regarding school choice. Twenty-eight percent of students had parents who reported that they had considered schools other than the one in which their children were currently enrolled, and 80 percent had parents who reported that their children’s current school was their first choice. Among public school students, 20 percent had parents who reported they moved to their current neighborhood so their children could attend their current public school.

Each of these percentages was higher for students from nonpoor households than for students from near-poor or poor households (see figure 3). For example, 31 percent of students in nonpoor households had parents who reported that they considered other schools for their children, compared with 23 percent of students in near-poor households and 21 percent of students in poor households.


Figure 3. Percentage of students enrolled in grades 1 through 12 whose parents considered other schools, reported current school was their first choice, or moved to their current neighborhood for the public school, by family poverty status: 2016
1 Includes public school students only. Private school students are excluded.
NOTE: Data exclude homeschooled children.
SOURCE: U.S. Department of Education, National Center for Education Statistics, Parent and Family Involvement Survey of the National Household Education Surveys Program (PFI-NCES:2016).


Browse the full School Choice in the United States: 2019 report to learn more about these and other trends related to school choice and student enrollment.


By Amy Rathbun and Ke Wang, AIR

New Data Available on Crime and Safety in Public Schools

The prevalence of crime in America’s public schools continues to be a topic of much concern and discussion among parents, students, educators, and policymakers. A new report from the National Center for Education Statistics (NCES) provides the latest data to help inform conversations and debate about school safety.

The report, Crime, Violence, Discipline, and Safety in U.S. Public Schools, presents new information from the 2017–18 School Survey on Crime and Safety (SSOCS). SSOCS is a nationally representative survey of school principals that collects detailed information on both incidents of crime in U.S. public schools and the practices and programs schools have implemented to promote school safety.

This report presents selected findings on a wide range of topics, including violent and nonviolent incidents, disciplinary problems and actions, security measures, security staff, mental health services, and limitations on crime prevention. In addition to presenting updates for data that have been published in prior SSOCS reports, the new report highlights topics not covered in previous reports, including the number of incidents involving the use or possession of a firearm or explosive device at school as well as the percentage of schools that have “panic buttons” or silent alarms that directly connect to law enforcement in the event of an incident.

Data on both school crime incidents and school safety practices are available by various school characteristics, such as school type, enrollment size, and locale (i.e., whether the school is located in an urban, suburban, or rural area).  

One key finding highlighted in the report is that most schools have written plans for various emergency scenarios. In school year 2017–18, the most common types of plans reported were for responses to natural disasters (94 percent), active shooters (92 percent), and bomb threats or incidents (91 percent).


The report also presented other key findings from the 2017–18 school year:

  • Seventy-one percent of U.S. public schools reported that at least one violent incident occurred at school during the school year.
  • Three percent of schools reported that there was at least one incident involving the possession of a firearm or explosive device at their school.
  • Forty-six percent of traditional public schools had a school resource officer present at school at least once a week, compared with only 19 percent of charter schools. Conversely, a higher percentage of charter schools than of traditional public schools had a security guard or other security personnel present at least once a week (35 vs. 21 percent).
  • Restorative circles were used more frequently in schools with a higher enrollment of minority students. A restorative circle is a formal mediation process led by a facilitator who brings affected parties of a problem together to explore what happened, reflect on their roles, and find solutions that address individual and community concerns. Among schools with at least 50 percent minority enrollment, half (50 percent) reported involving students in restorative circles. However, in schools with lower minority enrollment (20 to 50 percent), a lower percentage of schools reported involving students in restorative circles (38 percent).
  • Fifty-one percent of schools provided diagnostic mental health assessments to evaluate students for mental health disorders, and 38 percent provided treatment to students for mental health disorders.

To access the full report, please visit https://nces.ed.gov/pubs2019/2019061.pdf. SSOCS:2018 data files will be released later this year. Due to the sensitive nature of SSOCS data, researchers must apply for a restricted-use license to access the full SSOCS:2018 restricted-use data file. A public-use data file—with some sensitive variables removed—will be released after the restricted-use data file.


By Sam Correa and Melissa Diliberti (AIR) and Rachel Hansen (NCES)


Revenues and Expenditures for Public Schools Rebound for Third Consecutive Year in School Year 2015–16

Revenues and expenditures per pupil on elementary and secondary education increased in school year 2015–16 (fiscal year [FY] 2016), continuing a recent upward trend in the amount of money spent on public preK–12 education. This is the third consecutive year that per pupil revenues and expenditures have increased, reversing three consecutive years of declines in spending between FY 10 and FY 13 after adjusting for inflation. The findings come from the recently released Revenues and Expenditures for Public Elementary and Secondary School Districts: School Year 2015–16 (Fiscal Year 2016).


The national median of total revenues across all school districts was $12,953 per pupil in FY 16, reflecting an increase of 3.2 percent from FY 15, after adjusting for inflation.[1] This increase in revenues per pupil follows an increase of 2.0 percent for FY 15 and 1.6 percent for FY 14. These increases in revenues per pupil between FY 14 and FY 16 contrast with the decreases from FY 10 to FY 13. The national median of current expenditures per pupil was $10,881 in FY 16, reflecting an increase of 2.4 percent from FY 15. Current expenditures per pupil also increased in FY 15 (1.7 percent) and FY 14 (1.0 percent). These increases in median revenues and current expenditures per pupil between FY 14 and FY 16 represent a full recovery in education spending following the decreases from FY 10 to FY 13.

The school district finance data can help us understand differences in funding levels for various types of districts. For example, median current expenditures per pupil in independent charter school districts were lower than in noncharter and mixed charter/noncharter school districts in 21 out of the 25 states that were able to report finance data for independent charter school districts. Three of the 4 states where median current expenditures were higher for independent charter school districts had policies that affected charter school spending. The new School District Finance Survey (F-33) data offer researchers extensive opportunities to investigate local patterns of revenues and expenditures and how they relate to conditions for other districts across the country.


By Stephen Q. Cornman, NCES; Malia Howell, Stephen Wheeler, and Osei Ampadu, U.S. Census Bureau; and Lei Zhou, Activate Research


[1] In order to compare from one year to the next, revenues are converted to constant dollars, which adjusts figures for inflation. Inflation adjustments use the Consumer Price Index (CPI) published by the U.S. Department of Labor, Bureau of Labor Statistics. For comparability to fiscal education data, NCES adjusts the CPI from a calendar year basis to a school fiscal year basis (July through June). See Digest of Education Statistics 2016, table 106.70, https://nces.ed.gov/programs/digest/d16/tables/dt16_106.70.asp.