IES Blog

Institute of Education Sciences

Education at a Glance 2023: Putting U.S. Data in a Global Context

International comparisons provide reference points for researchers and policy analysts to understand trends and patterns in national education data and are very important as U.S. students compete in an increasingly global economy.

Education at a Glance (EAG), an annual publication produced by the Organization for Economic Cooperation and Development (OECD), provides data on the structure, finances, and progress of education systems in 38 OECD countries—including the United States—as well as a number of OECD accession and partner countries. Data presented in EAG on topics of high policy interest in the United States are also featured in NCES reports, including the Condition of Education and Digest of Education Statistics.  

The recently released 2023 edition of EAG shows that the United States is above the international average on some measures, such as funding of postsecondary education, but lags behind in others, such as participation in early childhood education and care (ECEC). The 2023 report also features a Spotlight on Vocational Education and Training as well as interactive data dashboards on ECEC systems, upper secondary education systems, and educational support for Ukrainian refugees.


Spotlight on Vocational Education and Training (VET)

Each EAG edition centers on a particular theme of high policy relevance in OECD countries. The focus of this year’s report is VET programs, which look very different in the United States compared with many other OECD countries. Unlike in many OECD countries, most high schools in the United States do not offer a separate, distinct vocational track at the upper secondary (high school) level. Instead, vocational education is available as optional career and technical education (CTE) courses throughout high school. Regardless of whether they choose to take CTE courses, all U.S. students who complete high school have the same potential to access postsecondary programs. In other OECD countries, selecting a vocational track at this level may lead to different postsecondary opportunities. Check out the 2023 EAG Spotlight for an overview of VET programs across OECD countries.


Highlights From EAG 2023

Below is a selection of topics from the EAG report highlighting how key education benchmarks in the United States compare with other OECD countries.


Postsecondary Educational Attainment

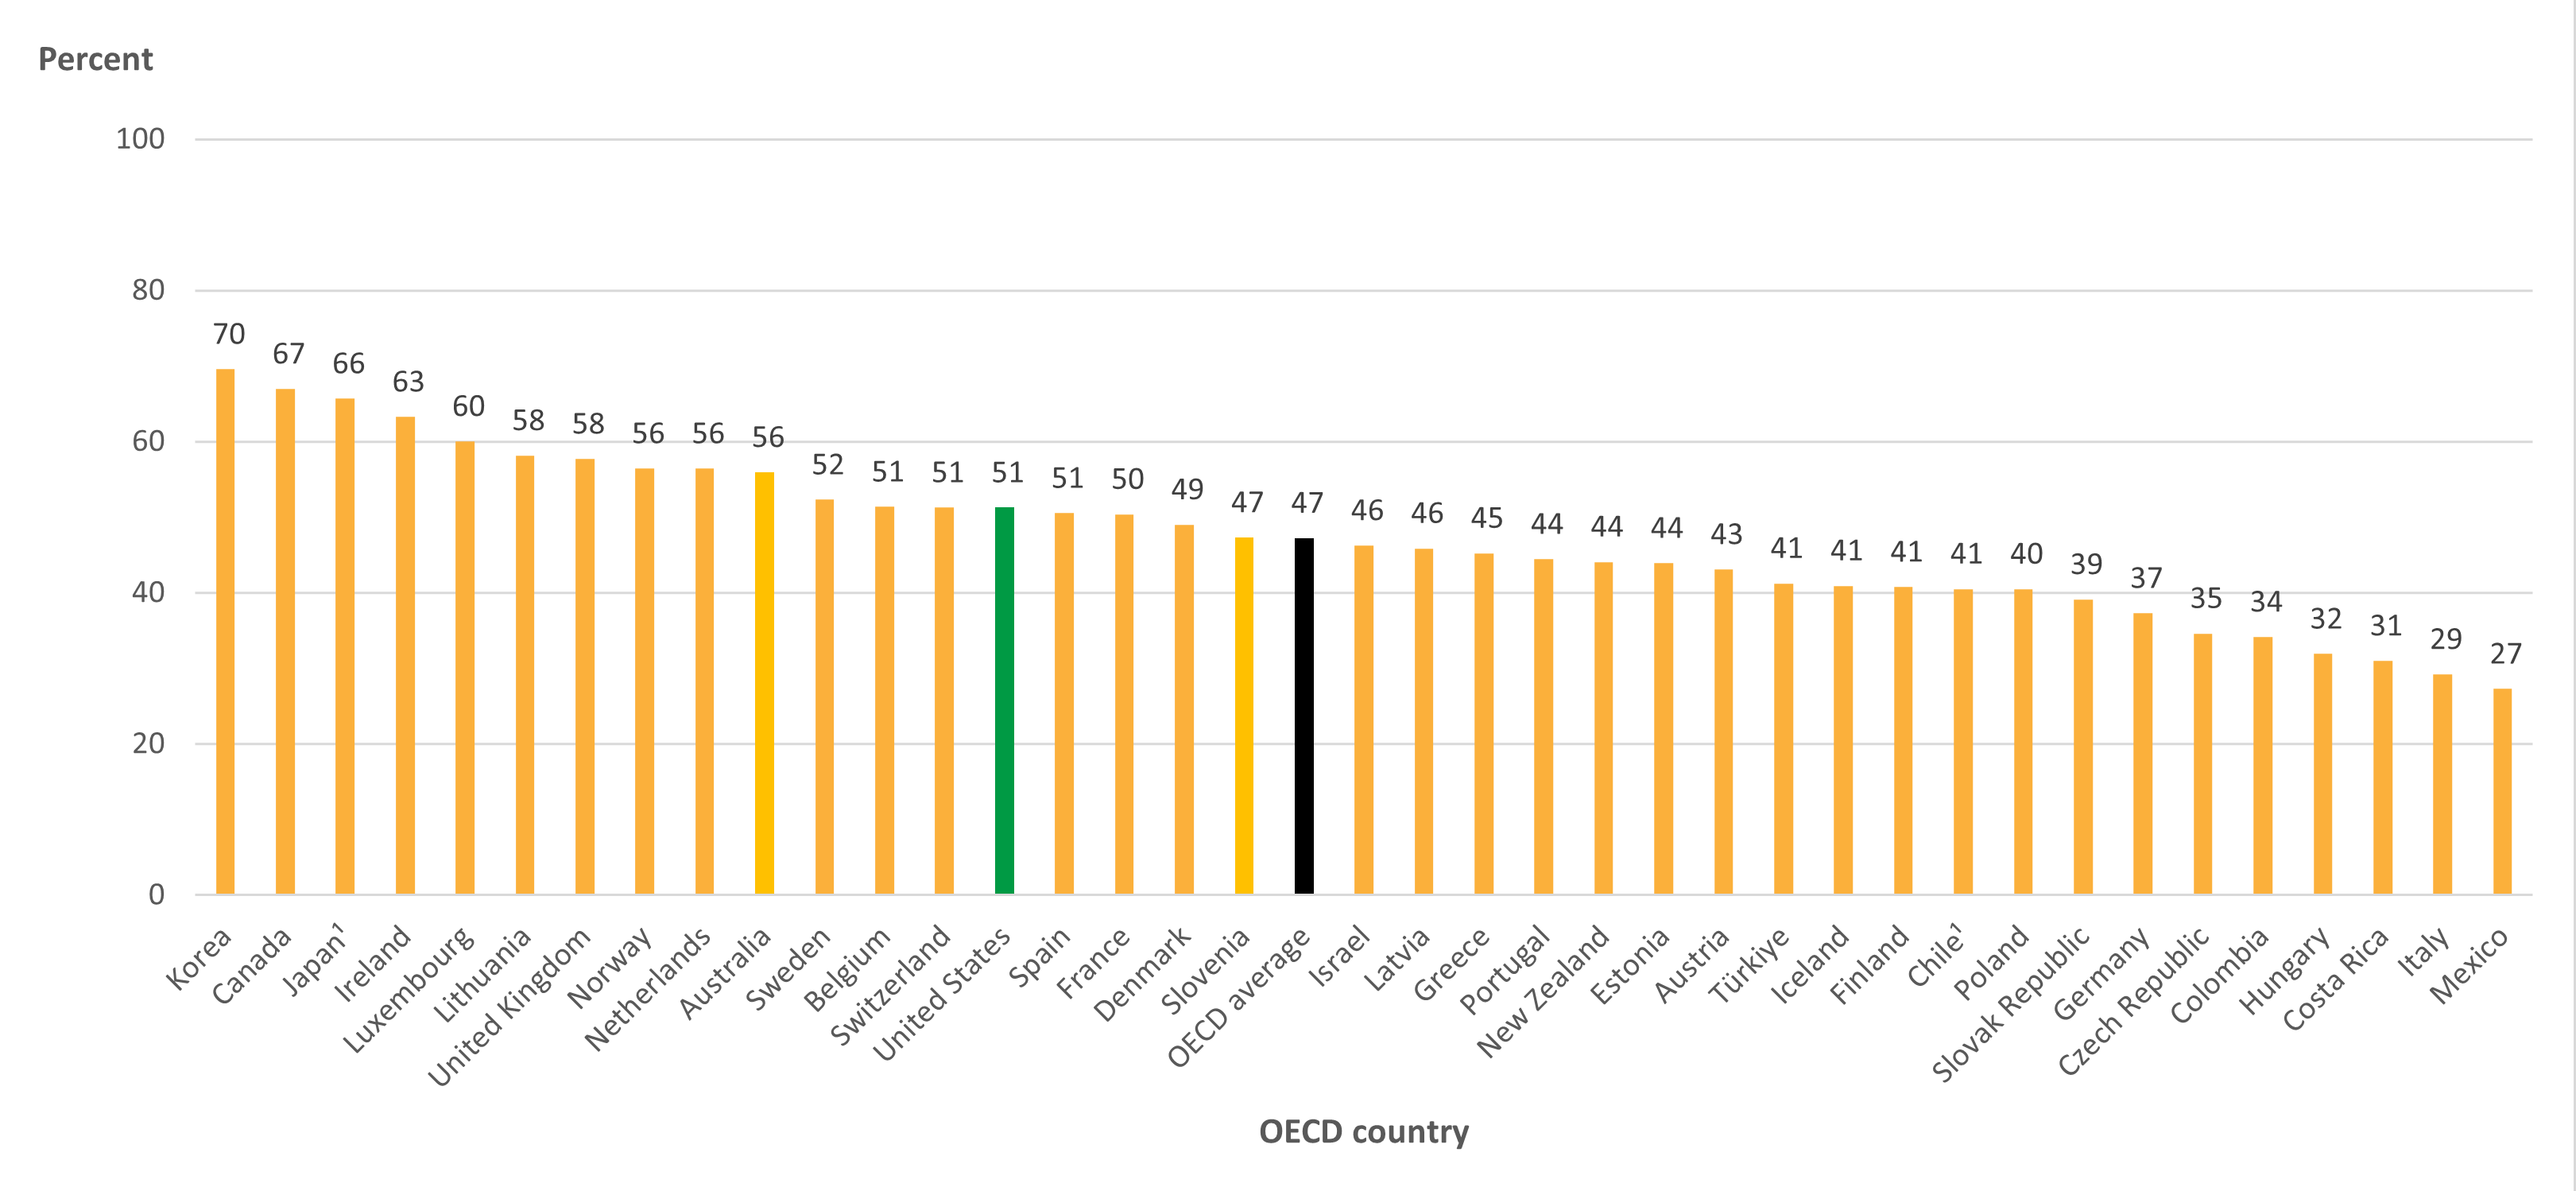
The percentage of U.S. 25- to 34-year-olds with a postsecondary degree increased by 13 percentage points between 2000 and 2022, reaching 51 percent (the OECD average in 2022 was 47 percent) (Table A1.3).1 In this age group in the United States, higher percentages of women than men attained a postsecondary degree (56 vs. 46 percent) (Table A1.2). Across OECD countries, the average postsecondary educational attainment gap between 25- to 34-year-old men and women in 2022 (13 percentage points) was wider than the gap in the United States (10 percentage points). In the United States, the postsecondary attainment rate for 25- to 34-year-old men was 5 percentage points higher than the OECD average, and the attainment rate for women was 3 percentage points higher than the OECD average.


Figure 1. Percentage of 25- to 34-year-olds with a postsecondary degree, by OECD country: 2022

[click to enlarge image]
Data include a small percentage of adults with lower levels of attainment.
Year of reference differs from 2022. Refer to the source table for more details.
SOURCE: OECD (2023), Table A1.3. See Source section for more information and Annex 3 for notes.


International Student Enrollment

The United States is the top OECD destination country for international students enrolling in postsecondary education. In 2021, some 833,204 foreign students were enrolled in postsecondary programs in the United States, representing 13 percent of the international education market share (Table B6.1).2 In comparison, the United Kingdom had the second highest number of international students enrolled in postsecondary education in 2021, representing 9 percent of the international education market share. Interestingly, when examining enrollment trends over the past 3 years (2019 to 2021), foreign student enrollment decreased by 143,649 students (15 percent) in the United States but increased by 111,570 students (23 percent) in the United Kingdom. International student enrollment during these years was likely affected by the coronavirus pandemic, which had large impacts on global travel in 2020 and 2021.


Education Spending

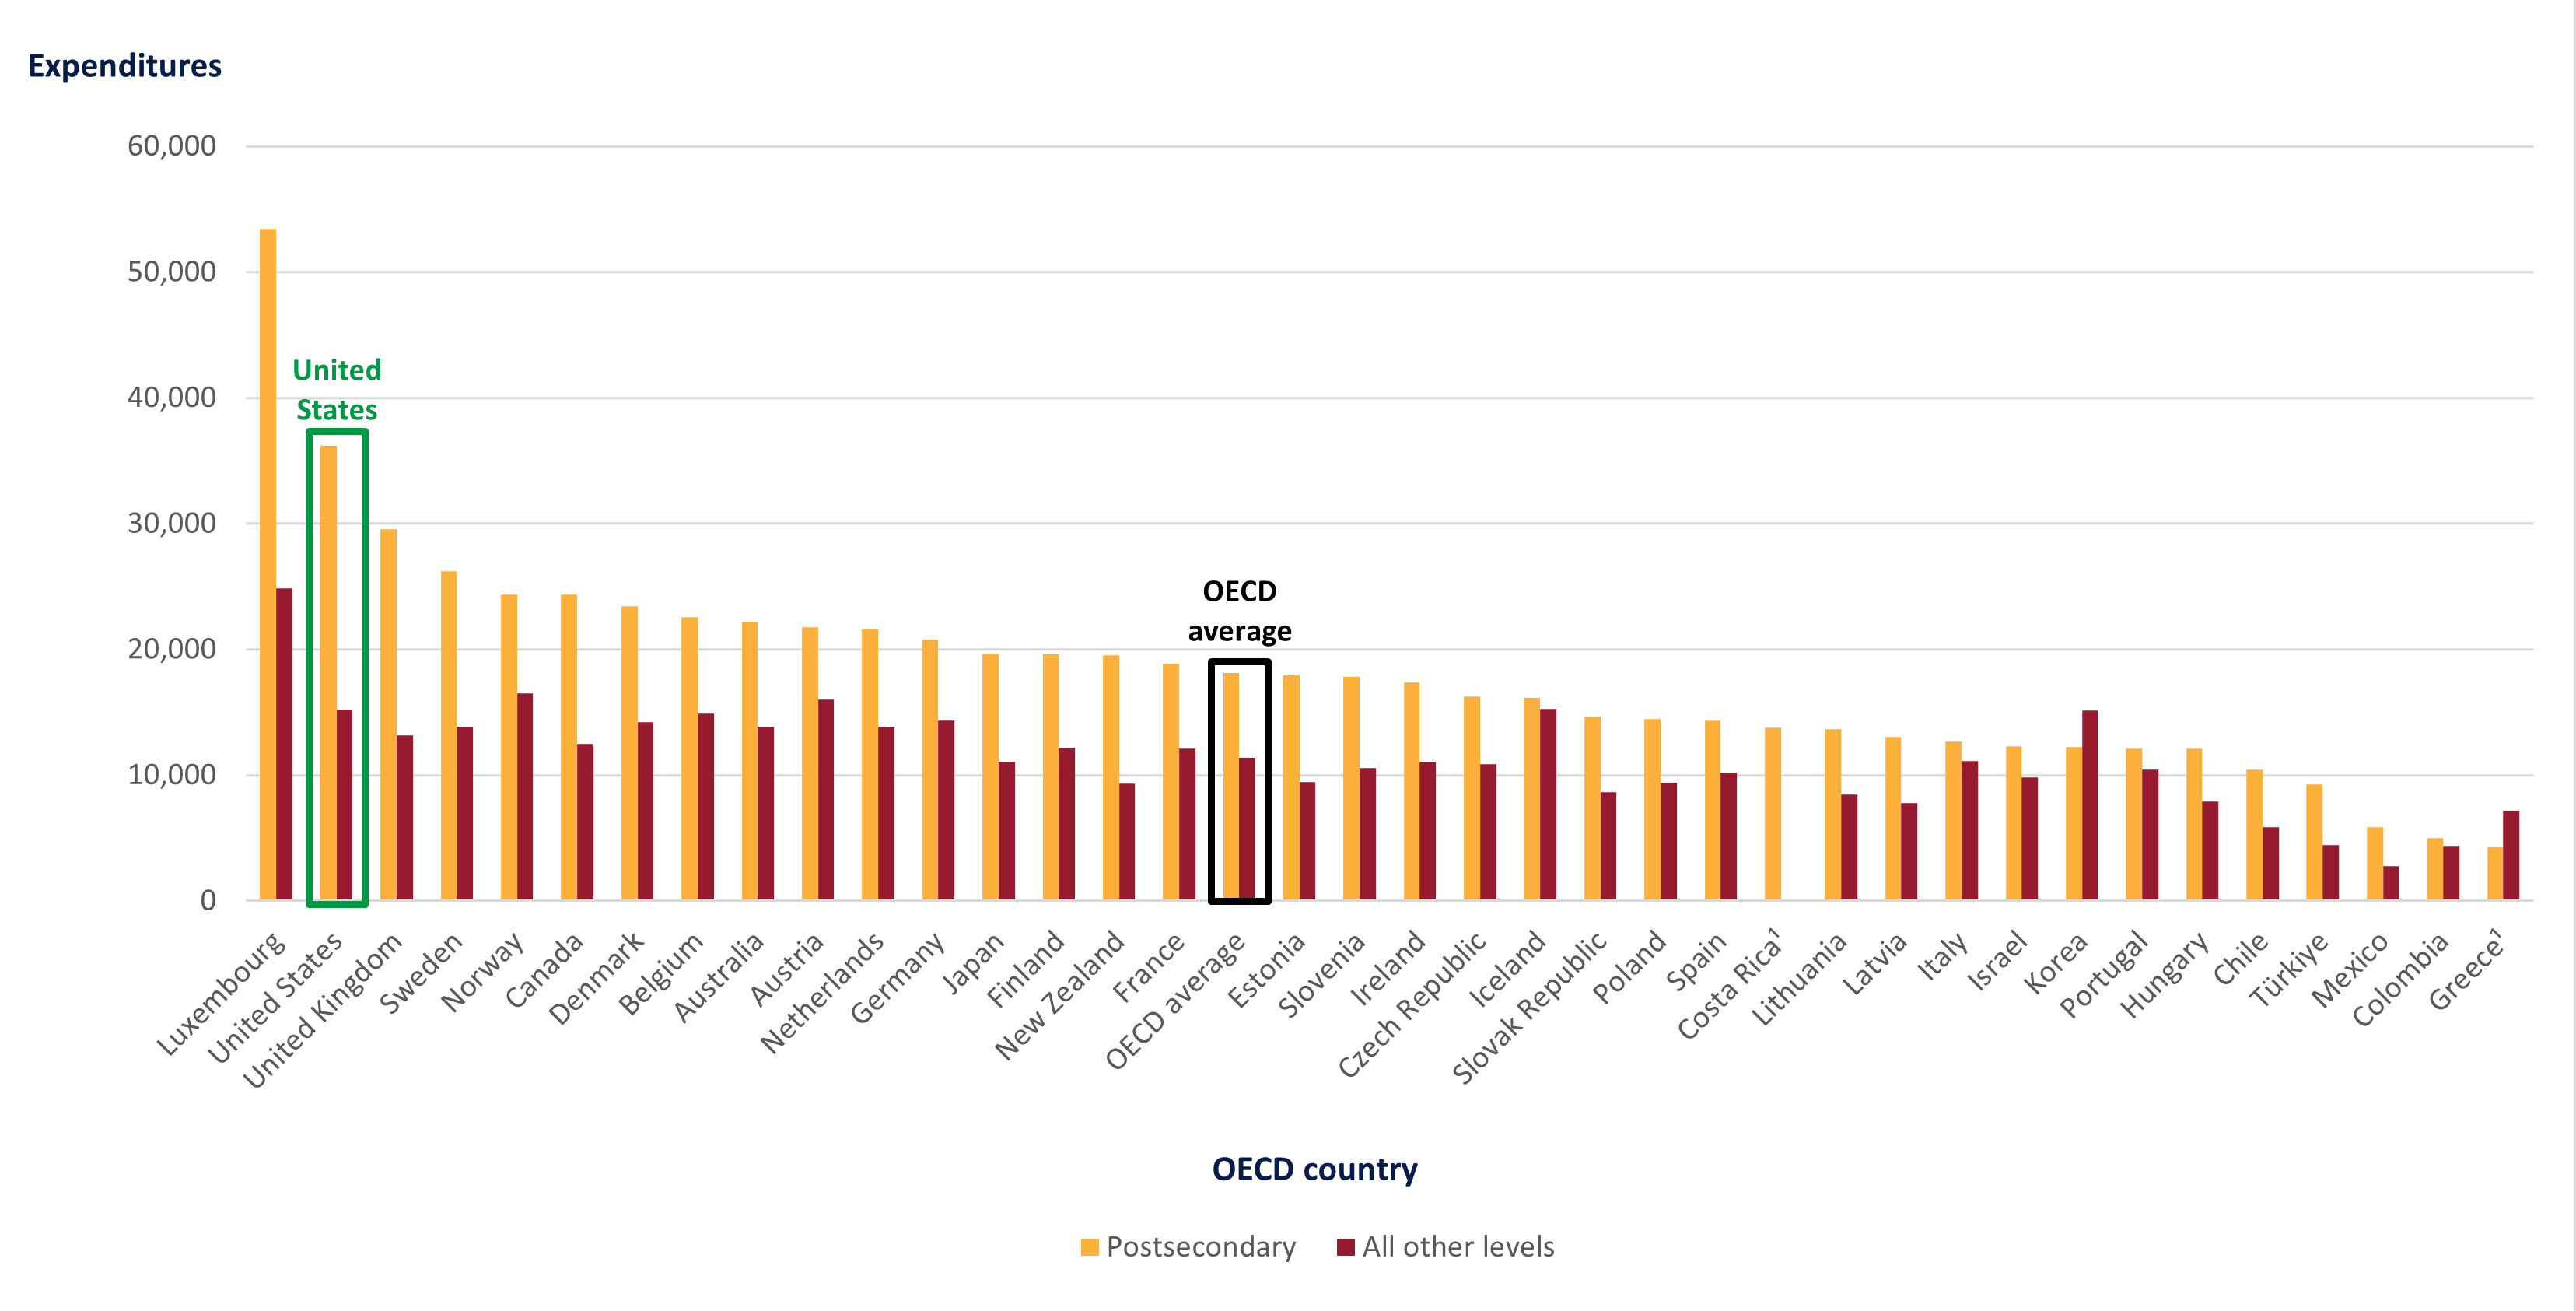
U.S. spending on education is relatively high across all levels of education compared with the OECD average. The largest difference is in postsecondary spending, where the United States spent $36,172 per full-time postsecondary student in 2020, the second highest amount after Luxembourg ($53,421) and nearly double the OECD average ($18,105) (Table C1.1).3 This spending on postsecondary education amounts to 2.5 percent of the U.S. GDP, higher than the OECD average (1.5 percent) (Table C2.1). These total expenditures include amounts received from governments, students, and all other sources.


Figure 2. Expenditures per full-time equivalent student, by education level and OECD country: 2020

[click to enlarge image]
1 Year of reference differs from 2020. Refer to the source table for more details.
SOURCE: OECD (2023), Table C1.1. See Source section for more information and Annex 3 for notes.


High School Completion Rate

The United States has a higher upper secondary (high school) completion rate than most other OECD countries. In 2021, some 87 percent of U.S. students completed their high school program in the expected timeframe, compared with the OECD average of 72 percent (Table B3.1).


Early Childhood Education

The level of participation in early childhood education programs in the United States is below the OECD average. In 2021, average enrollment rates across OECD countries were 72 percent for 3-year-olds, 87 percent for 4-year-olds, and 84 percent for 5-year-olds (Table B2.1). In contrast, enrollment rates for students of these ages in the United States were 30 percent for 3-year-olds, 50 percent for 4-years-olds, and 81 percent for 5-year-olds.  


Browse the full EAG 2023 report to see how the United States compares with other countries on these and other important education-related topics.


By RaeAnne Friesenhahn, AIR, and Cris De Brey, NCES


[1] EAG data for the year 2000 can be accessed via the online OECD Stat database.

[2] Unrounded data in Excel format can be accessed via the StatLink located below each table.

[3] Expenditure in national currencies was converted into equivalent USD by dividing the national currency figure by the purchasing power parity (PPP) index for GDP. For more details on methodology see Annex 2 and Annex 3.

Introducing a New Resource Page for the IPEDS Outcome Measures (OM) Survey Component

The National Center for Education Statistics (NCES) has introduced a new resource page for the Integrated Postsecondary Education Data System (IPEDS) Outcome Measures (OM) survey component. This blog post provides an overview of the webpage and is the first in a series of blog posts that will showcase OM data.

Measuring Student Success in IPEDS: Graduation Rates (GR), Graduation Rates 200% (GR200), and Outcome Measures (OM) is a new resource page designed to help data reporters and users better understand the value of OM data and how the OM survey component works, particularly when compared with the Graduation Rates (GR) and Graduation Rates 200% (GR200) survey components.

The OM survey component was added to IPEDS in 2015–16 in an effort to capture postsecondary outcomes for more than so-called “traditional” college students. From 1997–98 to 2015–16, IPEDS graduation rate data were collected only for first-time, full-time (FTFT) degree/certificate-seeking (DGCS) undergraduates through the GR and GR200 survey components. Unlike these survey components, OM collects student outcomes for all entering DGCS undergraduates, including non-first-time students (i.e., transfer-in students) and part-time students.

Outcome measures are useful as characteristics of students vary by the level of institution. In 2009, some 4.7 million students began at 2-year postsecondary institutions, and 25 percent were full-time students who were attending college for the first time. During the same period, some 4.5 million students began at 4-year institutions, and 44 percent were first-time, full-time students.1

The new resource page answers several important questions about OM, GR, and GR200, including the following:

  • Which institutions complete each survey component?
  • Does the survey form vary by institutional type?
  • What student success measures are included?
  • Which students are included in the cohort?
  • What is the timeframe for establishing student cohorts?
  • Which subgroups (disaggregates) are included?
  • What is the timing of data collection and release?

In answering these questions, the resource page highlights that OM provides a more comprehensive view of student success than do GR and GR200. Furthermore, it suggests that OM, GR, and GR200 are not directly comparable, as the survey components differ in terms of which institutions complete them, which students are captured, and how each measures cohorts. Here are some of the key differences:

  • Institutions with FTFT cohorts complete the GR and GR200 components, whereas degree-granting institutions complete the OM component.
  • GR and GR200 include only FTFT DGCS undergraduates, whereas OM includes all DGCS undergraduates.
  • GR and GR200 cohorts are based on a fall term for academic reports and a full year (September 1–August 31) for program reporters, whereas OM cohorts are based on a full year (July 1–June 30) for all degree-granting institutions.

Finally, the resource page outlines how OM works, including how cohorts and subcohorts are established, which outcomes are collected at various status points, and when the public have access to submitted data. Exhibit 1 presents the current 2021–22 data collection timeline, including the cohort year, outcome status points, data collection period, and public release of OM data.


Exhibit 1. 2021­–22 Outcome Measures (OM) data collection timeline (2013–14 entering degree/certificate-seeking cohort)

Infographic showing the 2020—21 OM data collection timeline, including the cohort year, outcome status points, data collection period, and public release of OM data


Data reporters and users are encouraged to utilize the new OM survey component resource page to better understand the scope of OM, how it works, and how it differs from GR and GR200. Stay tuned for a follow-up blog post featuring data from OM that further highlights the survey component’s usefulness in measuring student success for all DGCS undergraduate students.


By Tara Lawley, NCES; Roman Ruiz, AIR; Aida Ali Akreyi, AIR; and McCall Pitcher, AIR


[1] U.S. Department of Education, National Center for Education Statistics, Integrated Postsecondary Education Data System (IPEDS), Winter 2017–18, Outcome Measures component; and IPEDS Fall 2009, Institutional Characteristics component. See Digest of Education Statistics 2018, table 326.27.

NCES's Top Hits of 2021

As 2021—another unprecedented year—comes to a close and you reflect on your year, be sure to check out NCES’s annual list of top web hits. From reports and Condition of Education indicators to Fast Facts, APIs, blog posts, and tweets, NCES releases an array of content to help you stay informed about the latest findings and trends in education. Don’t forget to follow us on Twitter, Facebook, and LinkedIn to stay up-to-date in 2022!
 

Top five reports, by number of PDF downloads

1. Condition of Education 2020 (8,376)

2Digest of Education Statistics 2019 (4,427)

3. Status and Trends in the Education of Racial and Ethnic Groups 2018 (3,282)

4. Indicators of School Crime and Safety: 2019 (2,906)

5. Trends in High School Dropout and Completion Rates in the United States: 2019 (2,590)


Top five indicators from the Condition of Education, by number of web sessions

1. Students With Disabilities (100,074)

2. Racial/Ethnic Enrollment in Public Schools (64,556)

3. Characteristics of Public School Teachers (57,188)

4. Public High School Graduation Rates (54,504)

5. Education Expenditures by Country (50,20)


Top five Fast Facts, by number of web sessions

1. Back-to-School Statistics (162,126)

2. Tuition Costs of Colleges and Universities (128,236)

3. Dropout Rates (74,399)

4. Graduation Rates (73,855)

5. Degrees Conferred by Race and Sex (63,178)


Top five NCES/EDGE API requested categories of social and spatial context GIS data, by number of requests

1. K–12 Schools (including district offices) (4,822,590)

2. School Districts (1,616,374)

3. Social/Economic (882,984)

4. Locales (442,715)

5. Postsecondary (263,047)


Top five blog posts, by number of web sessions

1. Understanding School Lunch Eligibility in the Common Core of Data (8,242)

2. New Report Shows Increased Diversity in U.S. Schools, Disparities in Outcomes (3,463)

3. Free or Reduced Price Lunch: A Proxy for Poverty? (3,457)

4. Back to School by the Numbers: 2019–20 School Year (2,694)

5. Educational Attainment Differences by Students’ Socioeconomic Status (2,587)


Top five tweets, by number of impressions

1. CCD blog (22,557)


2. NAEP dashboard (21,551)


3. IPEDS data tools (21,323)


4. ACGR web table (19,638)


5. Kids’ Zone (19,390)


By Megan Barnett, AIR

Research Roundup: NCES Celebrates Native American Heritage Month

Looking at data by race and ethnicity can provide a better understanding of education performance and outcomes than examining statistics that describe all students. In observation of Native American Heritage Month, this blog presents NCES findings on the learning experiences of American Indian/Alaska Native (AI/AN) students throughout their education careers.

Early Childhood Education

  • In 2019, 45 percent of AI/AN 3- to 4-year-olds and 83 percent of AI/AN 5-year-olds were enrolled in school.
     

K12 Education

  • The 2019 National Indian Education Study (NIES) surveyed students, teachers, and school principals about the experiences of AI/AN students in 4th and 8th grades.
     
    • How much do AI/AN students know about their culture?
      • Most 4th-grade AI/AN students reported having at least “a little” knowledge of their AI/AN tribe or group, with 17 percent reporting knowing “nothing.” About 19 to 23 percent reported having “a lot” of cultural knowledge across school types. (For more information, see NIES 2019, p. 11.)
         
    • Where do AI/AN students learn about their culture?
      • Family members were identified as the people who taught students the most about AI/AN history, with 45 percent of 4th-grade students and 60 percent of 8th-grade students so reporting. Teachers were the second most commonly identified group of people important for educating students on AI/AN cultural topics. (For more information, see NIES 2019, p. 12.)
         
    • How do teachers contribute to AI/AN student cultural knowledge?
      • A majority of AI/AN students had teachers who integrated AI/AN culture or history into reading lessons: overall, 89 percent of 4th-grade students and 76 percent of 8th-grade students had teachers who reported using these concepts in reading lessons “at least once a year.” (For more information, see NIES 2019, p. 16.)
         
    • What are AI/AN student trends on assessments in mathematics and reading?
      • Nationally, mathematics scores for AI/AN students from 2015 to 2019 remained unchanged for 4th-graders and declined for 8th-graders. Most states saw no change. (For more information, see NIES 2019, p. 46.)
         
  • In 2019, 52 percent of AI/AN 4th-grade students had access to a computer at home. (For more information, see NIES 2019, p. 45.)
     
  • There were 505,000 AI/AN students enrolled in public schools in 1995, compared with 490,000 AI/AN students in fall 2018 (the last year of data available).
     
  • In fall 2018, less than half of AI/AN students (40 percent) attended schools where minority students comprised at least 75 percent of the student population.
     
  • There are approximately 45,000 American Indian/Alaska Native students served by approximately 180 Bureau of Indian Education (BIE) schools located on 64 reservations in 23 states.
     
  • In school year 2018–19, the adjusted cohort graduation rate (ACGR) was 74 percent for AI/AN public school students. The ACGRs for AI/AN students ranged from 51 percent in Minnesota to 94 percent in Alabama and were higher than the U.S. average in eight states (Texas, Virginia, Louisiana, Tennessee, Connecticut, New Jersey, Alabama, and Kentucky).
     
  • In 2020, 95 percent of 25- to 29-year-olds who were AI/AN had completed at least high school.


Postsecondary Education

  • In academic year 2018–19, 14 percent of bachelor’s degrees conferred to AI/AN graduates were in a STEM field.
     
  • About 41 percent of AI/AN students who began seeking a bachelor’s degree full-time at a 4-year institution in fall 2013 completed that degree at the same institution within 6 years.


By Mandy Dean, AIR

Back to School by the Numbers: 2021–22 School Year

Across the country, students are preparing to head back to school—whether in person, online, or through some combination of the two—for the 2021–22 academic year. Each year, the National Center for Education Statistics (NCES) compiles a Back-to-School Fast Fact that provides a snapshot of schools and colleges in the United States. Here are a few “by-the-numbers” highlights from this year’s edition.

Note: Due to the coronavirus pandemic, projected data were not available for this year’s Fast Fact. Therefore, some of the data presented below were collected in 2020 or 2021, but most of the data were collected before the pandemic began. Data collected in 2020 or 2021 are preliminary and subject to change.


48.1 million

The number of students who attended public elementary and secondary schools in fall 2020. 

The racial and ethnic profile of public school students includes 22.0 million White students, 13.4 million Hispanic students, 7.2 million Black students, 2.6 million Asian students, 2.2 million students of Two or more races, 0.4 million American Indian/Alaska Native students, and 0.2 million Pacific Islander students.

Additionally, in fall 2017, about 5.7 million students attended private schools.


3.7 million

The number of students projected to have graduated from high school in the 2018–19 school year, including 3.3 million students from public schools and 0.4 million students from private schools.


43 percent

The percentage of fourth- and eighth-grade students who were enrolled in remote instruction in February 2021.

In comparison, in May 2021, 26 percent of fourth- and eighth-grade students were enrolled in remote instruction.


2.3 million

The number of teachers in public schools in fall 2019.

Additionally, in fall 2017, there were 0.5 million teachers in private schools.


$13,187

The current expenditure per student in public elementary and secondary schools in the 2018–19 school year.

Total current expenditures in public elementary and secondary schools were $667 billion for the 2018–19 school year.


19.6 million

The number of students that attended colleges and universities in fall 2019—lower than the peak of 21.0 million in 2010.

About 5.6 million attended 2-year institutions and 14.0 million students attended 4-year institutions in fall 2019.


11.3 million

The number of female postsecondary students in fall 2019.

In comparison, there were 8.4 million male postsecondary students in fall 2019.


7.3 million

The number of postsecondary students who were enrolled in any distance education course in fall 2019.

In comparison, there were 12.3 million students who were not enrolled in distance education in fall 2019.


Be sure to check out the full Fast Fact to learn more about these and other back-to-school data.

The staff of NCES and of the Institute of Education Sciences (IES) hopes our nation’s students, teachers, administrators, school staffs, and families have an outstanding school year!


By Megan Barnett and Sarah Hein, AIR