IES Blog

Institute of Education Sciences

Spotlighting Doug and Lynn Fuchs: Two Decades of Innovation in Special Education Research

Doug and Lynn Fuchs

During our 20-year anniversary, IES would like to reflect upon the important work of Drs. Doug and Lynn Fuchs, who have received multiple IES grants over the years to explore important factors associated with learning and develop interventions aimed at improving outcomes for low-achieving learners and learners with disabilities in math and literacy. Their work as “trailblazers in the field of special education” was recognized in 2021 when they received the “Nobel Prize of education,” the Harold W. McGraw, Jr. Prize in Education.

Doug and Lynn Fuchs are internationally recognized for their intervention work in Response to Intervention, or Multi-Tiered Systems of Support (MTSS), tiered models that include teacher collection of progress monitoring data and offer progressively intensive support for students who are not performing at grade level. Their research and development work has provided training for educators and research project staff and intervention materials to use in tiered interventions for students who are struggling in the areas of reading and mathematics. Their research has also included exploratory work and measurement development to better understand and measure factors associated with risk of disability in reading and math in elementary school children. Their innovative intervention designs take into consideration different cognitive factors such as working memory and executive functioning.

Although Doug Fuchs is well known for his work within MTSS frameworks, one of his early IES grants in 2004 focused on teachers tailoring instruction to meet individual student needs in elementary schools with a diverse range of students. The goal of the project was to scale up Peer-Assisted Learning Strategies (PALS), an instructional approach developed by the Fuchses in 1997 with increasing instructional differentiation and evidence of reading achievement. For this scale-up study, his research team collected and analyzed data across 2 years from three sites. They demonstrated that implementation of PALS with onsite support for teachers led to significant reading achievement gains, an effect that was strongly influenced by whether teachers were encouraged to modify the PALS program to suit the needs of their particular students. With a NCSER grant in 2009, Doug Fuchs and his research team (including Lynn Fuchs) developed and tested interventions in reading and math to prevent or mitigate disability among first grade students with or at risk for disabilities in these outcome areas. One of the interesting findings from this research related to students with comorbid math and reading disabilities (LD). They found that students with comorbid LD respond differently than those with only math disabilities, depending on the nature of mathematics intervention. However, students with reading disabilities responded similarly whether they had a disability only in reading or in both reading and math. Recently, Doug Fuchs has become passionate about assessment, critiquing how reading comprehension is often assessed in an article he co-authored with Nathan Clemens, “Commercially Developed Tests of Reading Comprehension: Gold Standard or Fool’s Gold?

Lynn Fuchs is a leader in improving outcomes for students with or at risk of math disabilities. Through a 2009 grant, she and her research team (including Doug Fuchs) developed a measure to predict first graders’ calculation skills and word problem development using dynamic assessment. The measure was found to be more predictive than traditional assessments for early identification of students at risk for a math disability. The team concluded that language, reasoning, and mathematical cognition were important in predicting calculation and word problem solving for these early learners. Lynn Fuchs continued this work in math and cognition with students in second grade, exploring connections between cognition and student calculation, word problem solving, and pre-algebraic knowledge with funding from the National Institute of Child Health and Human Development. With a 2015 IES grant, she applied what she learned about the importance of cognition to test the efficacy of a math intervention that embedded working memory training into a previously validated math problem-solving intervention (Pirate Math) for students with poor problem-solving skills. The results of this study showed that general working memory training with ongoing math practice improves working memory and word problem skills; however, working memory training alone is not sufficient to improve word problem solving.

More recently, Lynn Fuchs received a 2020 grant to further research a fraction intervention for fourth grade students with disabilities developed through her work as co-principal investigator on the 2010 National Research and Development Center on Improving Mathematics Instruction for Students with Mathematics Difficulties. In the current replication study, she and her research team are testing the Inclusive Fraction Intervention as a class-wide intervention taught by general education teachers to understand the effect on students with and without math learning disabilities. Lynn Fuchs also chaired the panel for the most recent WWC Practice Guide, Assisting Students Struggling with Mathematics: Intervention in the Elementary Grades. This guide provides six evidence-based practices that can help teachers tailor their instructional approaches and/or their mathematics intervention programs to meet the needs of their students. All six practices in this guide are supported with strong evidence due, in part, to the research conducted by Lynn Fuchs. By the start of 2023, this practice guide has had 62,346 views and 10,468 downloads.

Together, Doug and Lynn Fuchs have pushed the field forward with their leadership. Through their 2013 A3 Initiative project, they developed and tested the efficacy of intensive reading and math interventions for learners in upper elementary grades. The research team demonstrated that both the math and reading interventions were effective in improving  outcomes for students with disabilities. As part of this work, the Fuchses led a meeting with a group of experts to discuss evidence to support the importance of moderator analysis in intervention research. This effort resulted in a special journal issue with several articles on this topic. Their leadership role extends beyond IES-funded work to their involvement in several other national projects, such as the National Center on Intensive Intervention, funded by the Office of Special Education Programs and other national thought leadership activities, such as their webinar on  intensive intervention. The Fuchses have also published articles in practitioner journals outlining how their research-based practices can be implemented by teachers in the classroom, such as “What is intensive intervention and why is it important?

The impact of Doug and Lynn Fuchs research is far reaching. In addition to leading research projects and publishing articles, Doug and Lynn Fuchs have truly developed capacity in the field of special education research through mentoring and collaborating with junior researchers. The following are examples of researchers who worked with Doug and Lynn Fuchs in the past as graduate research assistants, post-doctoral researchers, or research associates who now lead their own IES-funded research:

Doug and Lynn Fuchs have pushed the fields of assessment and intervention development forward, providing new opportunities to understand and support math and literacy outcomes for students with or at risk for disabilities. We are proud to have funded their work over the years, and we are excited to see how they continue to advance the field.

This blog was authored by Sarah Brasiel, program officer at NCSER.

U.S. Is Unique in Score Gap Widening in Mathematics and Science at Both Grades 4 and 8: Prepandemic Evidence from TIMSS

Tracking differences between the performance of high- and low-performing students is one way of monitoring equity in education. These differences are referred to as achievement gaps or “score gaps,” and they may widen or narrow over time.

To provide the most up-to-date international data on this topic, NCES recently released Changes Between 2011 and 2019 in Achievement Gaps Between High- and Low-Performing Students in Mathematics and Science: International Results From TIMSS. This interactive web-based Stats in Brief uses data from the Trends in International Mathematics and Science Study (TIMSS) to explore changes between 2011 and 2019 in the score gaps between students at the 90th percentile (high performing) and the 10th percentile (low performing). The study—which examines data from 47 countries at grade 4, 36 countries at grade 8, and 29 countries at both grades—provides an important picture of prepandemic trends.

This Stats in Brief also provides new analyses of the patterns in score gap changes over the last decade. The focus on patterns sheds light on which part of the achievement distribution may be driving change, which is important for developing appropriate policy responses. 


Did score gaps change in the United States and other countries between 2011 and 2019?

In the United States, score gap changes consistently widened between 2011 and 2019 (figure 1). In fact, the United States was the only country (of 29) where the score gap between high- and low-performing students widened in both mathematics and science at both grade 4 and grade 8.


Figure 1. Changes in scores gaps between high- and low-performing U.S. students between 2011 and 2019

Horizontal bar chart showing changes in scores gaps between high- and low-performing U.S. students between 2011 and 2019

* p < .05. Change in score gap is significant at the .05 level of statistical significance.

SOURCE: Stephens, M., Erberber, E., Tsokodayi, Y., and Fonseca, F. (2022). Changes Between 2011 and 2019 in Achievement Gaps Between High- and Low-Performing Students in Mathematics and Science: International Results From TIMSS (NCES 2022-041). U.S. Department of Education. Washington, DC: National Center for Education Statistics, Institute of Education Sciences. Available at https://nces.ed.gov/pubsearch/pubsinfo.asp?pubid=2022041.


For any given grade and subject combination, no more than a quarter of participating countries had a score gap that widened, and no more than a third had a score gap that narrowed—further highlighting the uniqueness of the U.S. results.


Did score gaps change because of high-performing students, low-performing students, or both?

At grade 4, score gaps widened in the United States between 2011 and 2019 due to decreases in low-performing students’ scores, while high-performing students’ scores did not measurably change (figure 2). This was true for both mathematics and science and for most of the countries where score gaps also widened.


Figure 2. Changes in scores of high- and low-performing U.S. students between 2011 and 2019

Horizontal bar chart showing changes in scores of high- and low-performing U.S. students between 2011 and 2019 and changes in the corresponding score gaps

p < .05. 2019 score gap is significantly different from 2011 score gap.

SOURCE: Stephens, M., Erberber, E., Tsokodayi, Y., and Fonseca, F. (2022). Changes Between 2011 and 2019 in Achievement Gaps Between High- and Low-Performing Students in Mathematics and Science: International Results From TIMSS (NCES 2022-041). U.S. Department of Education. Washington, DC: National Center for Education Statistics, Institute of Education Sciences. Available at https://nces.ed.gov/pubsearch/pubsinfo.asp?pubid=2022041.


Low-performing U.S. students’ scores also dropped in both subjects at grade 8, but at this grade, they were accompanied by rises in high-performing students’ scores. This pattern—where the two ends of the distribution move in opposite directions—led to the United States’ relatively large changes in score gaps. Among the other countries with widening score gaps at grade 8, this pattern of divergence was not common in mathematics but was more common in science.

In contrast, in countries where the score gaps narrowed, low-performing students’ scores generally increased. In some cases, the scores of both low- and high-performing students increased, but the scores of low-performing students increased more.

Countries with narrowing score gaps typically also saw their average scores rise between 2011 and 2019, demonstrating improvements in both equity and achievement. This was almost never the case in countries where the scores of low-performing students dropped, highlighting the global importance of not letting this group of students fall behind.  


What else can we learn from this TIMSS Stats in Brief?

In addition to providing summary results (described above), this interactive Stats in Brief allows users to select a subject and grade to explore each of the study questions further (exhibit 1). Within each selection, users can choose either a more streamlined or a more expanded view of the cross-country figures and walk through the findings step-by-step while key parts of the figures are highlighted.


Exhibit 1. Preview of the Stats in Brief’s Features

Image of the TIMSS Stats in Brief web report


Explore NCES’ new interactive TIMSS Stats in Brief to learn more about how score gaps between high- and low-performing students have changed over time across countries.

Be sure to follow NCES on TwitterFacebookLinkedIn, and YouTube and subscribe to the NCES News Flash to stay up-to-date on TIMSS data releases and resources.


By Maria Stephens and Ebru Erberber, AIR; and Lydia Malley, NCES

Assessing Math Understanding of Students with Disabilities During a Pandemic

For almost two decades, IES/NCSER has funded Brian Bottge and his teams at the University of Kentucky and University of Wisconsin-Madison to develop and test the efficacy of a teaching method called Enhanced Anchored Instruction (EAI), which helps low-achieving middle school students with math disabilities develop their problem-solving skills by solving meaningful problems related to a real-world problem. The research findings support the efficacy of EAI, especially for students with math disabilities. Most recently, Bottge and his team have been researching innovative forms of assessment that more adequately capture what students with disabilities know both conceptually and procedurally in solving math problems. With supplemental funding, IES/NCSER extended Dr. Bottge’s latest grant to test the use of oral assessment to measure student knowledge and compare that with the knowledge demonstrated on a pencil and paper test. The COVID-19 pandemic introduced added challenges to this work when schools closed and students shifted to online education.

Below we share a recent conversation with Dr. Bottge about the experience of conducting research during a pandemic and what he and his team were still able to learn about the value of oral assessment in mathematics for students with disabilities.

What changes did you observe in the intervention implementation by teachers due to the COVID-related shift to online learning?

Photo of Dr. Brian Bottge

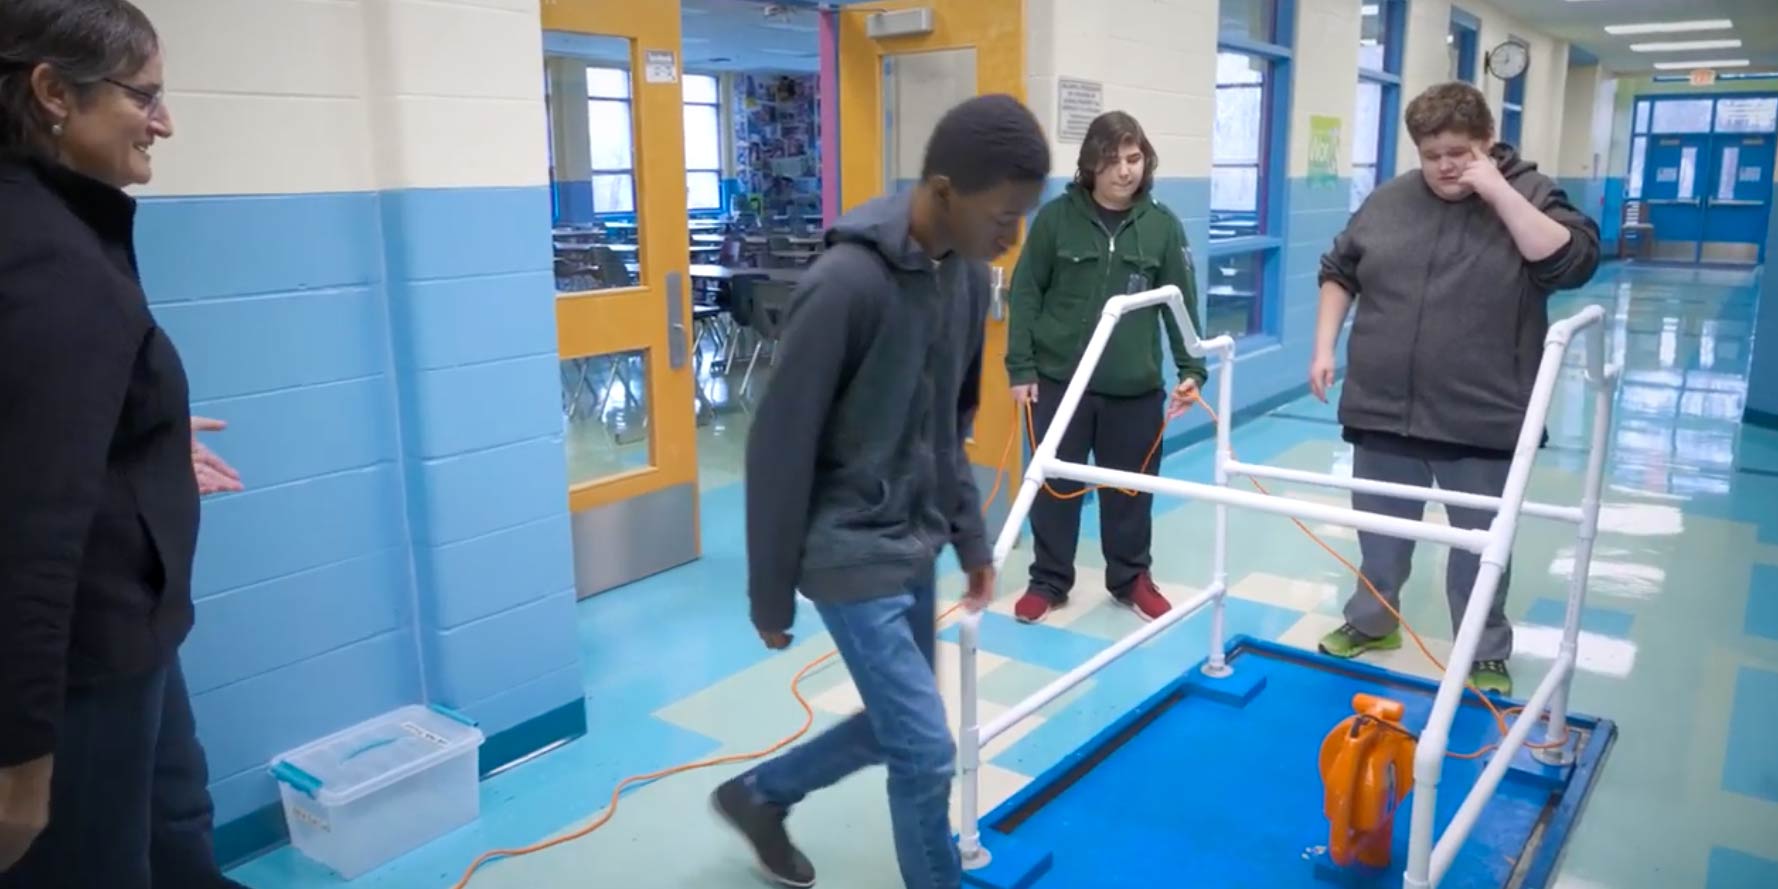
The shift to online learning created changes in class size and structure. For 38 days (22 days in classroom, 16 days online through a virtual meeting platform), the middle school special education teacher first taught concepts through a widely used video-based anchored problem, the Kim’s Komet episode of the Jasper Project, in which characters compete in a “Grand Pentathlon.” The teacher then engaged the students in a hands-on application of the concepts by running a live Grand Pentathlon. In the Grand Pentathlon, students make their own cars, race them on a full-size ramp, time them at various release points on the ramp, and graph the information to estimate the speed of the cars. The purpose of both units was to help students develop their informal understanding of pre-algebraic concepts such as linear function, line of best fit, variables, rate of change (slope), reliability, and measurement error. Midway through the study, in-person instruction was suspended and moved online. Instead of working with groups of three to four students in the resource room throughout the day, the teacher provided online instruction to 14 students at one time and scheduled one-on-one sessions with students who needed extra help.

What challenges did you observe in the students interacting with the activities and their learning once they shifted to online learning?

All students had access to a computer at home and they were able to use the online platform without much confusion because they had used it in other classes. The screen share feature enabled students to interact with much of the curriculum by viewing the activities, listening to the teacher, and responding to questions, although they could not fully participate in the hands-on part of the lessons. Class attendance and student behavior were unexpectedly positive during the days when students were online. For example, one student had displayed frequent behavioral outbursts in school but became a positive and contributing member of the online class. The ability to mute mics in the platform gave the teacher the option of allowing only one student to talk at a time.

Were students still able to participate in the hands-on activities that are part of the intervention?

For the hands-on activities related to the Grand Pentathlon competition, the teacher taught online and a research staff member manipulated the cars, track, and electronic timers from campus. Students watched their computer screens waiting for their turn to time their cars over the length of the straightaway. The staff member handled each student’s cars and one by one released them from the height on the ramp as indicated by each student. After students had recorded the times, the teacher asked students to calculate and share the speeds of their cars for each time trial height.

Do you have any other observations about the impact of COVID-19 on your intervention implementation?

One of the most interesting observations was parent participation in the lessons. Several parents went beyond simply monitoring how their child was doing during the units to actively working out the problems. Some were surprised by the difficulty level of the math problems. One mother jokingly remarked: I thought the math they were going to do was as easy as 5 + 5 = 10. The next time my son might have to be the parent and I might have to be the student. You all make the kids think and I like that.

When COVID-19 shut down your participating schools, how were you able to adjust your data collection to continue with your research?

We used the same problem-solving test that we have administered in several previous studies (Figure 1 shows two of the items). On Day 1 of the study (pre-COVID), students took the math pretest in their resource rooms with pencil and paper. Due to COVID-19 school closures, we mailed the posttest and test administration instructions to student homes. On the scheduled testing day during an online class session, students removed the test from the envelope and followed directions for answering the test questions while we observed remotely. On Days 2 and 3 of the study (pre-COVID), an oral examiner (OE) pretested individual students in person. The OE asked the student questions, prompting the student to describe the overall problem, identify the information needed for solving the problem, indicate how the information related to their problem-solving plan, and provide an answer. Due to COVID-19, students took the oral posttests online. The teacher set up a breakout room in the platform where the OE conducted the oral assessments and a second member of the research team took notes.

A picture depicting two sample questions. The first shows a graph of two running paths along with the text, "3. The total distance covered by two runners is shown in the graph below. a. How much time did it take runner 1 to go 1 mile? b. About how much time after the start of the race did one runner pass the other?" The second image features a marble on top of a ramp accompanied with the question "What is the speed of a marble (feet per second) let go from the top of the ramp? (Round your answer to the nearest tenth.)"
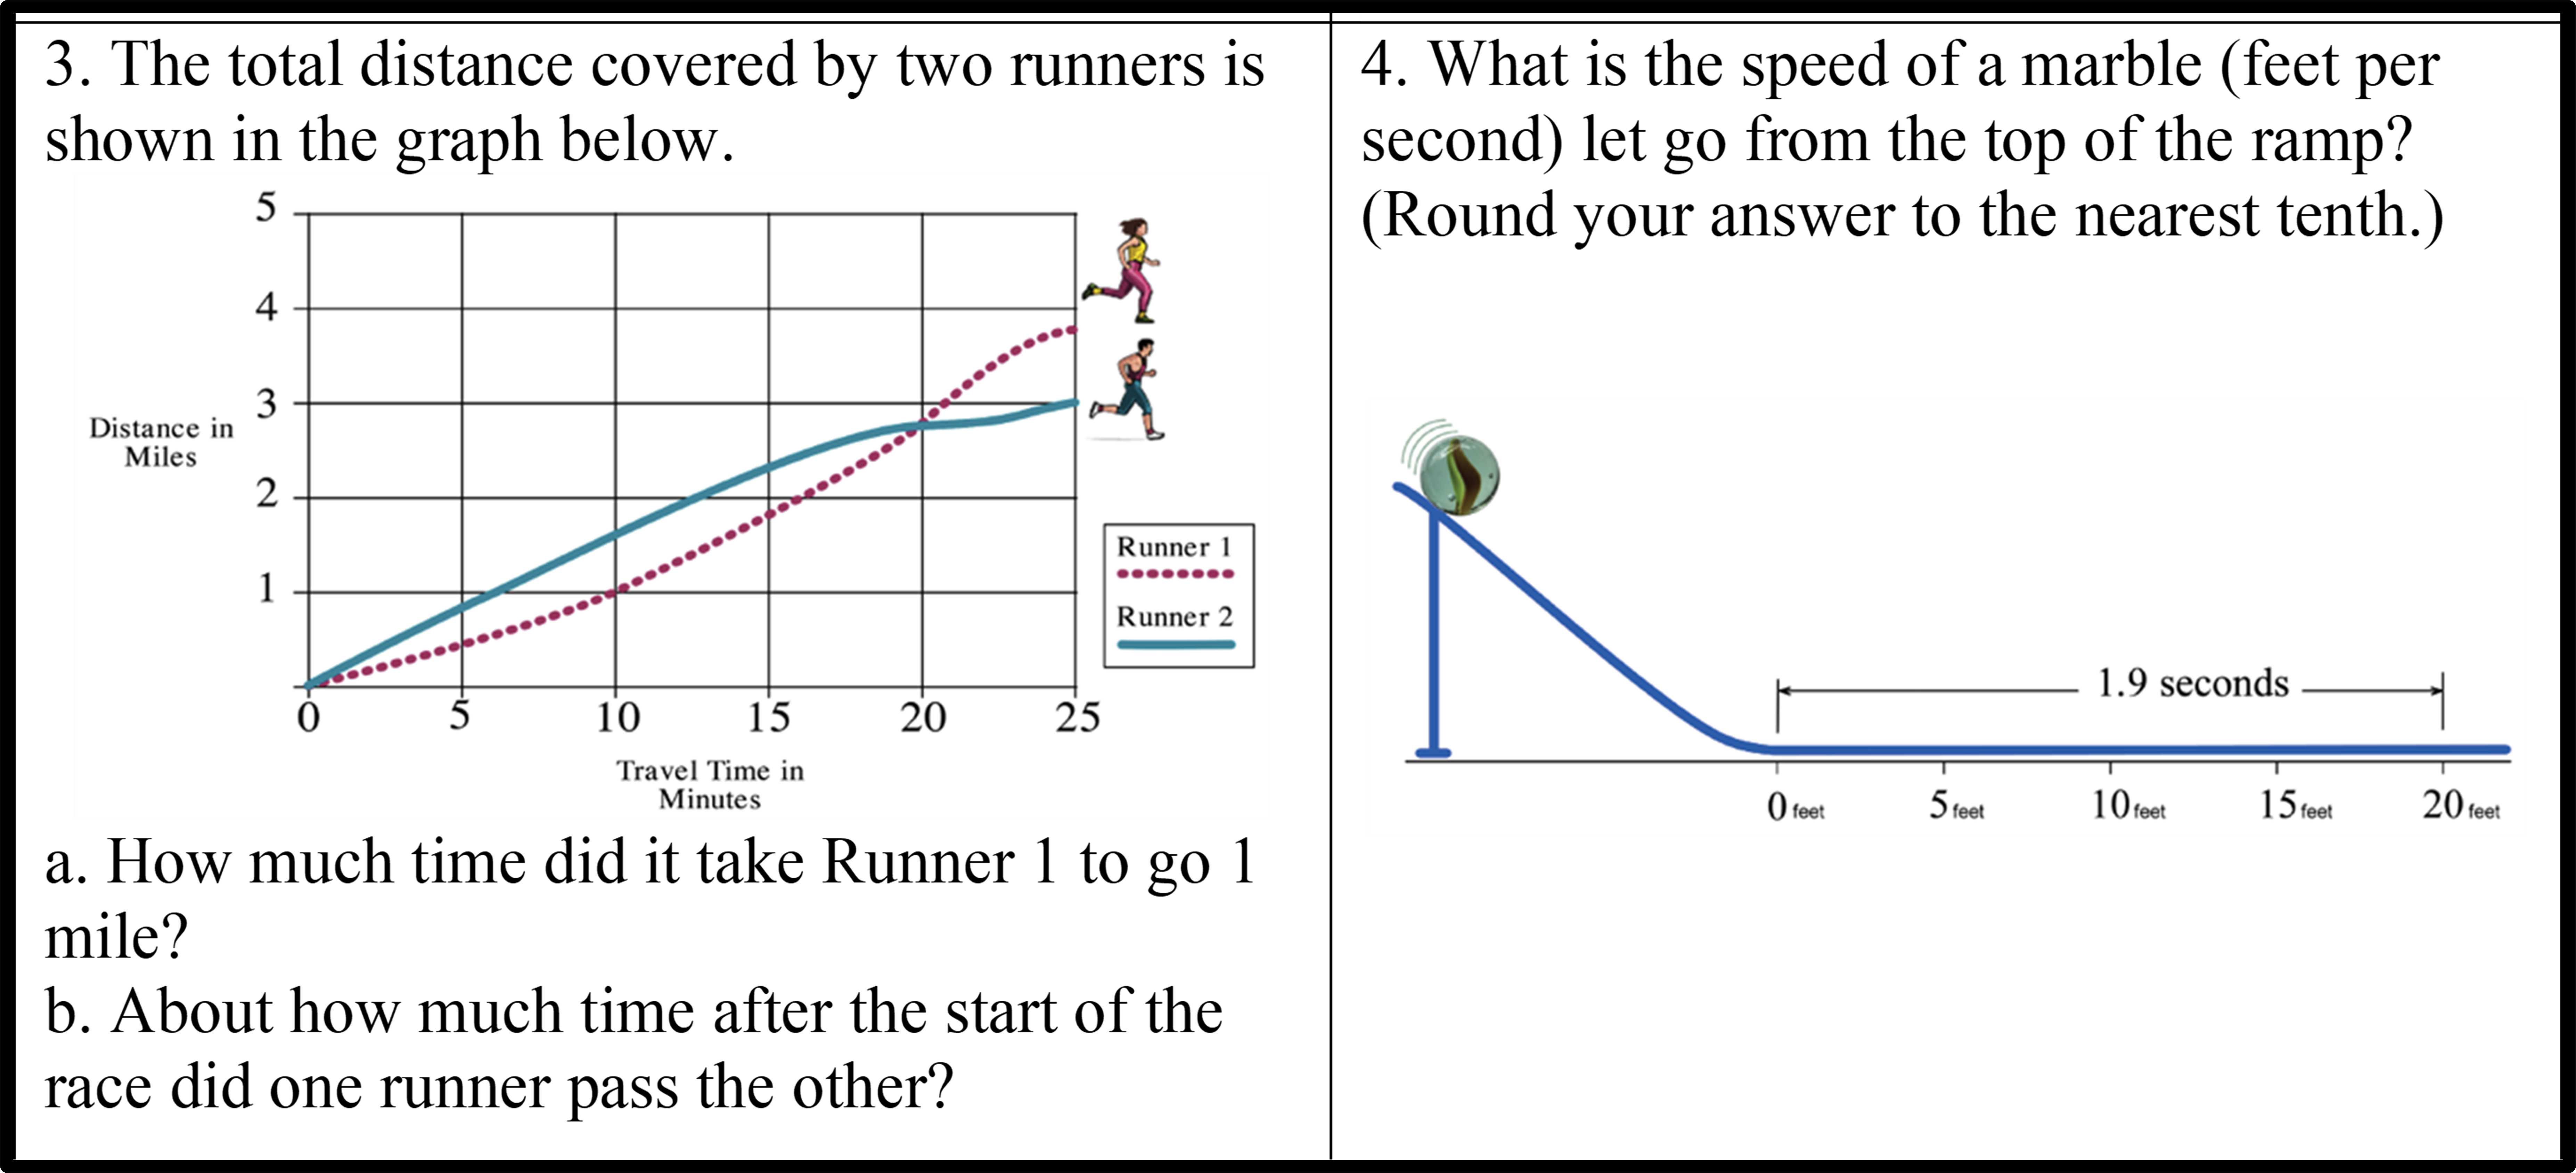
Figure 1. Sample Items from the Problem-Solving Test

During the testing sessions, the OE projected each item on the students’ computer screens. Then she asked the student to read the problem aloud and describe how to solve it. The OE used the same problem-solving prompts as was used on the pretests. For problems that involved graphs or charts, the OE used the editing tools to make notations on the screen as the students directed. One challenge is that oral testing online made it more difficult to monitor behavior and keep students on task. For example, sometimes students became distracted and talked to other people in their house.

What were the results of this study of oral assessment in mathematics for students with disabilities?

Our results suggest that allowing students to describe their understanding of problems in multiple ways yielded depth and detail to their answers. We learned from the oral assessment that most students knew how to transfer the data from the table to an approximate location on the graph; however, there was a lack of precision due to a weak understanding of decimals. For item 4 in Figure 1, the use of decimals confused students who did not have much exposure to decimals prior to or during the study. We also found that graphics that were meant to help students understand the text-based items were in some cases misleading. The representation in item 4 was different than the actual ramp and model car activity students experienced virtually. We have used this math test several times in our research and regrettably had no idea that elements of the graphics contributed to misunderstanding.

Unfortunately, our findings suggest that the changes made in response to COVID-19 may have depressed student understanding. Performances on two items (including item 4 in Figure 1) that assessed the main points of the intervention were disappointing compared to results from prior studies. The increase in class size from 3–4 to 14 after COVID and switching to online learning may have reduced the opportunity for repetition and practice. There were reduced opportunities for students to participate in the hands-on activities and participate in conversations about their thinking with other students.

We acknowledge the limitations of this small pilot study to compare knowledge of students when assessed in a pencil and paper format to an oral assessment. We are optimistic about the potential of oral assessments to reveal problem-solving insights of students with math disabilities. The information gained from oral assessment is of value if teachers use it to individualize their instruction. As we learned, oral assessment can also point to areas where graphics or other information are misleading. More research is needed to understand the value of oral assessment despite the increase in time it might add to data collection efforts for students with math disabilities. This experience highlights some of the positive experiences of students learning during COVID-19 virtually at home as well as some of the challenges and risks of reduced outcomes from these virtual learning experiences, especially for students with disabilities.

This blog was written by Sarah Brasiel, program officer for NCSER’s Science, Technology, Engineering, and Math program.

New International Data Show Large and Widening Gaps Between High- and Low-Performing U.S. 4th- and 8th-Graders in Mathematics and Science

NCES recently released results from the 2019 Trends in International Mathematics and Science Study (TIMSS). TIMSS tests students in grades 4 and 8 in mathematics and science every 4 years. The results show that

  • Across both subjects and grades, the United States scored, on average, in the top quarter of the education systems that took part in TIMSS 2019.
    • Among the 64 education systems that participated at grade 4, the United States ranked 15th and 8th in average mathematics and science scores, respectively.
    • Among the 46 education systems that participated at grade 8, the United States ranked 11th in average scores for both subjects.
  • On average, U.S. scores did not change significantly between the 2011 and 2019 rounds of TIMSS.

Average scores are one measure of achievement in national and international studies. However, they provide a very narrow perspective on student performance. One way to look more broadly is to examine differences in scores (or “score gaps”) between high-performing students and low-performing students. Score gaps between high performers and low performers can be one indication of equity within an education system. Here, high performers are those who scored in the 90th percentile (or top 10 percent) within their education system, and low performers are those who scored in the 10th percentile (or bottom 10 percent) within their education system.

In 2019, while some education systems had a higher average TIMSS score than the United States, none of these education systems had a wider score gap between their high and low performers than the United States. This was true across both subjects and grades.

Figure 1 shows an example of these findings using the grade 8 mathematics data. The figure shows that 17 education systems had average scores that were higher or not statistically different from the U.S. average score.

  • Of these 17 education systems, 13 had smaller score gaps between their high and low performers than the United States. The score gaps in 4 education systems (Singapore, Chinese Taipei, the Republic of Korea, and Israel) were not statistically different from the score gap in the United States.
  • The score gaps between the high and low performers in these 17 education systems ranged from 170 points in Quebec, Canada, to 259 points in Israel. The U.S. score gap was 256 points.
  • If you are interested in the range in the score gaps for all 46 education systems in the TIMSS 2019 grade 8 mathematics assessment, see Figure M2b of the TIMSS 2019 U.S. Highlights Web Report, released in December 2020. This report also includes these results for grade 8 science and both subjects at the grade 4 level.

Figure 1. Average scores and 90th to 10th percentile score gaps of grade 8 students on the TIMSS mathematics scale, by education system: 2019

NOTE: This figure presents only those education systems whose average scores were similar to or higher than the U.S. average score. Scores are reported on a scale of 0 to 1,000 with a TIMSS centerpoint of 500 and standard deviation of 100.

SOURCE: International Association for the Evaluation of Educational Achievement (IEA), Trends in International Mathematics and Science Study (TIMSS), 2019.


From 2011 to 2019, U.S. average scores did not change significantly. However, the scores of low performers decreased, and score gaps between low and high performers grew wider in both subjects and grades. In addition, at grade 8, there was an increase in the scores of high performers in mathematics and science over the same period. These two changes contributed to the widening gaps at grade 8.

Figure 2 shows these results for the U.S. grade 8 mathematics data. Average scores in 2011 and 2019 were not significantly different. However, the score of high performers increased from 607 to 642 points between 2011 and 2019, while the score of low performers decreased from 409 to 385 points. As a result, the score gap widened from 198 to 256 points between 2011 and 2019. In addition, the 2019 score gap for grade 8 mathematics is significantly wider than the gaps for all previous administrations of TIMSS.


Figure 2. Trends in average scores and selected percentile scores of U.S. grade 8 students on the TIMSS mathematics scale: Selected years, 1995 to 2019

* p < .05. Significantly different from the 2019 estimate at the .05 level of statistical significance.

NOTE: Scores are reported on a scale of 0 to 1,000 with a TIMSS centerpoint of 500 and standard deviation of 100.

SOURCE: International Association for the Evaluation of Educational Achievement (IEA), Trends in International Mathematics and Science Study (TIMSS), 1995, 1999, 2003, 2007, 2011, 2015, 2019.


These TIMSS findings provide insights regarding equity within the U.S. and other education systems. Similar results from the National Assessment of Educational Progress (NAEP) show that mathematics scores at both grades 4 and 8 decreased or did not change significantly between 2009 and 2019 for lower performing students, while scores increased for higher performing students. More national and international research on the gap between high- and low-performing students could help inform important education policy decisions that aim to address these growing performance gaps.

To learn more about TIMSS and the 2019 U.S. and international results, check out the TIMSS 2019 U.S. Highlights Web Report and the TIMSS 2019 International Results in Mathematics and Science. A recording is also available for a RISE Webinar from February 24, 2021 (What Do TIMSS and NAEP Tell Us About Gaps Between High- and Low-Performing 4th and 8th Graders?) that explores these topics further. 


By Katie Herz, AIR; Marissa Hall, AIR; and Lydia Malley, NCES

New International Data Identify “Resilient” Students in Financial Literacy

NCES recently released the results of the Program for International Student Assessment (PISA) 2018 assessment of financial literacy. This assessment measured 15-year-old students’ knowledge and understanding of financial concepts, products, and risks and their ability to apply that knowledge to real-life situations. It found that, on average, U.S. students performed similarly to their peers across the 12 other participating Organization for Economic Cooperation and Development (OECD) countries. 

The assessment also found that 12 percent of U.S. students performed at the highest level of proficiency (level 5). Performance at this level indicates that students can apply their understanding of financial terms and concepts to analyze complex financial products, solve nonroutine financial problems, and describe potential outcomes of financial decisions in the big picture.[1] The U.S. percentage was again similar to the OECD average.

However, this analysis also identified a group of students who might be considered “resilient.” In education research, resilience is defined as the ability to perform well academically despite coming from the disadvantaged backgrounds that have more commonly been associated with lower performance.

High-performing students came from across the spectrum of school poverty levels, as measured by the percentage of students eligible for free or reduced-price lunch (FRPL).[2] In particular, 7 percent of high-performing students in financial literacy came from the highest poverty schools (figure 1).


Figure 1. Percentage distribution of U.S. 15-year-olds in public schools scoring below level 2 and at level 5 of proficiency on the PISA financial literacy scale, by percentage of students eligible for free or reduced-price lunch (FRPL) at their school: 2018

NOTE: Data for percentage of students eligible for FRPL were available for public schools only. An individual student’s level of poverty may vary within schools. Detail may not sum to totals due to rounding.

SOURCE: Organization for Economic Cooperation and Development (OECD), Program for International Student Assessment (PISA), 2018.


It is these 7 percent of students who could be considered “resilient” and may be of interest for further study. For example, research could identify if there are factors that are associated with their high performance when compared to their lower performing peers in similar schools. Research on academically resilient students that used eighth-grade data from TIMSS found, for example, that having high educational aspirations increased the likelihood that students with few home education resources performed at or above the TIMSS Intermediate international benchmark in mathematics.[3] Experiencing less bullying also increased this likelihood.

Examining the “resilient” PISA financial literacy students more closely could also determine the extent to which their individual backgrounds are related to performance. This would be of interest because, even within high-poverty schools, students’ individual circumstances may vary. 

Patterns in Other PISA Subjects

There are similar subsets of “resilient” students in the other PISA 2018 subjects (table 1). Eight percent of high performers in reading were from the highest poverty schools, as were 5 percent of high performers in mathematics and 7 percent of high performers in science.


Table 1. Percentage of U.S. 15-year-olds in public schools scoring at or above level 5 of proficiency, by PISA subject and their schools’ free or reduced-price lunch (FRPL) status: 2018

[Standard errors appear in parentheses]

NOTE: Results are scaled separately; thus, percentages cannot be compared across subjects. Level 5 is the highest level of proficiency in financial literacy; levels 5 and 6 are the highest levels of proficiency in the other PISA subjects. Data for students eligible for FRPL were available for public schools only.

SOURCE: Organization for Economic Cooperation and Development (OECD), Program for International Student Assessment (PISA), 2018.


For more information on the PISA 2018 results in financial literacy and other subjects, visit the NCES International Activities website. To create customized data and charts using PISA and other international assessment data, use the International Data Explorer.


By Maria Stephens, AIR


[2] Data for students eligible for FRPL are available for public schools only.

[3] Students at the Intermediate international benchmark can apply basic mathematical knowledge in a variety of situations, and those above this benchmark can do so in increasingly complex situations and, at the highest end, reason with information, draw conclusions, make generalizations, and solve linear equations.