IES Blog

Institute of Education Sciences

Seeking your feedback on the Regional Educational Laboratory program

IES is seeking feedback about what is working well in the current Regional Educational Laboratories (REL) program, what can be improved, and the kinds of resources and services related to evidence-based practice and data use that are most needed by educators and policymakers to improve student outcomes. We are seeking comments that are practical, specific, and actionable, and that demonstrate a familiarity with the mission and work of the RELs.

We are particularly interested in responses to these questions:

  • What types of materials or tools would be helpful to educators implementing What Works Clearinghouse Practice Guide Recommendations or other evidence-based practices? Are there other ways the RELs could make research evidence more accessible for educators and administrators?
     
  • What types of data and research support are most needed by educators and policymakers to improve student outcomes?
     
  • IES believes that robust partnerships, comprised of a diverse set of stakeholders, are critical to the translation and mobilization of evidence-based practices. Currently, research partnerships are a centerpiece of the REL program. What working models have you observed to be particularly effective in improving student outcomes?  
     
  • In what ways can RELs best serve the country as well as their designated regions?

Please send feedback to NCEE.Feedback@ed.gov by September 6, 2019. 


Leading experts provide evidence-based recommendations on using technology to support postsecondary student learning

By Michael Frye and Sarah Costelloe. Both are part of Abt Associates team working on the What Works Clearinghouse.

Technology is part of almost every aspect of college life. Colleges use technology to improve student retention, offer active and engaging learning, and help students become more successful learners. The What Works Clearinghouse’s latest practice guide, Using Technology to Support Postsecondary Student Learning, offers several evidence-based recommendations to help higher education instructors, instructional designers, and administrators use technology to improve student learning outcomes.

IES practice guides incorporate research, practitioner experience, and expert opinions from a panel of nationally recognized experts. The panel that developed Using Technology to Support Postsecondary Student Learning included five experts with many years of experience leading the adoption, use, and research of technology in postsecondary classrooms.  Together, guided by Abt Associates’ review of the rigorous research on the topic, the Using Technology to Support Postsecondary Student Learning offers five evidence-based recommendations:

Practice Recommendations: Use communication and collaboration tools to increase interaction among students and between students and instructors, Minimal evidence. 2. Use varied, personalized, and readily available digital resources to design and deliver instructional content, moderate evidence. 3. Incorporate technology that models and fosters self-regulated learning strategies. Moderate evidence. 4. Use technology to provide timely and targeted feedback on student performance, moderate evidence. 5. Use simulation technologies that help students engage in complex problem-solving, minimal evidence.


Each recommendation is assigned an evidence level of minimal, moderate, or strong. The level of evidence reflects how well the research demonstrates the effectiveness of the recommended practices. For an explanation of how levels of evidence are determined, see the Practice Guide Level of Evidence Video.   The evidence-based recommendations also include research-based strategies and examples for implementation in postsecondary settings. Together, the recommendations highlight five interconnected themes that the practice guide’s authors suggest readers consider:

  • Focus on how technology is used, not on the technology itself.

“The basic act of teaching has actually changed very little by the introduction of technology into the classroom,” said panelist MJ Bishop, “and that’s because simply introducing a new technology changes nothing unless we first understand the need it is intended to fill and how to capitalize on its unique capabilities to address that need.” Because technology evolves rapidly, understanding specific technologies is less important than understanding how technology can be used effectively in college settings. “By understanding how a learning outcome can be enhanced and supported by technologies,” said panelist Jennifer Sparrow, “the focus stays on the learner and their learning.”

  • Technology should be aligned to specific learning goals.

Every recommendation in this guide is based on one idea: finding ways to use technology to engage students and enhance their learning experiences. Technology can engage students more deeply in learning content, activate their learning processes, and provide the social connections that are key to succeeding in college and beyond. To do this effectively, any use of technology suggested in this guide must be aligned with learning goals or objectives. “Technology is not just a tool,” said Panel Chair Nada Dabbagh. “Rather, technology has specific affordances that must be recognized to use it effectively for designing learning interactions. Aligning technology affordances with learning outcomes and instructional goals is paramount to successful learning designs.”

  • Pay attention to potential issues of accessibility.

The Internet is ubiquitous, but many households—particularly low-income households and those of recent immigrants and in rural communities—may not be able to afford or otherwise access digital communications. Course materials that rely heavily on Internet access may put these students at a disadvantage. “Colleges and universities making greater use of online education need to know who their students are and what access they have to technology,” said panelist Anthony Picciano. “This practice guide makes abundantly clear that colleges and universities should be careful not to be creating digital divides.”

Instructional designers must also ensure that learning materials on course websites and course/learning management systems can accommodate students who are visually and/or hearing impaired. “Technology can greatly enhance access to education both in terms of reaching a wide student population and overcoming location barriers and in terms of accommodating students with special needs,” said Dabbagh. “Any learning design should take into consideration the capabilities and limitations of technology in supporting a diverse and inclusive audience.”

  • Technology deployments may require significant investment and coordination.

Implementing any new intervention takes training and support from administrators and teaching and learning centers. That is especially true in an environment where resources are scarce. “In reviewing the studies for this practice guide,” said Picciano, “it became abundantly clear that the deployment of technology in our colleges and universities has evolved into a major administrative undertaking. Careful planning that is comprehensive, collaborative, and continuous is needed.”

“Hardware and software infrastructure, professional development, academic and student support services, and ongoing financial investment are testing the wherewithal of even the most seasoned administrators,” said Picciano. “Yet the dynamic and changing nature of technology demands that new strategies be constantly evaluated and modifications made as needed.”

These decisions are never easy. “Decisions need to be made,” said Sparrow, “about investment cost versus opportunity cost. Additionally, when a large investment in a technology has been made, it should not be without investment in faculty development, training, and support resources to ensure that faculty, staff, and students can take full advantage of it.”

  • Rigorous research is limited and more is needed.

Despite technology’s ubiquity in college settings, rigorous research on the effects of technological interventions on student outcomes is rather limited. “It’s problematic,” said Bishop, “that research in the instructional design/educational technology field has been so focused on things, such as technologies, theories, and processes, rather than on the problems we’re trying to solve with those things, such as developing critical thinking, enhancing knowledge transfer, and addressing individual differences. It turns out to be very difficult to cross-reference the instructional design/educational technology literature with the questions the broader field of educational research is trying to answer.”

More rigorous research is needed on new technologies and how best to support instructors and administrators in using them. “For experienced researchers as well as newcomers,” said Picciano, “technology in postsecondary teaching and learning is a fertile ground for further inquiry and investigation.”

Readers of this practice guide are encouraged to adapt the advice provided to the varied contexts in which they work. The five themes discussed above serve as a lens to help readers approach the guide and decide whether and how to implement some or all of the recommendations.

Download Using Technology to Support Postsecondary Student Learning from the What Works Clearinghouse website at https://ies.ed.gov/ncee/wwc/PracticeGuide/25.


Announcing the Condition of Education 2019 Release

We are pleased to present The Condition of Education 2019, a congressionally mandated annual report summarizing the latest data on education in the United States. This report is designed to help policymakers and the public monitor educational progress. This year’s report includes 48 indicators on topics ranging from prekindergarten through postsecondary education, as well as labor force outcomes and international comparisons.

In addition to the regularly updated annual indicators, this year’s spotlight indicators show how recent NCES surveys have expanded our understanding of outcomes in postsecondary education.

The first spotlight examines the variation in postsecondary enrollment patterns between young adults who were raised in high- and low-socioeconomic status (SES) families. The study draws on data from the NCES High School Longitudinal Study of 2009, which collected data on a nationally representative cohort of ninth-grade students in 2009 and has continued to survey these students as they progress through postsecondary education. The indicator finds that the percentage of 2009 ninth-graders who were enrolled in postsecondary education in 2016 was 50 percentage points larger for the highest SES students (78 percent) than for the lowest SES students (28 percent). Among the highest SES 2009 ninth-graders who had enrolled in a postsecondary institution by 2016, more than three-quarters (78 percent) first pursued a bachelor’s degree and 13 percent first pursued an associate’s degree. In contrast, the percentage of students in the lowest SES category who first pursued a bachelor’s degree (32 percent) was smaller than the percentage who first pursued an associate’s degree (42 percent). In addition, the percentage who first enrolled in a highly selective 4-year institution was larger for the highest SES students (37 percent) than for the lowest SES students (7 percent).

The complete indicator, Young Adult Educational and Employment Outcomes by Family Socioeconomic Status, contains more information about how enrollment, persistence, choice of institution (public, private nonprofit, or private for-profit and 2-year or 4-year), and employment varied by the SES of the family in which young adults were raised.


Among 2009 ninth-graders who had enrolled in postsecondary education by 2016, percentage distribution of students' first credential pursued at first postsecondary institution, by socioeconomic status: 2016

1 Socioeconomic status was measured by a composite score of parental education and occupations and family income in 2009.
NOTE: Postsecondary outcomes are as of February 2016, approximately 3 years after most respondents had completed high school. Although rounded numbers are displayed, the figures are based on unrounded data. Detail may not sum to totals because of rounding.

SOURCE: U.S. Department of Education, National Center for Education Statistics, High School Longitudinal Study of 2009 (HSLS:09), Base Year and Second Follow-up. See Digest of Education Statistics 2018, table 302.44.


The second spotlight explores new data on postsecondary outcomes, including completion and transfer rates, for nontraditional undergraduate students. While the Integrated Postsecondary Education Data System formerly collected outcomes data only for first-time, full-time students, a new component of the survey includes information on students who enroll part time, transfer among institutions, or leave postsecondary education temporarily but later enroll again. These expanded data are particularly important for 2-year institutions, where higher percentages of students are nontraditional. For example, the indicator finds that, among students who started at public 2-year institutions in 2009, completion rates 8 years after entry were higher among full-time students (30 percent for first-time students and 38 percent for non-first-time students) than among part-time students (16 percent for first-time students and 21 percent for non-first-time students). Also at public 2-year institutions, transfer rates 8 years after entry were higher among non-first-time students (37 percent for part-time students and 30 percent for full-time students) than among first-time students (24 percent for both full-time and part-time students).

For more findings, including information on outcomes for nontraditional students at 4-year institutions, read the complete indicator, Postsecondary Outcomes for Nontraditional Undergraduate Students.


Percentage distribution of students' postsecondary outcomes 8 years after beginning at 2-year institutions in 2009, by initial attendance level and status: 2017

# Rounds to zero.
1 Attendance level (first-time or non-first-time student) and attendance status (full-time or part-time student) are based on the first full term (i.e., semester or quarter) after the student entered the institution. First-time students are those who had never attended a postsecondary institution prior to their 2009–10 entry into the reporting institution.
2 Includes certificates, associate’s degrees, and bachelor’s degrees. Includes only those awards that were conferred by the reporting institution (i.e., the institution the student entered in 2009–10); excludes awards conferred by institutions to which the student later transferred.
3 Refers to the percentage of students who were known transfers (i.e., those who notified their initial postsecondary institution of their transfer). The actual transfer rate (including students who transferred, but did not notify their initial institution) may be higher.
4 Includes students who dropped out of the reporting institution and students who transferred to another institution without notifying the reporting institution.
NOTE: The 2009 entry cohort includes all degree/certificate-seeking undergraduate students who entered a degree-granting institution between July 1, 2009, and June 30, 2010. Student enrollment status and completion status are determined as of August 31 of the year indicated; for example, within 8 years after the student’s 2009–10 entry into the reporting institution means by August 31, 2018. Detail may not sum to totals because of rounding. Although rounded numbers are displayed, the figures are based on unrounded data.

SOURCE: U.S. Department of Education, National Center for Education Statistics, Integrated Postsecondary Education Data System (IPEDS), Winter 2017–18, Outcome Measures component; and IPEDS Fall 2009, Institutional Characteristics component. See Digest of Education Statistics 2018, table 326.27.


The Condition of Education includes an At a Glance section, which allows readers to quickly make comparisons within and across indicators, and a Highlights section, which captures key findings from each indicator. The report also contains a Reader’s Guide, a Glossary, and a Guide to Sources that provide additional background information. Each indicator provides links to the source data tables used to produce the analyses.

As new data are released throughout the year, indicators will be updated and made available on The Condition of Education website. In addition, NCES produces a wide range of reports and datasets designed to help inform policymakers and the public. For more information on our latest activities and releases, please visit our website or follow us on TwitterFacebook, and LinkedIn.


By James L. Woodworth, NCES Commissioner

Equity Through Innovation: New Models, Methods, and Instruments to Measure What Matters for Diverse Learners

In today’s diverse classrooms, it is both challenging and critical to gather accurate and meaningful information about student knowledge and skills. Certain populations present unique challenges in this regard – for example, English learners (ELs) often struggle on assessments delivered in English. On “typical” classroom and state assessments, it can be difficult to parse how much of an EL student’s performance stems from content knowledge, and how much from language learner status. This lack of clarity makes it harder to make informed decisions about what students need instructionally, and often results in ELs being excluded from challenging (or even typical) coursework.

Over the past several years, NCER has invested in several grants to design innovative assessments that will collect and deliver better information about what ELs know and can do across the PK-12 spectrum. This work is producing some exciting results and products.

  • Jason Anthony and his colleagues at the University of South Florida have developed the School Readiness Curriculum Based Measurement System (SR-CBMS), a collection of measures for English- and Spanish-speaking 3- to 5-year-old children. Over the course of two back-to-back Measurement projects, Dr. Anthony’s team co-developed and co-normed item banks in English and Spanish in 13 different domains covering language, math, and science. The assessments are intended for a variety of uses, including screening, benchmarking, progress monitoring, and evaluation. The team used item development and evaluation procedures designed to assure that both the English and Spanish tests are sociolinguistically appropriate for both monolingual and bilingual speakers.


  • Daryl Greenfield and his team at the University of Miami created Enfoque en Ciencia, a computerized-adaptive test (CAT) designed to assess Latino preschoolers’ science knowledge and skills. Enfoque en Ciencia is built on 400 Spanish-language items that cover three science content domains and eight science practices. The items were independently translated into four major Spanish dialects and reviewed by a team of bilingual experts and early childhood researchers to create a consensus translation that would be appropriate for 3 to 5 year olds. The assessment is delivered via touch screen and is equated with an English-language version of the same test, Lens on Science.

  • A University of Houston team led by David Francis is engaged in a project to study the factors that affect assessment of vocabulary knowledge among ELs in unintended ways. Using a variety of psychometric methods, this team explores data from the Word Generation Academic Vocabulary Test to identify features that affect item difficulty and explore whether these features operate similarly for current, former, as well as students who have never been classified as ELs. The team will also preview a set of test recommendations for improving the accuracy and reliability of extant vocabulary assessments.


  • Researchers led by Rebecca Kopriva at the University of Wisconsin recently completed work on a set of technology-based, classroom-embedded formative assessments intended to support and encourage teachers to teach more complex math and science to ELs. The assessments use multiple methods to reduce the overall language load typically associated with challenging content in middle school math and science. The tools use auto-scoring techniques and are capable of providing immediate feedback to students and teachers in the form of specific, individualized, data-driven guidance to improve instruction for ELs.


By leveraging technology, developing new item formats and scoring models, and expanding the linguistic repertoire students may access, these teams have found ways to allow ELs – and all students – to show what really matters: their academic content knowledge and skills.


Written by Molly Faulkner-Bond (former NCER program officer).


Weighted Student Funding Is On The Rise. Here’s What We Are Learning.

Weighted student funding (WSF) is a funding method that aims to allocate funding based on individual student needs. While large districts are increasingly using WSF systems, little research exists to assess their effectiveness. In this guest blog, Dr. Marguerite Roza, Georgetown University, discusses her team’s ongoing IES-funded research study that seeks to document and understand WSF designs and features as implemented in the field, and to gauge the extent to which WSF designs are associated with reducing achievement gaps. The study’s initial findings chart the WSF landscape across 19 U.S. school districts that used WSF in 2017-18.

Over the last two decades, dozens of big districts (including those in New York City, Boston, Denver, Houston, and Chicago) have shifted to using a weighted student formula to distribute some portion of their total budget. Instead of distributing resources via uniform staffing formulas, these districts use a student-based formula to allocate some fixed sum of dollars to schools for each student based on need (for example, allocations are typically higher for students with disabilities and students with limited English proficiency). The 2015 Every Student Succeeds Act (ESSA) authorized a WSF pilot, allowing up to 50 districts to incorporate key federal program dollars into a district’s formula.

As WSF systems now serve millions of K–12 students—and the number of WSF districts continues to grow—our research begins to document the range of these WSF formulas and gather details around how they are being implemented in school systems around the nation.

Why do districts adopt WSF?

Our study of school board and budget documentation indicates that nearly all districts identify equity (89%) and flexibility for school principals (79%) as a key rationale, with nearly half also citing a goal of transparency (49%). Interestingly, not one of the 19 districts cite “choice” (whereby families choose their school) as a driving factor in the rationale for using WSF even though much of the literature links choice and WSF. Despite the goal of transparency, only a third of the districts actually post their formulas online (like this posting from Houston ISD)—a finding that surprised us and them.  In fact, after we shared the finding with our study districts, several updated their online budget materials to include their formulas. Whether districts are meeting their goals of equity and flexibility will be more fully investigated in Phase 2 of the project.

Is there a typical WSF model that districts are using?

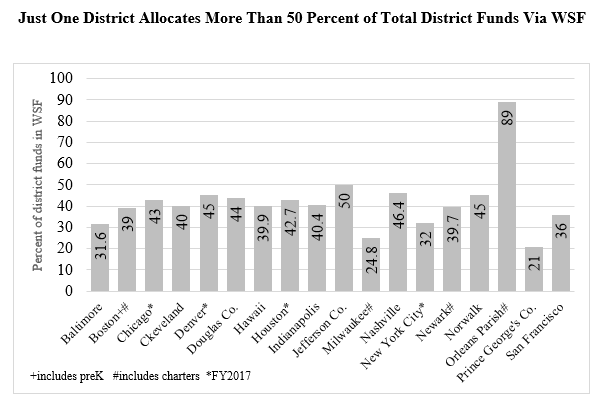
No. We find that there is no standard WSF: Each district has developed a home-grown formula and differences are substantial. On one end of the spectrum, Prince George’s County deploys only 20% of its total budget via its WSF, while Orleans Parish deploys 89%. Most districts deploy some 30-50% of their annual funds via their WSF formula, indicating that they are adopting a hybrid approach. They deploy the rest of their funds via staff allocations, program allocations, or in whatever ways they did before moving to WSF.


Districts define their “base” allocations differently, and no two districts use the same student weights. Most commonly, districts use grade level as a student weight category, but they do not agree on which level of schooling warranted the highest weight. Seven districts give their highest grade-level weight to elementary grades, four give it to middle school grades, and four give the highest weight to high schoolers.

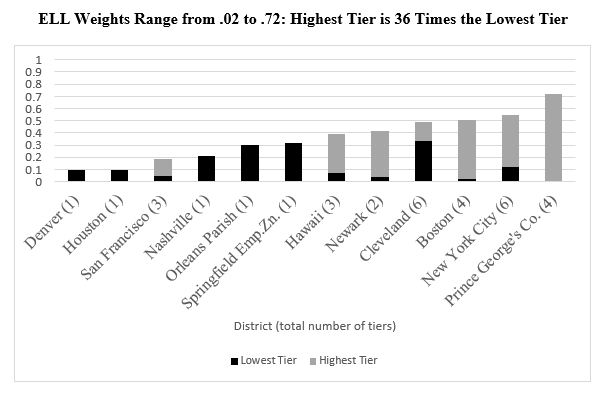
Two thirds of districts use weights for students identified as English Language Learners (ELL) and as having disabilities, while half use weights for poverty. Even the size of the weights differs, with ELL weights ranging from 10% to 70%. Several districts use tiered weights.

We also found a range of unique weights designed within the districts for categories of locally identified need (for example, Boston uses a weight for students with interrupted formal learning, and Houston uses a weight for students who are refugees).

What other trends exist in districts implementing WSF?

We found that non-formula features and exemptions reflect local context. Small school subsidies, magnet allocations, and foundation amounts are common examples of non-formula features that several districts use. Some districts exempt some schools from the formula, grant weights for school types (vs student types), or fund selected staffing positions outside the formula. Districts seem to be layering their WSF formulas on top of long-standing allocations, like subsidies for small schools. Clearly, it is difficult for most districts to deploy a strict formula, and these exemptions or adjustments have the effect of mitigating the formula’s effects on some schools.

We also found that nearly all districts continue to use average salaries in their budgeting, likely limiting their goals for equity. In this practice, schools are charged for their teaching staff based on district-wide average salaries, not the actual salaries of teachers in the building. Districts in Boston and Denver have experimented with the use of real salaries for a subset of their schools (allowing for roughly one-third of their schools to budget and account for spending based on actual salaries).  Both the formula exceptions and this continued reliance on average salaries may be limiting the extent to which WSF is making progress on equity. Analysis in Phase 2 of the project will quantify the effects of these formula adjustments on spending.

What kinds of budget flexibilities do principals have?

With WSF, districts give principals flexibility in staffing, stipends, and contracts, but not base compensation. In virtually all WSF districts, principals had at least some flexibility in choosing the number and type of staff in their buildings and in awarding stipends. Interestingly, most principals had power to issue contracts with their funds, and half could carry over funds from one year to the next.  Despite these flexibilities, base teacher compensation is generally off limits for principals and continues to be controlled centrally.

How difficult is it for districts to design and implement their own versions of WSF?

Changing district allocations is hard work. At each point in our study, we find districts building “homegrown” approaches to WSF that reflect their own spending history and local context. We could see this as a practical transition of sorts between old and new allocation strategies, where district leaders straddle both the desires to change allocations and the pressures to keep allocations the way they are.

What are the next steps in this research?

Future analysis in this project will explore the degree to which WSF is delivering on the goal of increasing equity and outcomes for poor and at-risk students. However, the homegrown nature of WSF makes it tough to generalize about the WSF model or its effects. Undoubtedly, the variation poses problems for research. Clearly there’s no way to analyze WSF as a single model. Also challenging is that districts use different definitions (even on formula items such as the “base” and what constitutes a student weight). Perhaps this is unsurprising as there is no common training on the WSF model, and no prevailing terminology or budgeting procedures for district leaders to use in their work.

We see our study as a first step in a broader research agenda that will explore the scope and range of implementation of WSF in U.S. school districts and offer deeper analysis of the extent to which WSF is helping systems meet commonly cited goals of greater equity, flexibility and transparency. Meantime, we hope WSF systems and those considering shifting to WSF will be able to learn from this work and what peer systems are doing, perhaps with the ultimate effect of creating a common vocabulary for this financial model.