NCES is pleased to present the 2022 edition of the Condition of Education. The Condition is part of a 150-year tradition at NCES and provides historical and contextual perspectives on key measures of educational progress to Congress and the American public. This report uses data from across NCES and from other sources and is designed to help policymakers and the public monitor the latest developments and trends in U.S. education.
The foundation of the Condition of Education is a series of online indicators. Fifty-two of these indicators include content that has been updated this year. Each indicator provides detailed information on a unique topic, ranging from prekindergarten through postsecondary education, as well as labor force outcomes and international comparisons. In addition to the online indicator system, a synthesized overview of findings across topics is presented in the Report on the Condition of Education.
This year, we are excited to begin the rollout of interactive figures. These new interactive figures will empower users to explore the data in different ways. A selection of these indicators are highlighted here. They show various declines in enrollment that occurred during the coronavirus pandemic, from early childhood through postsecondary education. (Click the links below to explore the new interactive figures!)
- From 2019 to 2020, enrollment rates of young children fell by 6 percentage points for 5-year-olds (from 91 to 84 percent) and by 13 percentage points for 3- to 4-year-olds (from 54 to 40 percent).
- Public school enrollment in prekindergarten through grade 12 dropped from 50.8 million in fall 2019 to 49.4 million students in fall 2020. This 3 percent drop brought total enrollment back to 2009 levels (49.4 million), erasing a decade of steady growth.
- At the postsecondary level, total undergraduate enrollment decreased by 9 percent from fall 2009 to fall 2020 (from 17.5 million to 15.9 million students). For male and female students, enrollment patterns exhibited similar trends between 2009 and 2019 (both decreasing by 5 percent). However, from 2019 to 2020, female enrollment fell 2 percent, while male enrollment fell 7 percent. Additionally, between 2019 and 2020, undergraduate enrollment fell 5 percent at public institutions and 2 percent at private nonprofit institutions. In contrast, undergraduate enrollment at for-profit institutions was 4 percent higher in fall 2020 than in fall 2019, marking the first positive single year change in enrollments at these institutions since 2010. Meanwhile, at the postbaccalaureate level, enrollment increased by 10 percent between fall 2009 and fall 2020 (from 2.8 million to 3.1 million students).
- Educational attainment is associated with economic outcomes, such as employment and earnings, as well as with changes in these outcomes during the pandemic. Compared with 2010, employment rates among 25- to 34-year-olds were higher in 2021 only for those with a bachelor’s or higher degree (84 vs 86 percent). For those who had completed high school and those with some college, employment rates increased from 2010 to 2019, but these gains were reversed to 68 and 75 percent, respectively, during the coronavirus pandemic. For those who had not completed high school, the employment rate was 53 percent in 2021, which was not measurably different from 2019 or 2010.
This year’s Condition also includes two spotlight indicators. These spotlights use data from the Household Pulse Survey (HPS) to examine education during the coronavirus pandemic.
- Homeschooled Children and Reasons for Homeschooling: This spotlight opens with an examination of historical trends in homeschooling, using data from the National Household Education Survey (NHES). Then, using HPS, this spotlight examines the percentage of adults with students under 18 in the home who were homeschooled during the 2020–21 school year. Some 6.8 percent of adults with students in the home reported that at least one child was homeschooled in 2020–21. The percentage was higher for White adults (7.4 percent) than for Black adults (5.1 percent) and for Asian adults (3.6 percent). It was also higher for Hispanic adults (6.5 percent) than for Asian adults.
- Impact of the Coronavirus Pandemic on Fall Plans for Postsecondary Education: This spotlight uses HPS data to examine changes in plans for fall 2021 postsecondary education made in response to the coronavirus pandemic. Among adults 18 years old and over who had household members planning to take classes in fall 2021 from a postsecondary institution, 44 percent reported that there was no change for any household member in their fall plans for postsecondary classes. This is compared with 28 percent who reported no change in plans for at least one household member one year earlier in the pandemic, for fall 2020.
The Condition also includes an At a Glance section, which allows readers to quickly make comparisons within and across indicators, as well as a Reader’s Guide, a Glossary, and a Guide to Sources that provide additional information to help place the indicators in context. In addition, each indicator references the source data tables that were used to produce that indicator. Most of these are in the Digest of Education Statistics.
In addition to publishing the Condition of Education, NCES produces a wide range of other reports and datasets designed to help inform policymakers and the public about significant trends and topics in education. More information about the latest activities and releases at NCES may be found on our website or by following us on Twitter, Facebook, and LinkedIn.
By Peggy G. Carr, NCES Commissioner
New data suggest that the socioeconomic status of high school freshmen plays a role in their future education and employment.
The data come from the NCES High School Longitudinal Study of 2009 (HSLS:09), which follows a nationally representative group of ninth-graders. In 2009, NCES measured the socioeconomic status (SES) of these students by collecting data on the income, occupation, and educational attainment of their parents or guardians. In 2016, NCES conducted a follow-up survey with the 2009 ninth-graders, gathering data on their educational and employment status.
Data show that 2009 ninth-graders who were in the lowest-SES category were 20 percentage points more likely to be neither enrolled in postsecondary education nor working in 2016 than those in the highest-SES category (figure 1). These students were also 50 percentage points less likely to be enrolled in postsecondary institutions than those in the highest-SES category (figure 2).
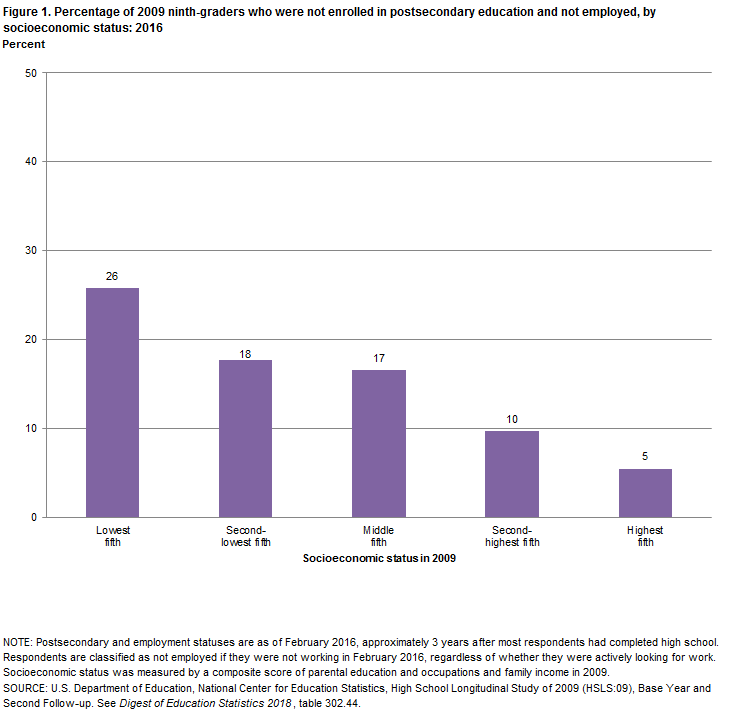
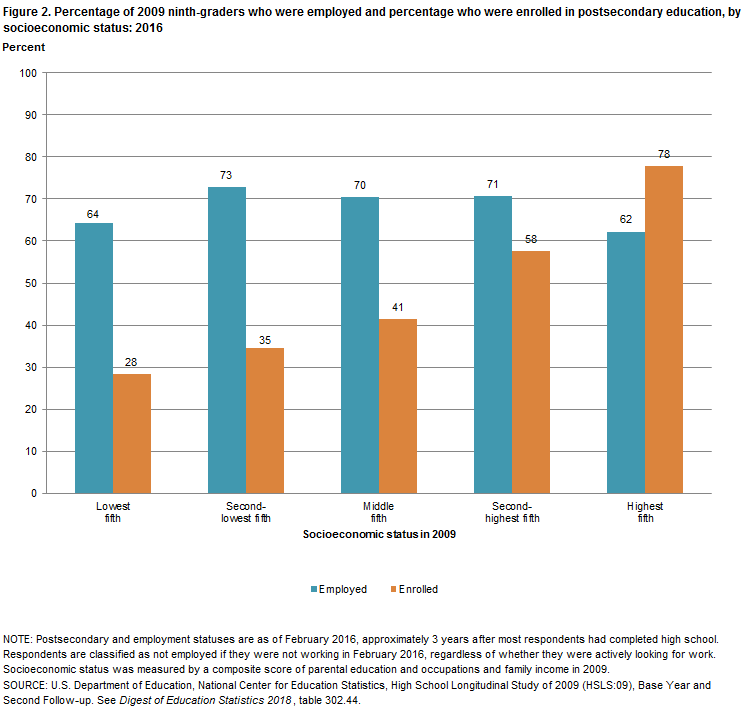
These findings are just a glimpse into the insights on socioeconomic mobility that HSLS:09 can generate by linking data on parent and child educational attainment and employment.
Check out our recent spotlight indicator in the Condition of Education for more information on how the educational and employment outcomes of young adults varied in relation to family socioeconomic status.
By Joel McFarland
Full-time teachers in public school earned an average of $59,050 from all income sources in the 2015–16 school year. This income includes teachers’ base teaching salary, as well as additional sources of income from their schools or districts, jobs outside the school system, and summer activities. To capture the different ways that teachers can earn income, the 2015-16 National Teacher and Principal Survey asked teachers questions about how much they earned from various sources:
- Base teaching salary. Teachers’ average base teaching salary was $55,120 for the 2015-16 school year.
- School supplement. About 44 percent of teachers received additional compensation for extracurricular or additional activities in their school system, such as coaching, sponsoring student activities, mentoring teachers, or teaching evening classes. These teachers earned an average of $2,630 for these activities.
- Merit pay. Some teachers earned merit pay or pay-for-performance income based on their students’ performance. About 6 percent of teachers received this type of additional compensation, with an average amount awarded of $1,470.
- Other school system support. About 8 percent of teachers received income during the school year from some other source in their school system, such as a state supplement, for an average of $2,670.

- Outside jobs. During the 2015-16 school year, 18 percent of teachers held a job outside the school system, earning an average of $5,140. Teachers categorized these jobs as teaching or tutoring (5 percent), non-teaching but related to the teaching field (4 percent), or in another field (9 percent).
- Summer jobs. In the summer of 2015, before the start of the 2015-16 school year, 20 percent of teachers earned income from either a school-based teaching position, such as teaching summer school, or a non-teaching position, and 16 percent earned income from a non-school job. Teachers earned an average of $2,700 from school-based summer positions, and an average of $4,060 in a non-school job.
To learn about teachers’ satisfaction with their teaching salary, more information is available in the short report Teacher Satisfaction with Salary and Current Job.
The National Teacher and Principal Survey (NTPS) includes data on a wide variety of other topics as well. Visit the website to learn more.
By Maura Spiegelman
By Lauren Musu-Gillette
Putting educational and economic outcomes in the United States within a global context can help researchers, policy makers, and the public understand how individuals in the U.S. compare to their peers internationally. Education at a Glance, an annual publication produced by the Organisation for Economic Co-operation and Development (OECD), provides data on the structure, finances and progress of education systems in the 35 OECD countries, including the U.S., as well as a number of partner countries. This type of data is important to understand as our students compete in an increasingly global society.
The recently released 2016 edition of the report indicates that the U.S. is above the average on some measures, but there are others presented in the report in which the U.S. lags behind our international peers.
For instance, the share of U.S. adults with a postsecondary education remains above the OECD average. In the U.S., 45 percent of adults, ages 25-64, have at least some postsecondary education, which is 10 percentage points above the OECD average. However, this advantage is shrinking because the postsecondary enrollment in other OECD countries is increasing more rapidly than in the U.S., where enrollment rates have begun to level off.
The United States continues to be a global leader in attracting international students to attend our postsecondary institutions at the postbaccalaureate level. In 2014, international students made up only 3.5 percent of students enrolled in bachelor’s or equivalent programs, compared with 9% in master’s or equivalent programs and 35% in doctoral or equivalent programs. The U.S., along with the United Kingdom and France, attract more than half of master's and doctoral international students worldwide.
In terms of labor market outcomes, gender disparities in earnings are wider in the U.S. than the OECD average. Among adults in the U.S. with postsecondary education, women earn only 68% of what men earn. This gender gap is larger than the gap for all other OECD countries except Brazil, Chile, Israel, Mexico and the Slovak Republic. Similar gaps exist for males and females in the U.S. across all levels of education.
This is just a small slice of the information that can be found in Education at a Glance 2016. You can also find a wealth of other data on topics of perennial interest, such as the percentage of 3- and 4-year-olds enrolled in early childhood education programs; working conditions of teachers, including time spent in the classroom and salary data; and education finance and per-student expenditures. A relatively new feature is an international comparison for states and other subnational units on key education indicators.
Browse the full report to see how the U.S. compares to other countries on these important education-related topics.
By Stephen Provasnik and Holly Xie
Educational attainment is one of the most common measures of workforce preparation and is certainly an important indicator of whether someone is job-ready. But this one metric does not fully capture the variety of skills that can be important to potential employers. One way that NCES measures the basic workplace skills and abilities of U.S. adults is through the Program for the International Assessment of Adult Competencies (PIAAC).[1]
PIAAC includes a number of assessments designed to evaluate real-world skills in three important areas:
- Literacy: The literacy assessment measures the extent to which respondents can understand, evaluate, use, and engage with written text in different contexts, such as home, work, and community;
- Numeracy: The numeracy assessment evaluates respondents’ ability to access, use, interpret and communicate mathematical information that is deemed to be important in the workplace; and
- Problem solving in technology-rich environments: This skill area assesses respondents’ use of digital technology, communication tools, and networks to gather and evaluate information, communicate with others, and perform practical tasks.
The newly released Skills of U.S. Unemployed, Young, and Older Adults in Sharper Focus: Results from the Program for the International Assessment of Adult Competencies (PIAAC) 2012/2014 describes the workforce skill levels of unemployed adults (age 16-65), young adults (age 16-34), and older adults (age 66-74). The report, along with additional data on the NCES website, includes results from the assessments described above, as well as information about respondents’ educational background, work history, the skills they use on the job and at home, their civic engagement, and their health and well-being.
The PIAAC results show a connection between skills and employment. For instance, more than 75 percent of unemployed adults (age 16-65) had attained a high school credential or less. Roughly one-third of these adults (with a high school credential or less) scored at the lowest levels in literacy and about half scored at the lowest levels in numeracy. Overall, adults who were unemployed or out of the labor force performed worse than their employed peers in all areas of the PIAAC.
Percentage of adults age 16 to 65 at each level of proficiency on the PIAAC numeracy scale, by employment status: 2012 and 20141
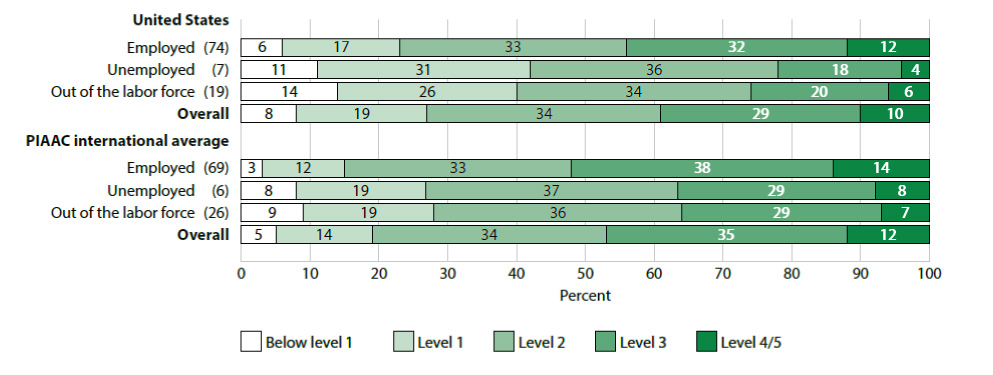 1United States data are the U.S. PIAAC 2012/2014 data. PIAAC international average is calculated from the U.S. PIAAC 2012/2014 data and international data from 2012 for all other countries shown in this report. Country- and region-specific results are available at http://nces.ed.gov/surveys/piaac/results/makeselections.aspx.
SOURCE: U.S. Department of Education, National Center for Education Statistics, Program for the International Assessment of Adult Competencies (PIAAC), Skills of U.S. Unemployed, Young, and Older Adults in Sharper Focus: Results from the Program for the International Assessment of Adult Competencies (PIAAC) 2012/2014: First Look.
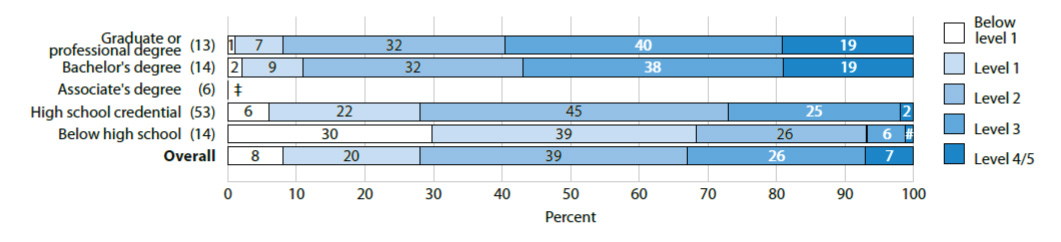
Among young adults age 16-34, the higher the level of education completed, the larger the percentages of young adults at the highest proficiency levels in all three skill areas, and the smaller the percentages at the lowest levels. This pattern was not seen among older U.S. adults (age 66-74). Among older U.S. adults, there was no measurable difference in the percentage performing at the highest levels in literacy or numeracy between those who had a bachelor’s degree and those who had a graduate or professional degree.
Percentage of adults age 66 to 74 at each level of proficiency on the PIAAC literacy scale, by highest level of educational attainment: 2014
 # Rounds to zero.
‡ Reporting standards not met. Sample size insufficient to permit a reliable estimate.
SOURCE: U.S. Department of Education, National Center for Education Statistics, Program for the International Assessment of Adult Competencies (PIAAC), Skills of U.S. Unemployed, Young, and Older Adults in Sharper Focus: Results from the Program for the International Assessment of Adult Competencies (PIAAC) 2012/2014: First Look.
Much more data can be read in the full report. Additional PIAAC data will be released later this year, including information about adults who were incarcerated.
For more information, check out this video:
[1] The PIAAC survey is coordinated internationally by the OECD. NCES implements PIAAC in the United States. PIAAC is a household survey administered by trained data collectors to a nationally-representative sample of adults, ages 16 through 65, in each country, in the official language(s), and in most cases, in respondents’ homes on a laptop computer. PIAAC was first conducted in 2011-2012 and results were released in October 2013 with data from 23 countries, including the United States.
The findings reported here are based on data from the first round of PIAAC and a second round conducted in 2013-2014 in the United States to collect additional data on key subgroups of the adult population. To learn more about the U.S. administration and reporting of PIAAC, as well as related data tools, see https://nces.ed.gov/surveys/piaac/.