IES Blog

Institute of Education Sciences

NCES Celebrates LGBTQ+ Pride Month

June is LGBTQ+ Pride Month, and NCES is proud to share some of the work we have undertaken to collect data on the characteristics and well-being of sexual and gender minority populations.

Inclusion of questions about sexual orientation and gender identity on federal surveys allows for better understanding of sexual and gender minority populations relative to the general population. These sexual orientation and gender identity (SOGI) data meet a critical need for information to understand trends within larger population groups, and insights gained from analysis of the data can lead to potential resources and needed interventions being provided to better serve the community. Giving respondents the opportunity to describe themselves and bring their “whole self” to a questionnaire helps them to be seen and heard by researchers and policymakers.

Sometimes, NCES is asked why questions like this appear on an education survey. They can be sensitive questions for some people, after all. NCES asks these questions to be able to understand the different experiences, equity, and outcomes related to education for sexual and gender minorities, just as NCES does for groups identified by other demographic characteristics like race, ethnicity, household income, and what part of the country someone lives in. By sexual minorities, we mean people who report their sexual orientation to be something other than straight or heterosexual, and by gender minorities, we mean people whose sex as recorded at birth is different from their gender.

Over the past 10 years, NCES has researched how to best ask respondents about their sexual orientation and gender identity, how respondents react to these questions, and the quality of data that NCES has collected on these characteristics.

At NCES, several studies include background questions for adults about their sexual orientation and gender identity. These are the High School Longitudinal Study: 2009 (HSLS:09) Second Follow-up in 2016, the Baccalaureate and Beyond Longitudinal Study (B&B) 08/18 and 16/21 collections, the National Postsecondary Student Aid Study (NPSAS) in 2020, and the Beginning Postsecondary Students Longitudinal Study (BPS) 2020/22 (see table below for more details about these surveys).


The collection of these data allows NCES to describe the experiences of gender and sexual minority individuals. For example:

  • In 2020, postsecondary students who identified as genderqueer, gender nonconforming, or a different identity had difficulty finding safe and stable housing at three times the rate (9 percent) of students who identified as male or female (3 percent each).1
     
  • In 2018, about 10 years after completing a 2007–08 bachelor’s degree, graduates who were gender minorities2 described their financial situations. Graduates who were gender minorities were less likely to own a home (31 percent) or hold a retirement account (74 percent) than graduates who were not gender minorities (63 percent and 87 percent, respectively) (figure 1).3  

Figure 1. Percentage of 2007–08 bachelor’s degree recipients who owned a home, had a retirement account, reported negative net worth, and did not meet essential expenses in the past 12 months, by gender minority status in 2018

NOTE: “Retirement account” includes both employer-based retirement accounts such as 401(k), 403(b), and pensions, and non-employer-based retirement accounts such as individual retirement accounts. Respondents are considered to have negative net worth if they would still be in debt after selling all their major possessions, turning all their investments and other assets into cash, and paying off as many debts as they could. “Did not meet essential expenses” refers to being unable to meet essential living expenses such as mortgage or rent payments, utility bills, or important medical care. “Past 12 months” refers to any of the 12 months preceding the interview. Gender minority indicates whether the respondent’s gender identity differed from the sex assigned at birth. Gender identity categories include male; female; transgender, male-to-female; transgender, female-to-male; genderqueer or gender nonconforming; a different gender identity; and more than one gender identity.
SOURCE: U.S. Department of Education, National Center for Education Statistics, 2008/18 Baccalaureate and Beyond Longitudinal Study (B&B:08/18).


  • In the 2017–18 school year, 18 percent of public schools had a recognized student group that promoted the acceptance of students’ sexual orientation and gender identity, such as a Gay-Straight Alliance (GSA). This was an increase from the 2015–16 school year, in which 12 percent of schools reported having a GSA.4
     
  • For 2008 bachelor’s degree graduates with a full-time job in 2018, straight people reported higher average salaries than either lesbian/gay or bisexual people.  

NCES is committed to collecting data about equity in education and describing the experiences of SGM students, graduates, and educators.

To learn more about the research conducted at NCES and across the federal statistical system on the measurement of SOGI, please visit the Federal Committee on Statistical Methodology (FCSM) website and check out these two presentations from the FCSM 2022 Research and Policy Conference: How do you Describe Yourself in the Workplace? Asking Teachers about their Sexual Orientation and Gender Identity in a School Survey and Assessing Open-Ended Self-Reports of Sexual Orientation and Gender Identity: Is There Room For Improvement?.


By Maura Spiegelman and Elise Christopher, NCES


[1] U.S. Department of Education, National Center for Education Statistics, 2019–20 National Postsecondary Student Aid Study (NPSAS:20, preliminary data).

[2] On the NCES surveys mentioned above, gender identity categories include male; female; transgender, male-to-female; transgender, female-to-male; genderqueer or gender nonconforming; a different gender identity; and more than one gender identity.

[3] U.S. Department of Education, National Center for Education Statistics, 2008/18 Baccalaureate and Beyond Longitudinal Study (B&B:08/18).

[4] U.S. Department of Education, National Center for Education Statistics, 2015–16 and 2017–18 School Survey on Crime and Safety (SSOCS).

Differences in Postsecondary Enrollment and Employment by Socioeconomic Status

New data suggest that the socioeconomic status of high school freshmen plays a role in their future education and employment.  

The data come from the NCES High School Longitudinal Study of 2009 (HSLS:09), which follows a nationally representative group of ninth-graders. In 2009, NCES measured the socioeconomic status (SES) of these students by collecting data on the income, occupation, and educational attainment of their parents or guardians. In 2016, NCES conducted a follow-up survey with the 2009 ninth-graders, gathering data on their educational and employment status.   

Data show that 2009 ninth-graders who were in the lowest-SES category were 20 percentage points more likely to be neither enrolled in postsecondary education nor working in 2016 than those in the highest-SES category (figure 1). These students were also 50 percentage points less likely to be enrolled in postsecondary institutions than those in the highest-SES category (figure 2).


These findings are just a glimpse into the insights on socioeconomic mobility that HSLS:09 can generate by linking data on parent and child educational attainment and employment.

Check out our recent spotlight indicator in the Condition of Education for more information on how the educational and employment outcomes of young adults varied in relation to family socioeconomic status.


By Joel McFarland


Announcing the Condition of Education 2019 Release

We are pleased to present The Condition of Education 2019, a congressionally mandated annual report summarizing the latest data on education in the United States. This report is designed to help policymakers and the public monitor educational progress. This year’s report includes 48 indicators on topics ranging from prekindergarten through postsecondary education, as well as labor force outcomes and international comparisons.

In addition to the regularly updated annual indicators, this year’s spotlight indicators show how recent NCES surveys have expanded our understanding of outcomes in postsecondary education.

The first spotlight examines the variation in postsecondary enrollment patterns between young adults who were raised in high- and low-socioeconomic status (SES) families. The study draws on data from the NCES High School Longitudinal Study of 2009, which collected data on a nationally representative cohort of ninth-grade students in 2009 and has continued to survey these students as they progress through postsecondary education. The indicator finds that the percentage of 2009 ninth-graders who were enrolled in postsecondary education in 2016 was 50 percentage points larger for the highest SES students (78 percent) than for the lowest SES students (28 percent). Among the highest SES 2009 ninth-graders who had enrolled in a postsecondary institution by 2016, more than three-quarters (78 percent) first pursued a bachelor’s degree and 13 percent first pursued an associate’s degree. In contrast, the percentage of students in the lowest SES category who first pursued a bachelor’s degree (32 percent) was smaller than the percentage who first pursued an associate’s degree (42 percent). In addition, the percentage who first enrolled in a highly selective 4-year institution was larger for the highest SES students (37 percent) than for the lowest SES students (7 percent).

The complete indicator, Young Adult Educational and Employment Outcomes by Family Socioeconomic Status, contains more information about how enrollment, persistence, choice of institution (public, private nonprofit, or private for-profit and 2-year or 4-year), and employment varied by the SES of the family in which young adults were raised.


Among 2009 ninth-graders who had enrolled in postsecondary education by 2016, percentage distribution of students' first credential pursued at first postsecondary institution, by socioeconomic status: 2016

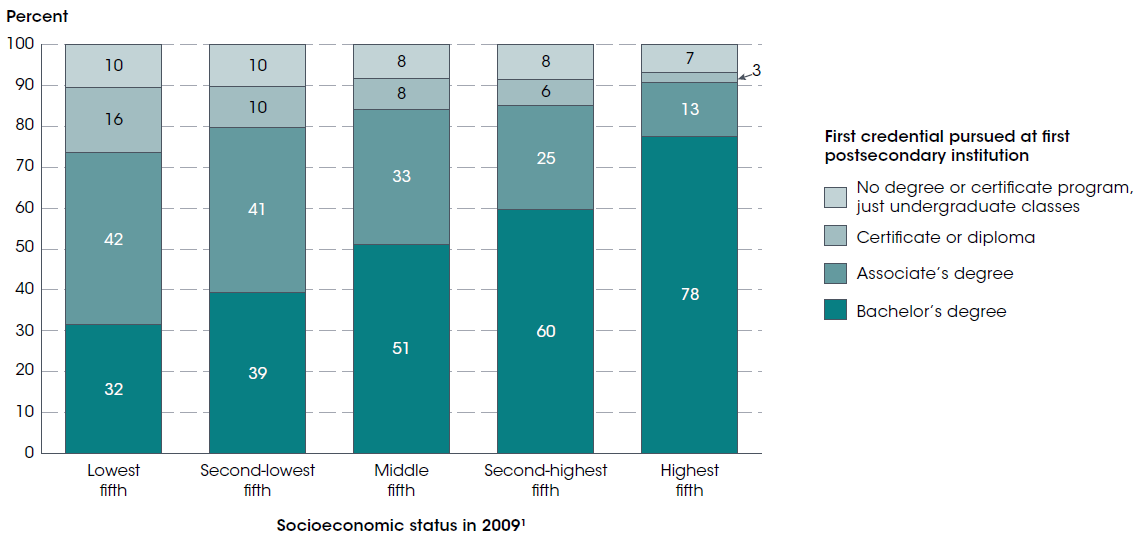
1 Socioeconomic status was measured by a composite score of parental education and occupations and family income in 2009.
NOTE: Postsecondary outcomes are as of February 2016, approximately 3 years after most respondents had completed high school. Although rounded numbers are displayed, the figures are based on unrounded data. Detail may not sum to totals because of rounding.

SOURCE: U.S. Department of Education, National Center for Education Statistics, High School Longitudinal Study of 2009 (HSLS:09), Base Year and Second Follow-up. See Digest of Education Statistics 2018, table 302.44.


The second spotlight explores new data on postsecondary outcomes, including completion and transfer rates, for nontraditional undergraduate students. While the Integrated Postsecondary Education Data System formerly collected outcomes data only for first-time, full-time students, a new component of the survey includes information on students who enroll part time, transfer among institutions, or leave postsecondary education temporarily but later enroll again. These expanded data are particularly important for 2-year institutions, where higher percentages of students are nontraditional. For example, the indicator finds that, among students who started at public 2-year institutions in 2009, completion rates 8 years after entry were higher among full-time students (30 percent for first-time students and 38 percent for non-first-time students) than among part-time students (16 percent for first-time students and 21 percent for non-first-time students). Also at public 2-year institutions, transfer rates 8 years after entry were higher among non-first-time students (37 percent for part-time students and 30 percent for full-time students) than among first-time students (24 percent for both full-time and part-time students).

For more findings, including information on outcomes for nontraditional students at 4-year institutions, read the complete indicator, Postsecondary Outcomes for Nontraditional Undergraduate Students.


Percentage distribution of students' postsecondary outcomes 8 years after beginning at 2-year institutions in 2009, by initial attendance level and status: 2017
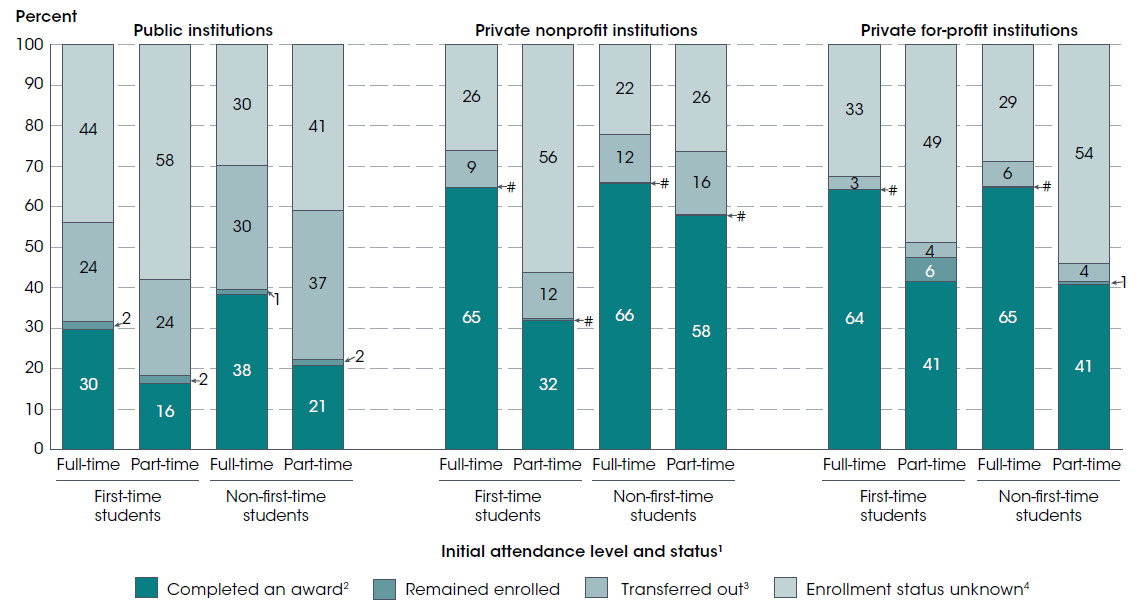
# Rounds to zero.
1 Attendance level (first-time or non-first-time student) and attendance status (full-time or part-time student) are based on the first full term (i.e., semester or quarter) after the student entered the institution. First-time students are those who had never attended a postsecondary institution prior to their 2009–10 entry into the reporting institution.
2 Includes certificates, associate’s degrees, and bachelor’s degrees. Includes only those awards that were conferred by the reporting institution (i.e., the institution the student entered in 2009–10); excludes awards conferred by institutions to which the student later transferred.
3 Refers to the percentage of students who were known transfers (i.e., those who notified their initial postsecondary institution of their transfer). The actual transfer rate (including students who transferred, but did not notify their initial institution) may be higher.
4 Includes students who dropped out of the reporting institution and students who transferred to another institution without notifying the reporting institution.
NOTE: The 2009 entry cohort includes all degree/certificate-seeking undergraduate students who entered a degree-granting institution between July 1, 2009, and June 30, 2010. Student enrollment status and completion status are determined as of August 31 of the year indicated; for example, within 8 years after the student’s 2009–10 entry into the reporting institution means by August 31, 2018. Detail may not sum to totals because of rounding. Although rounded numbers are displayed, the figures are based on unrounded data.

SOURCE: U.S. Department of Education, National Center for Education Statistics, Integrated Postsecondary Education Data System (IPEDS), Winter 2017–18, Outcome Measures component; and IPEDS Fall 2009, Institutional Characteristics component. See Digest of Education Statistics 2018, table 326.27.


The Condition of Education includes an At a Glance section, which allows readers to quickly make comparisons within and across indicators, and a Highlights section, which captures key findings from each indicator. The report also contains a Reader’s Guide, a Glossary, and a Guide to Sources that provide additional background information. Each indicator provides links to the source data tables used to produce the analyses.

As new data are released throughout the year, indicators will be updated and made available on The Condition of Education website. In addition, NCES produces a wide range of reports and datasets designed to help inform policymakers and the public. For more information on our latest activities and releases, please visit our website or follow us on TwitterFacebook, and LinkedIn.


By James L. Woodworth, NCES Commissioner