IES Blog

Institute of Education Sciences

You’ve Been Asked to Participate in a Study

Dear reader,

You’ve been asked to participate in a study.

. . . I know what you’re thinking. Oh, great. Another request for my time. I am already so busy.

Hmm, if I participate, what is my information going to be used for? Well, the letter says that collecting data from me will help researchers study education, and it says something else about how the information I provide would “inform education policy . . .”

But what does that mean?

If you’re a parent, student, teacher, school administrator, or district leader, you may have gotten a request like this from me or a colleague at the National Center for Education Statistics (NCES). NCES is one of 13 federal agencies that conducts survey and assessment research in order to help federal, state, and local policymakers better understand public needs and challenges. It is the U.S. Department of Education’s (ED’s) statistical agency and fulfills a congressional mandate to collect, collate, analyze, and report statistics on the condition of American education. The law also directs NCES to do the same about education across the globe.

But how does my participation in a study actually support the role Congress has given NCES?

Good question. When NCES conducts a study, participants are asked to provide information about themselves, their students or child/children, teachers, households, classrooms, schools, colleges, or other education providers. What exactly you will be asked about is based on many considerations, including previous research or policy needs. For example, maybe a current policy might be based on results from an earlier study, and we need to see if the results are still relevant. Maybe the topic has not been studied before and data are needed to determine policy options. In some cases, Congress has charged NCES with collecting data for them to better understand education in general.

Data collected from participants like you are combined so that research can be conducted at the group level. Individual information is not the focus of the research. Instead, NCES is interested in the experiences of groups of people or groups of institutions—like schools—based on the collected data. To protect respondents, personally identifiable information like your name (and other information that could identify you personally) is removed before data are analyzed and is never provided to others. This means that people who participate in NCES studies are grouped in different ways, such as by age or type of school attended, and their information is studied to identify patterns of experiences that people in these different groups may have had.

Let’s take a look at specific examples that show how data from NCES studies provide valuable information for policy decisions.

When policymakers are considering how data can inform policy—either in general or for a specific law under consideration—data from NCES studies play an important role. For example, policymakers concerned that students in their state/district/city often struggle to pay for college may be interested in this question:

“What can education data tell me about how to make college more affordable?”

Or policymakers further along in the law development process might have more specific ideas about how to help low-income students access college. They may have come across research linking programs such as dual enrollment—when high school students take college courses—to college access for underrepresented college students. An example of this research is provided in the What Works Clearinghouse (WWC) dual-enrollment report produced by ED’s Institute for Education Sciences (IES), which shows that dual-enrollment programs are effective at increasing students’ access to and enrollment in college and attainment of degrees. This was found to be the case especially for students typically underrepresented in higher education.   

Then, these policymakers might need more specific questions answered about these programs, such as:

What is the benefit of high school students from low-income households also taking college courses?”

Thanks to people who participate in NCES studies, we have the data to address such policy questions. Rigorous research using data from large datasets, compiled from many participants, can be used to identify differences in outcomes between groups. In the case of dual-enrollment programs, college outcomes for dual-enrollment participants from low-income households can be compared with those of dual-enrollment participants from higher-income households, and possible causes of those differences can be investigated.

The results of these investigations may then inform enactment of laws or creation of programs to support students. In the case of dual enrollment, grant programs might be set up at the state level for districts and schools to increase students’ local access to dual-enrollment credit earning.

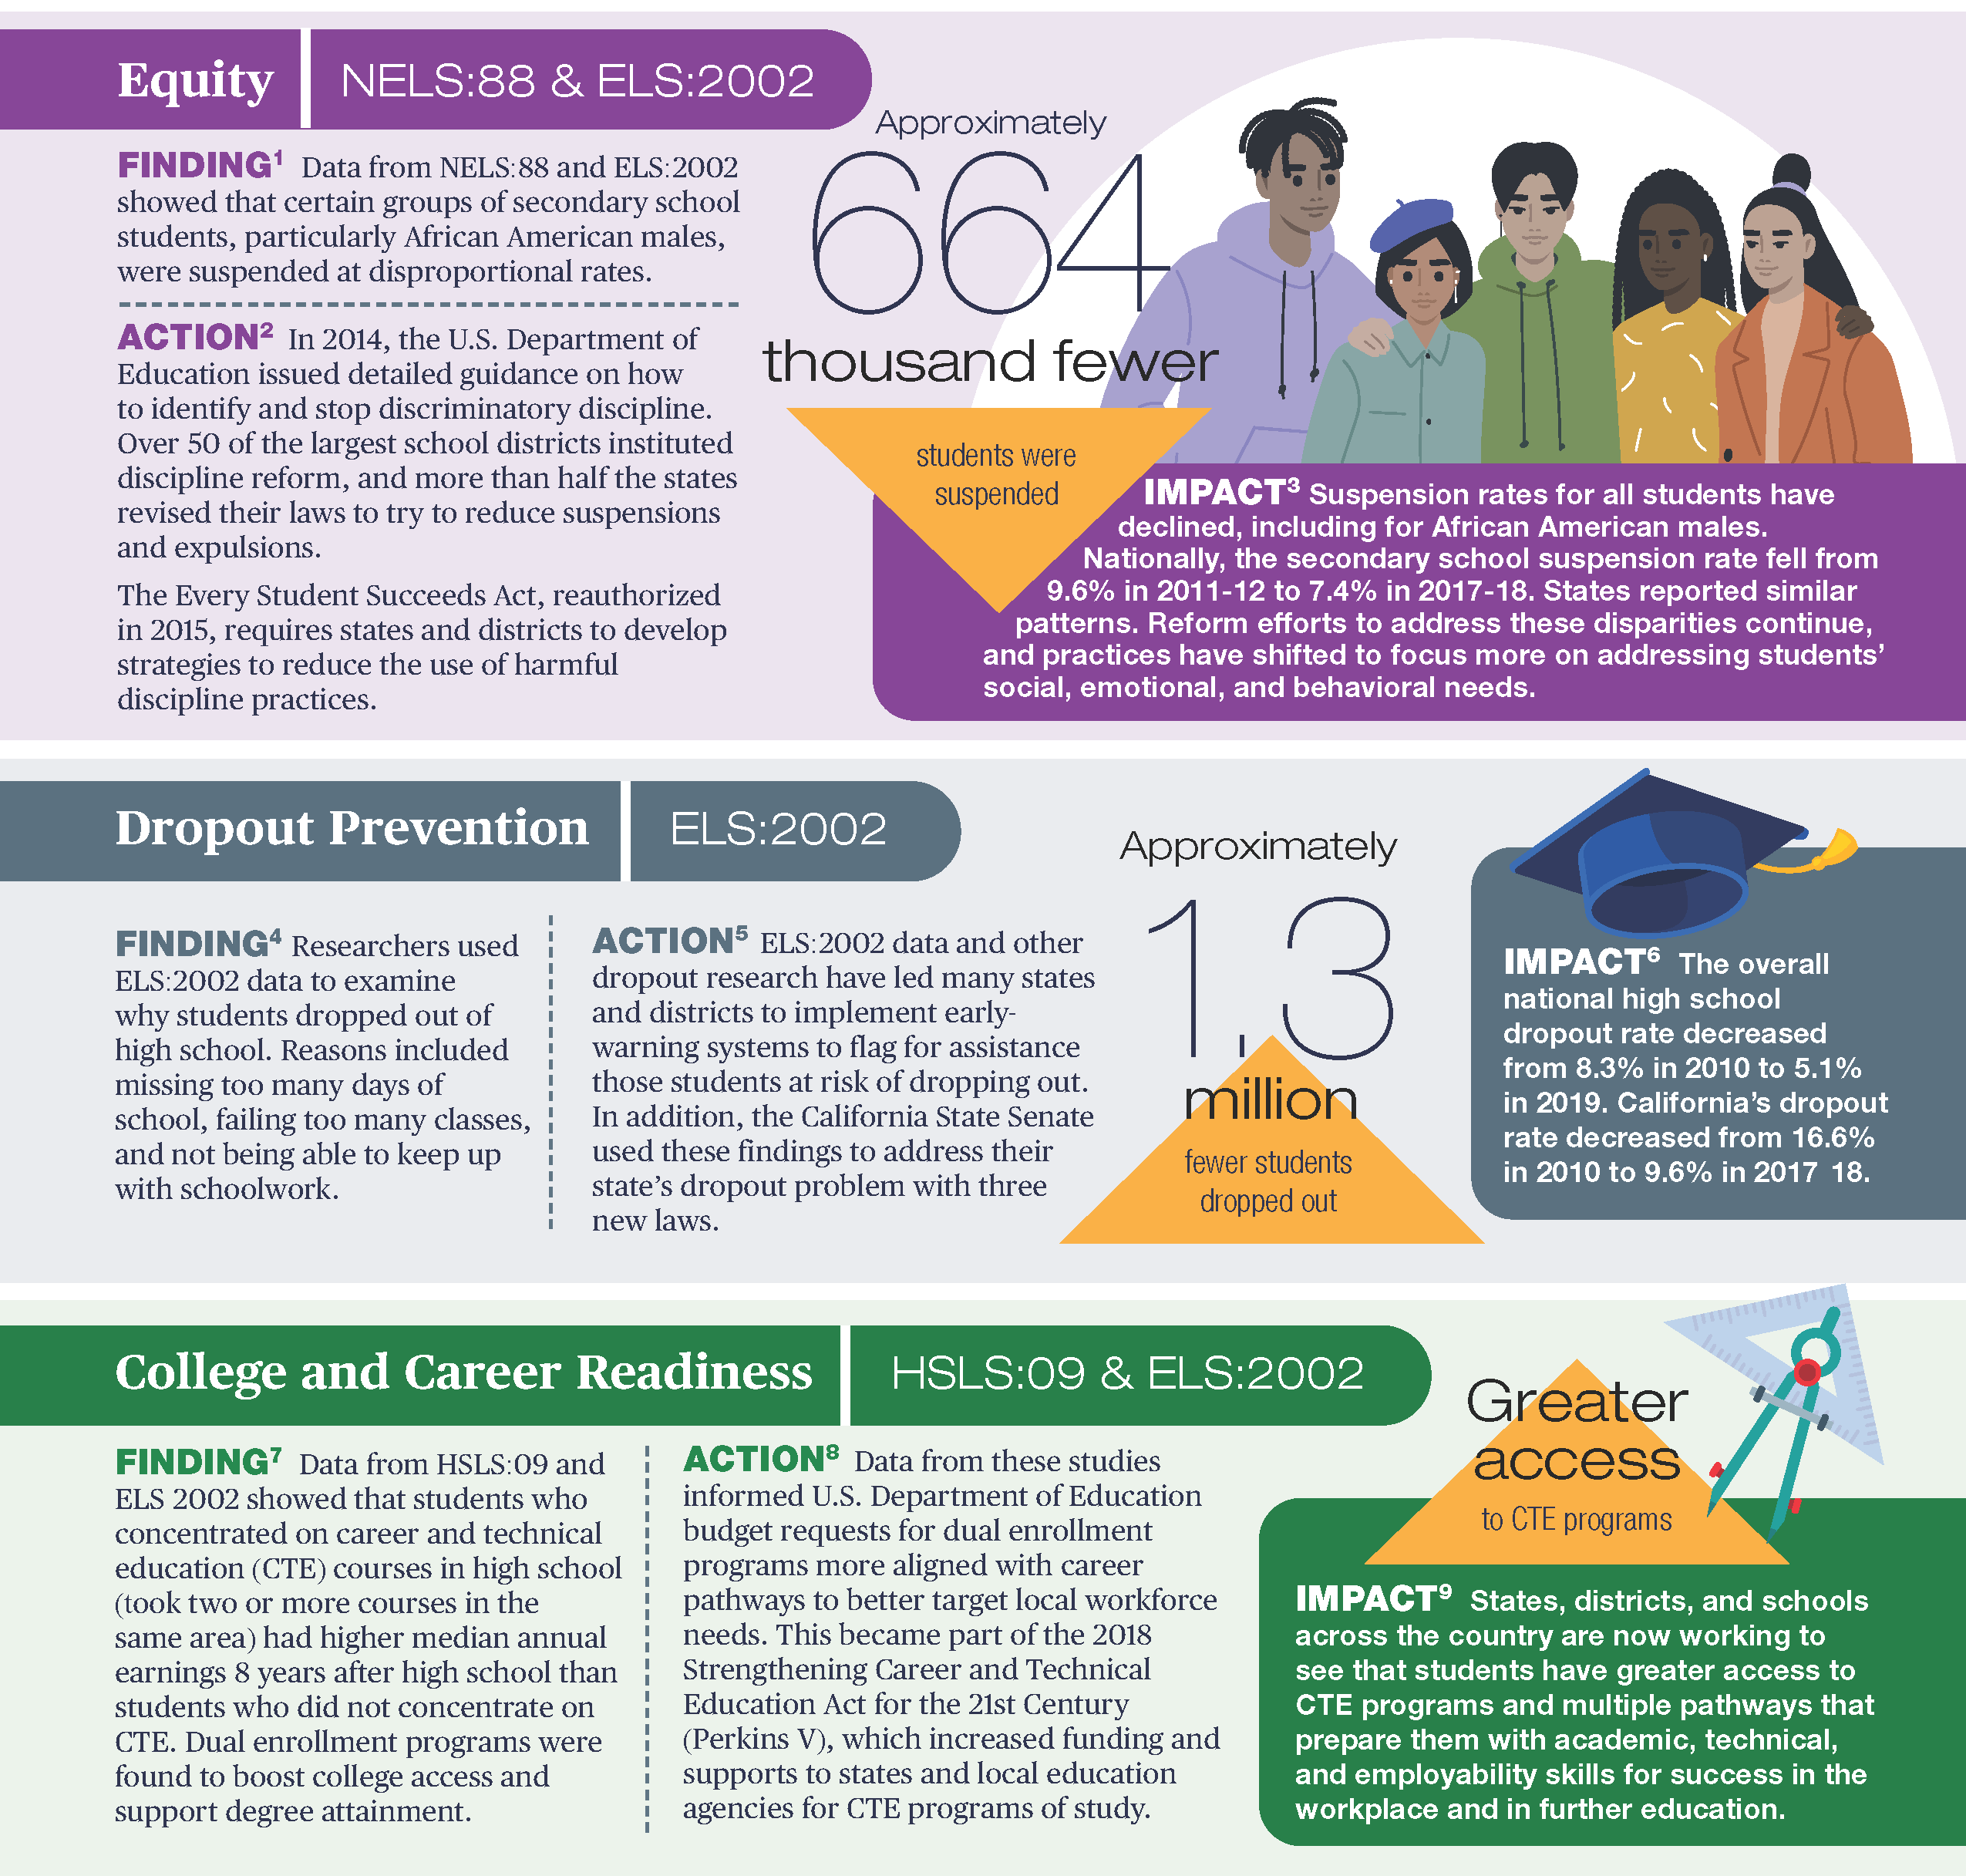
This was very close to what happened in 2012, when I was asked by analysts in ED’s Office of Planning, Evaluation, and Policy Development to produce statistical tables with data on students’ access to career and technical education (CTE) programs. Research, as reviewed in the WWC dual-enrollment report, was already demonstrating the benefits of dual enrollment for high school students. Around 2012, ED was considering a policy that would fund the expansion of dual enrollment specifically for CTE. The reason I was asked to provide tables on the topic was my understanding of two important NCES studies, the Education Longitudinal Study of 2002 (ELS:2002) and the High School Longitudinal Study of 2009 (HSLS:09). Data provided by participants in those studies were ideal for studying the question. The tables were used to evaluate policy options. Based on the results, ED, through the President, made a budget request to Congress to support dual-enrollment policies. Ultimately, dual-enrollment programs were included in the Strengthening Career and Technical Education for the 21st Century Act (Perkins V).  

The infographic below shows that this scenario—in which NCES data provided by participants like you were used to provide information about policy—has happened on different scales for different policies many times over the past few decades. The examples included are just some of those from the NCES high school longitudinal studies. NCES data have been used countless times in its 154-year history to improve education for American students. Check out the full infographic (PDF) with other examples.


Excerpt of full infographic showing findings and actions for NCES studies on Equity, Dropout Prevention, and College and Career Readiness


However, it’s not always the case that a direct line can be drawn between data from NCES studies and any one policy. Research often informs policy indirectly by educating policymakers and the public they serve on critical topics. Sometimes, as in the dual-enrollment and CTE programs research question I investigated, it can take time before policy gets enacted or a new program rolls out. This does not lessen the importance of the research, nor the vital importance of the data participants provide that underpin it.

The examples in the infographic represent experiences of actual individuals who took the time to tell NCES about themselves by participating in a study.  

If you are asked to participate in an NCES study, please consider doing so. People like you, schools like yours, and households in your town do matter—and by participating, you are helping to inform decisions and improve education across the country.


By Elise Christopher, NCES

NCES's Top Hits of 2021

As 2021—another unprecedented year—comes to a close and you reflect on your year, be sure to check out NCES’s annual list of top web hits. From reports and Condition of Education indicators to Fast Facts, APIs, blog posts, and tweets, NCES releases an array of content to help you stay informed about the latest findings and trends in education. Don’t forget to follow us on Twitter, Facebook, and LinkedIn to stay up-to-date in 2022!
 

Top five reports, by number of PDF downloads

1. Condition of Education 2020 (8,376)

2Digest of Education Statistics 2019 (4,427)

3. Status and Trends in the Education of Racial and Ethnic Groups 2018 (3,282)

4. Indicators of School Crime and Safety: 2019 (2,906)

5. Trends in High School Dropout and Completion Rates in the United States: 2019 (2,590)


Top five indicators from the Condition of Education, by number of web sessions

1. Students With Disabilities (100,074)

2. Racial/Ethnic Enrollment in Public Schools (64,556)

3. Characteristics of Public School Teachers (57,188)

4. Public High School Graduation Rates (54,504)

5. Education Expenditures by Country (50,20)


Top five Fast Facts, by number of web sessions

1. Back-to-School Statistics (162,126)

2. Tuition Costs of Colleges and Universities (128,236)

3. Dropout Rates (74,399)

4. Graduation Rates (73,855)

5. Degrees Conferred by Race and Sex (63,178)


Top five NCES/EDGE API requested categories of social and spatial context GIS data, by number of requests

1. K–12 Schools (including district offices) (4,822,590)

2. School Districts (1,616,374)

3. Social/Economic (882,984)

4. Locales (442,715)

5. Postsecondary (263,047)


Top five blog posts, by number of web sessions

1. Understanding School Lunch Eligibility in the Common Core of Data (8,242)

2. New Report Shows Increased Diversity in U.S. Schools, Disparities in Outcomes (3,463)

3. Free or Reduced Price Lunch: A Proxy for Poverty? (3,457)

4. Back to School by the Numbers: 2019–20 School Year (2,694)

5. Educational Attainment Differences by Students’ Socioeconomic Status (2,587)


Top five tweets, by number of impressions

1. CCD blog (22,557)


2. NAEP dashboard (21,551)


3. IPEDS data tools (21,323)


4. ACGR web table (19,638)


5. Kids’ Zone (19,390)


By Megan Barnett, AIR

Research Roundup: NCES Celebrates Native American Heritage Month

Looking at data by race and ethnicity can provide a better understanding of education performance and outcomes than examining statistics that describe all students. In observation of Native American Heritage Month, this blog presents NCES findings on the learning experiences of American Indian/Alaska Native (AI/AN) students throughout their education careers.

Early Childhood Education

  • In 2019, 45 percent of AI/AN 3- to 4-year-olds and 83 percent of AI/AN 5-year-olds were enrolled in school.
     

K12 Education

  • The 2019 National Indian Education Study (NIES) surveyed students, teachers, and school principals about the experiences of AI/AN students in 4th and 8th grades.
     
    • How much do AI/AN students know about their culture?
      • Most 4th-grade AI/AN students reported having at least “a little” knowledge of their AI/AN tribe or group, with 17 percent reporting knowing “nothing.” About 19 to 23 percent reported having “a lot” of cultural knowledge across school types. (For more information, see NIES 2019, p. 11.)
         
    • Where do AI/AN students learn about their culture?
      • Family members were identified as the people who taught students the most about AI/AN history, with 45 percent of 4th-grade students and 60 percent of 8th-grade students so reporting. Teachers were the second most commonly identified group of people important for educating students on AI/AN cultural topics. (For more information, see NIES 2019, p. 12.)
         
    • How do teachers contribute to AI/AN student cultural knowledge?
      • A majority of AI/AN students had teachers who integrated AI/AN culture or history into reading lessons: overall, 89 percent of 4th-grade students and 76 percent of 8th-grade students had teachers who reported using these concepts in reading lessons “at least once a year.” (For more information, see NIES 2019, p. 16.)
         
    • What are AI/AN student trends on assessments in mathematics and reading?
      • Nationally, mathematics scores for AI/AN students from 2015 to 2019 remained unchanged for 4th-graders and declined for 8th-graders. Most states saw no change. (For more information, see NIES 2019, p. 46.)
         
  • In 2019, 52 percent of AI/AN 4th-grade students had access to a computer at home. (For more information, see NIES 2019, p. 45.)
     
  • There were 505,000 AI/AN students enrolled in public schools in 1995, compared with 490,000 AI/AN students in fall 2018 (the last year of data available).
     
  • In fall 2018, less than half of AI/AN students (40 percent) attended schools where minority students comprised at least 75 percent of the student population.
     
  • There are approximately 45,000 American Indian/Alaska Native students served by approximately 180 Bureau of Indian Education (BIE) schools located on 64 reservations in 23 states.
     
  • In school year 2018–19, the adjusted cohort graduation rate (ACGR) was 74 percent for AI/AN public school students. The ACGRs for AI/AN students ranged from 51 percent in Minnesota to 94 percent in Alabama and were higher than the U.S. average in eight states (Texas, Virginia, Louisiana, Tennessee, Connecticut, New Jersey, Alabama, and Kentucky).
     
  • In 2020, 95 percent of 25- to 29-year-olds who were AI/AN had completed at least high school.


Postsecondary Education

  • In academic year 2018–19, 14 percent of bachelor’s degrees conferred to AI/AN graduates were in a STEM field.
     
  • About 41 percent of AI/AN students who began seeking a bachelor’s degree full-time at a 4-year institution in fall 2013 completed that degree at the same institution within 6 years.


By Mandy Dean, AIR

NCES's Top Hits of 2020

As we wrap up what has been an unprecedented year in many ways, we’re taking a look back at some of NCES’s most popular content from 2020. As you reflect on the past year, we hope you’ll explore our most downloaded reports, most visited indicators, Fast Facts, and blog posts, and most viewed tweets over the past year. 


Top Five Reports, by number of PDF downloads

1. Condition of Education 2020 (7,328)

2Digest of Education Statistics 2018 (4,936)

3. Status and Trends in the Education of Racial and Ethnic Groups 2018 (3,379)

4. Trends in High School Dropout and Completion Rates in the United States: 2019 (2,994)

5. First-Generation Students: College Access, Persistence, and Postbachelor’s Outcomes (2,382)


Top Five indicators from the Condition of Education, by number of web sessions

1. Students With Disabilities (82,304)

2. Public High School Graduation Rates (66,993)

3. Education Expenditures by Country (61,766)

4. English Language Learners in Public Schools (46,293)

5. Undergraduate Enrollment (46,766)


Top Five Fast Facts, by number of web sessions

1. Back to School Statistics (214,148)

2. Tuition Costs of Colleges and Universities (111,491)

3. College and University Endowments (78,735)

4. Degrees Conferred by Race and Sex (73,980)

5. Closed Schools (69,142)


Top Five Blog Posts, by number of web sessions

1. Introducing the 2020 Classification of Instructional Programs (CIP) and Its Website (7,822)

2. Back to School by the Numbers: 2019–20 School Year (4,400)

3. Free or Reduced Price Lunch: A Proxy for Poverty? (4,199)

4. Educational Attainment Differences by Students’ Socioeconomic Status (2,919)

5. The Digital Divide: Differences in Home Internet Access (2,699)


Top Five Tweets, by number of impressions

1. Teacher Appreciation Day (21,146)


2. International Education Week (18,333)


3. Trends in High School Dropout and Completion Rates in the United States: 2019 (17,383)


4. International Early Learning Study 2018 Pilot (10,870)


5. NAEP Data Training Workshop (10,782)


Be sure to check our blog site and the NCES website to stay up-to-date on new findings and trends in 2021. You can also follow NCES on Twitter, Facebook, and LinkedIn for daily updates and content.

Announcing the Condition of Education 2020 Release

NCES is pleased to present The Condition of Education 2020, an annual report mandated by the U.S. Congress that summarizes the latest data on education in the United States. This report uses data from across the center and from other sources and is designed to help policymakers and the public monitor educational progress. This year’s report includes 47 indicators on topics ranging from prekindergarten through postsecondary education, as well as labor force outcomes and international comparisons.

The data show that 50.7 million students were enrolled in public elementary and secondary schools (prekindergarten through grade 12) and approximately 5.7 million students were enrolled in private elementary and secondary schools in fall 2017, the most recent year for which data were available. In school year 2017–18, some 85 percent of public high school students graduated on time with a regular diploma. This rate was similar to the previous year’s rate. About 2.2 million, or 69 percent, of those who completed high school in 2018, enrolled in college that fall. Meanwhile, the status dropout rate, or the percentage of 16- to 24-year-olds who were not enrolled in school and did not have a high school diploma or its equivalent, was 5.3 percent in 2018.

Total undergraduate enrollment in degree-granting postsecondary institutions in 2018 stood at 16.6 million students. The average net price of college for first-time, full-time undergraduates attending 4-year institutions was $13,700 at public institutions, $27,000 at private nonprofit institutions, and $22,100 at private for-profit institutions (in constant 2018–19 dollars). In the same year, institutions awarded 1.0 million associate’s degrees, 2.0 million bachelor’s degrees, 820,000 master’s degrees, and 184,000 doctor’s degrees.

Ninety-two percent of 25- to 34-year-olds in the United States had a high school diploma or its equivalent in 2018. In comparison, the average rate for the Organization for Economic Cooperation and Development (OECD) member countries was 85 percent. Some 49 percent of these individuals in the United States had obtained a postsecondary degree, compared with the OECD average of 44 percent. Similar to previous years, annual median earnings in 2018 were higher for 25- to 34-year-olds with higher levels of education. In 2018, U.S. 25- to 34-year-olds with a bachelor’s or higher degree earned 66 percent more than those with a high school diploma or equivalent.

The Condition of Education includes an Executive Summary, an At a Glance section, a Reader’s Guide, a Glossary, and a Guide to Sources, all of which provide additional background information. Each indicator includes references to the source data tables used to produce the indicator.

As new data are released throughout the year, indicators will be updated and made available on The Condition of Education website

In addition to publishing The Condition of Education, NCES produces a wide range of other reports and datasets designed to help inform policymakers and the public about significant trends and topics in education. More information about the latest activities and releases at NCES may be found on our website or at our social media sites on TwitterFacebook, and LinkedIn.


By James L. Woodworth, NCES Commissioner