IES Blog

Institute of Education Sciences

Building Partnerships to Support Mental Health Needs in Diverse Rural Schools: The National Center for Rural School Mental Health

About 1 in 5 school-age children experience serious mental health issues yet few receive services. In rural schools, geographic isolation and limited resources make receiving services even more difficult. The IES-funded National Center for Rural School Mental Health is addressing this challenge.

The 5 year, $10 million National R&D Center is supporting partnerships with a wide variety of rural school districts in three states (Missouri, Virginia, and Montana) to develop and test ways to support the mental health needs of their students. I recently spoke with Dr. Wendy Reinke, the Center’s director, about the unique mental health needs in the rural settings where the center is working and how she and her colleagues are approaching this work.  

Tell us a little bit about the rural communities you are partnering with in Missouri, Virginia, and Montana.

Each state provides a unique geological context that we anticipate will inform the tools and interventions we are developing for wide use in rural schools. For instance, Missouri sits in the middle of the country where half of the school districts are considered rural and another third or so are considered small towns. Virginia encompasses central Appalachia which struggles with issues of under-employment, mental health, and school dropout. In the northwest, rural residents are scattered across Montana’s 56 counties, 30 of which are classified as “frontier” counties with three or fewer persons per square mile.  The tools and interventions we develop will need to be feasible and effective across these very different contexts.

What are the most common mental health challenges being faced in the different rural communities you are partnering with?

Part of the work of the Rural Mental Health Center will be learning more about the types of  mental health challenges faced by rural communities. From my current work in Missouri’s rural schools, common areas of concern include youth with depression, anxiety, conduct problems, substance abuse, and suicidality.  Identifying youth early can help to prevent or reduce the burden of these problems.  Accordingly, we plan to not only offer interventions for youth facing mental health challenges but work with schools to prevent and identify early, youth who would benefit from supports.

The work you have planned for the center builds on prior IES-funded work. Tell us more about how this work provides a foundation for launching the work of the center.

A cornerstone of the Center is the use of an assessment tool that will allow schools to gather data to determine their needs for school-level prevention, group-based interventions, and individualized interventions.  This tool was developed in partnership with six school districts (five of which are rural) and University of Missouri researchers.  Through the IES partnership grant we were able to validate the measure and gather stakeholder input to improve the tool and the overall intervention model.  These data collected using this tool will be linked to evidence-based interventions, several of which have been developed and evaluated through IES funding.  It is very exciting to have the opportunity to pull all of these projects together to support our rural schools.

Much of your earlier research has been done in urban school districts. How did you become interested in research with rural schools? What would you recommend to other researchers interested in doing research with rural schools?

I grew up and attended school in a rural coal-mining town in Pennsylvania. When I moved to Missouri, I had access and opportunity in working alongside rural school districts.  One recommendation, which I think goes for research in any schools, is to operate as a partner with them. For instance, the six school districts we worked with formed a Coalition, and we include the Coalition as co-authors on any publication or presentation that comes from this work.  Further, we present with partners at conferences and report back findings to the community.  I think an open and collaborative relationship gains trust, allowing for additional opportunities to conduct research alongside our school partners. Additionally, our ideas for studies are nearly always driven by the needs expressed by our schools based on the pressing challenges they report to us.

The Center also has a policy focus with work that will be led by your Montana partners. Tell us more about this aspect of the Center’s work and the types of policy issues the Center will address.

We will be working with rural school district partners across the three states to identify important issues facing rural schools.  Dr. Ryan Tolleson-Knee from the University of Montana will be leading this initiative.  At the Center kick-off meeting held in June, a subgroup of rural school partners interested in policy was formed.  The plan is for this subgroup to develop a toolkit that can be readily used by public school personnel and state and national policymakers to improve outcomes for youth.  One topic of interest is how might rural school districts partner with one another (similar to the Coalition described earlier) to maximize and share resources across the communities.  Over the next five years, the toolkit will expand and connect to issues faced by our rural schools.

Written by Emily Doolittle, NCER Team Lead for Social Behavioral Research

New Report on School Choice in the United States

Across the United States, parents have an increasing number of educational options for their children, including traditional public schools, public charter schools, private schools, and homeschooling. Although the majority of students attend traditional public schools, the numbers of students attending public charter schools or homeschool programs are growing, according to recently released data.

Using survey data from the National Center for Education Statistics (NCES), the newly released School Choice in the United States: 2019 report provides information on student enrollment; individual, family, and school characteristics of students enrolled in different educational settings; achievement; school crime and safety; and differences in the school choice options that parents select and their satisfaction with their children’s school.


School Enrollment Trends

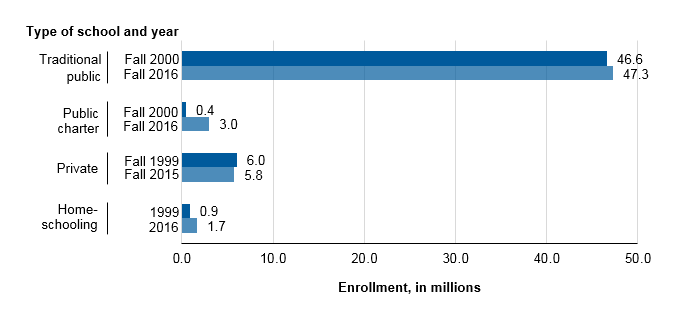
Over time, the numbers of students enrolled in traditional public schools, public charter schools, and homeschool programs have increased (see figure 1). Enrollment in traditional public schools was 1 percent higher in fall 2016 (47.3 million) than in fall 2000 (46.6 million). 

Public charter schools grew at a much more rapid rate in that time, with enrollment increasing by more than 500 percent, from 0.4 million in fall 2000 to 3.0 million in fall 2016. Enrollment in homeschool programs has also grown, nearly doubling from 1999 (0.9 million) to 2016 (1.7 million). However, private school enrollment fell 4 percent between fall 1999 and fall 2015.


Figure 1. Enrollment in traditional public schools, public charter schools, private schools, and homeschooling
SOURCE: U.S. Department of Education, National Center for Education Statistics, Common Core of Data (CCD), “Public Elementary/Secondary School Universe Survey,” 2000–01 and 2016–17; Private School Universe Survey (PSS), 1999–2000 and 2015–16; Parent Survey and Parent and Family Involvement in Education Survey of the National Household Education Surveys Program (Parent-NHES:1999 and PFI-NHES:2016).


Student and School Characteristics

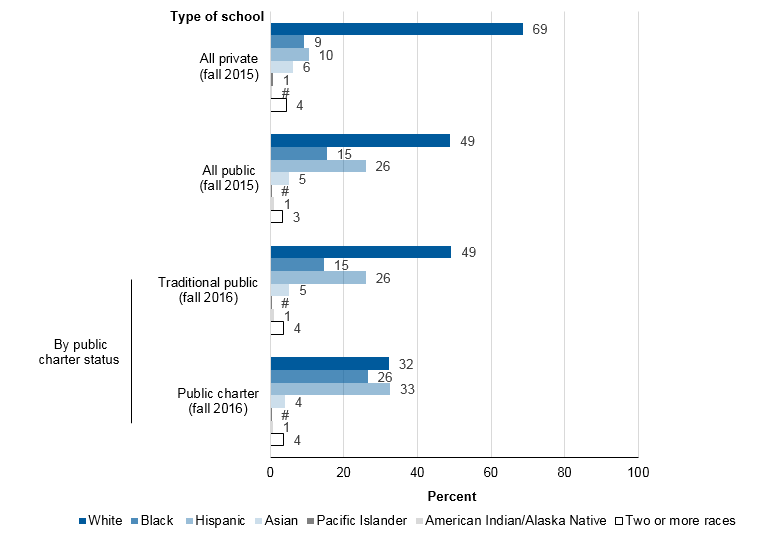
This report also explores enrollment in different school options across a range of characteristics, including students’ racial/ethnic background (see figure 2), family composition, household poverty status, parent education and employment, and more.

For example, public schools enrolled higher percentages of Black and Hispanic students than did private schools in fall 2015. Within the public school sector, public charter schools enrolled higher percentages of Black and Hispanic students and lower percentages of White and Asian/Pacific Islander students than did traditional public schools in fall 2016. And, the percentages of students who were homeschooled in 2016 were higher for White and Hispanic students than for Black and Asian students.


Figure 2. Percentage distribution of elementary and secondary enrollment, by school type and student race/ethnicity: 2015 and 2016
 

#Rounds to zero.
NOTE: Figure excludes homeschooled children. Race categories exclude persons of Hispanic ethnicity. Although rounded numbers are displayed, the figures are based on unrounded data. Detail may not sum to totals because of rounding.
SOURCE: U.S. Department of Education, National Center for Education Statistics, Private School Universe Survey (PSS), 2015–16; and Common Core of Data (CCD), "Public Elementary/Secondary School Universe Survey," 2016–17.


In 2016, about 58 percent of public charter school students were enrolled in schools in cities, compared with 29 percent of traditional public school students; traditional public school students were more likely than public charter school students to attend schools in suburban areas, towns, and rural areas.

In 2015, about 43 percent of private school students were enrolled in schools in cities, and 40 percent were enrolled in schools in suburban areas. However, homeschooling in 2016 was more prevalent among students in rural areas than among those in cities and suburban areas.


Parental Choice

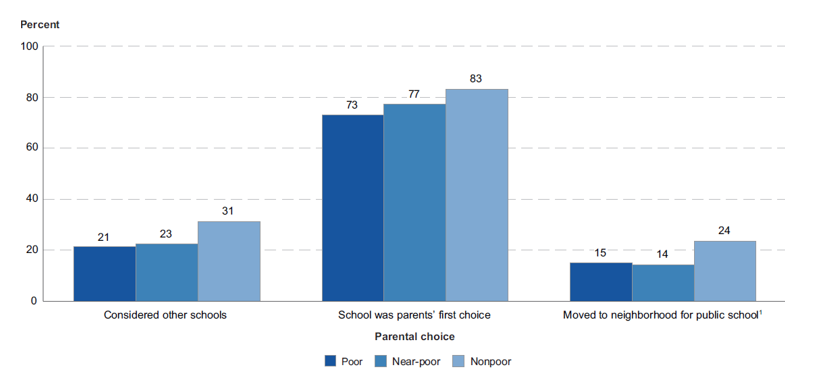
In 2016, parents whose children were enrolled in public or private schools were asked about their decisions regarding school choice. Twenty-eight percent of students had parents who reported that they had considered schools other than the one in which their children were currently enrolled, and 80 percent had parents who reported that their children’s current school was their first choice. Among public school students, 20 percent had parents who reported they moved to their current neighborhood so their children could attend their current public school.

Each of these percentages was higher for students from nonpoor households than for students from near-poor or poor households (see figure 3). For example, 31 percent of students in nonpoor households had parents who reported that they considered other schools for their children, compared with 23 percent of students in near-poor households and 21 percent of students in poor households.


Figure 3. Percentage of students enrolled in grades 1 through 12 whose parents considered other schools, reported current school was their first choice, or moved to their current neighborhood for the public school, by family poverty status: 2016
1 Includes public school students only. Private school students are excluded.
NOTE: Data exclude homeschooled children.
SOURCE: U.S. Department of Education, National Center for Education Statistics, Parent and Family Involvement Survey of the National Household Education Surveys Program (PFI-NCES:2016).


Browse the full School Choice in the United States: 2019 report to learn more about these and other trends related to school choice and student enrollment.


By Amy Rathbun and Ke Wang, AIR

Are You What You Eat? Understanding the Links Between Diet, Behavior, and Achievement During Middle School

We’ve all heard the phrase “you are what you eat,” but what exactly does it mean for student learning and achievement in middle school? In 2018, researchers from the University of Alabama at Birmingham received an IES Exploration grant to investigate the direction and nature of the relationships between middle school students’ diet, behavior, and academic achievement. These relationships have not been fully studied in the United States, nor have longitudinal designs been used (most existing studies are cross-sectional) making it hard to determine the precise nature of the links between what adolescents eat and potential implications for learning and achievement.  

Because children in the United States consume about half of their nutrients at school, the need to identify school nutrition policies and practices that benefit student behavior and achievement is great, especially given newly published findings that motivated this IES research and that have attracted lots of media interest in recent days (see this story from CNN and this press release). The Alabama researchers found that specific nutrients (high sodium, low potassium) predicted depression over a year later in a sample of 84 urban, primarily African American adolescents (mean age 13 years). In the IES study, these researchers are expanding their work with a larger and more diverse sample of 300 students. In the first year of this 4-year study, the researchers recruited about two thirds of their sample (186 students across 10 schools) who completed the first of three week-long assessments as 6th graders and who will complete assessments again in the 7th and 8th grades. During each week-long assessment period, each student reports on their own diet and academic functioning, and on their own and their peers’ emotions and behavior. They also complete objective tests of attention and memory. The researchers observe each child’s actual food and beverage consumption at school and behavior during one academic class period. They also collect school records of grades, test scores, attendance, discipline incidents, and information about each school’s nutrition policies and practices. Parents and teachers also report on student diet, behavior, and academic functioning.

This school year the researchers are recruiting the rest of their sample. If their findings suggest a role for school practices and dietary factors in student behavior and achievement, they can guide future efforts to develop school-based programs targeting students’ diet that could be easily implemented under typical school conditions.

Written by Emily Doolittle, NCER Team Lead for Social Behavioral Research

Computational Thinking: The New Code for Success

Computational thinking is a critical set of skills that provides learners with the ability to solve complex problems with data. The importance of computational thinking has led to numerous initiatives to infuse computer science into all levels of schooling. High-quality research, however, has not been able to keep up with the demand to integrate these skills into K–12 curricula. IES recently funded projects under the Education Research Grants, the Small Business Innovation Research, and the Low-Cost, Short-Duration Evaluation of Education Interventions programs that will explore computational thinking and improve the teaching and learning of computer science.


  • Greg Chung and his team at the University of California, Los Angeles will explore young children’s computational thinking processes in grades 1 and 3. The team will examine students’ thought processes as they engage in visual programming activities using The Foos by codeSpark.
  • The team from codeSpark will develop and test a mobile game app for grade schoolers to learn coding skills through creative expression. The game supports teachers to integrate computational thinking and coding concepts across different lesson plans in English Language Arts and Social Studies.
  • VidCode will develop and test a Teacher Dashboard to complement their website where students learn to code. The dashboard will guide teachers in using data to improve their instruction.
  • Lane Educational Service District will work with researchers from the University of Oregon to evaluate the impact of the district’s Coder-in-Residence program on student learning and engagement.

IES is eager to support more research focused on exploring, developing, evaluating, and assessing computational thinking and computer science interventions inclusive of all learners. IES program officer, Christina Chhin, will speak at the Illinois Statewide K-12 Computer Science Education Summit on September 20, 2019 to provide information about IES research funding opportunities and resources focusing on computer science education.

Education at a Glance 2019: Putting U.S. Data in a Global Context

International comparisons provide reference points for researchers and policy analysts to understand trends and patterns in national education data and are important as U.S. students compete in an increasingly global economy.

Education at a Glance, an annual publication produced by the Organisation for Economic Co-operation and Development (OECD), provides data on the structure, finances, and progress of education systems in 36 OECD countries, including the United States, as well as a number of OECD partner countries. The report also includes state-level information on key benchmarks to inform state and local policies on global competitiveness. 

The recently released 2019 edition of the report shows that the United States is above the international average on some measures, such as participation in and funding of higher education, but lags behind in others, such as participation in early childhood education programs.


Distribution of 25- to 34-Year-Olds With a College Education, by Level of Education

The percentage of U.S. 25- to 34-year-olds with an associate’s or bachelor’s degree increased by 8 percentage points between 2008 and 2018, reaching 49 percent, compared with the OECD average of 44 percent. However, the attainment rates varied widely across the United States in 2017, from 32 percent for those living in Louisiana and West Virginia to 58 percent for those living in Massachusetts and 73 percent for those living in the District of Columbia.

The percentage of U.S. students completing a bachelor’s degree within 4 years was 38 percent in 2018, about the same as the average among OECD countries with available data (39 percent); however, after an additional 2 years, the U.S. graduation rate (69 percent) was slightly above the OECD average of 67 percent (achieved after 3 years). While a higher percentage of U.S. young adults had completed a bachelor’s degree compared with young adults in other OECD countries, a lower percentage had completed a master’s or doctoral degree. Eleven percent of 25- to 34-year-olds in the United States had completed a master’s or doctoral degree, compared with an average of 15 percent across OECD countries.


Higher Education Spending

U.S. spending on higher education is also relatively high compared with the OECD average, in both absolute and relative terms. The United States spent $30,165 per higher education student in 2017, the second-highest amount after Luxembourg and nearly double the OECD average ($15,556). Also, U.S. spending on higher education as a percentage of GDP (2.5 percent) was substantially higher than the OECD average (1.5 percent). These total expenditures include amounts received from governments, students, and all other sources. 


Early Childhood Education

Contrasting with enrollment patterns at the higher education level, the level of participation in early childhood education programs in the United States is below the OECD average and falling further behind. Between 2005 and 2017, average enrollment rates for 3- to 5-year-olds across OECD countries increased from 76 to 86 percent. In contrast, the rate in the United States remained stable at 66 percent during this time period. Among U.S. states, the 2017 enrollment rates for 3- to 5-year-olds ranged from less than 50 percent in Idaho, North Dakota, and Wyoming to more than 70 percent in Connecticut, the District of Columbia, and New Jersey.

Going deeper into the data, on average, 88 percent of 4-year-olds in OECD countries were enrolled in education programs in 2017, compared with 66 percent in the United States. The enrollment rate for 3-year-olds in the United States was 42 percent, compared with the OECD average of 77 percent.


Gender Gaps in Employment

Education at a Glance also looks at employment and other outcomes from education. The report found that the 2017 gender gap in employment rates was lower for those who had completed higher levels of education. This pattern holds in the United States, where the gender gap in the employment rate was particularly high among 25- to 34-year-olds who had not completed high school. For this age group, the employment rate was 73 percent for men and 41 percent for women, a difference of 32 percentage points, compared with the average difference of 28 percentage points across OECD countries. The gender gap in the employment rate was 14 percentage points among U.S. adults with only a high school education and 7 percentage points among those who had completed college.

In 2017, the gender differences in average earnings were also wider in the United States than in the OECD averages. These gender gaps in earnings between male and female full-time workers existed across all levels of education. In the United States, college-educated 25- to 64-year-old women earned 71 percent of what their male peers earned. This gender gap was wider than for all other OECD countries except for Chile, the Czech Republic, Hungary, Israel, Italy, Mexico, Poland, and the Slovak Republic.

This is just a sample of the information that can be found in Education at a Glance 2019. You can also find information on the working conditions of teachers, including time spent in the classroom and salary data; student/teacher ratios; college tuitions and loans; and education finance and per student expenditures. Education at a Glance also contains data on the international United Nations Sustainable Development Goals related to education.

Browse the full report to see how the United States compares with other countries on these important education-related topics.


Percentage of 25- to 34-year-olds with a college education, by level of education: 2018

1 Year of reference differs from 2018 (see NOTE).                                                                                                                                       

NOTE: Reporting of some countries is not consistent with international categories. Please refer to Education at a Glance Database, http://stats.oecd.org. for details. Comparisons follow International Standard Classification of Education (ISCED) 2011 education levels: “Associate’s or similar degrees” refers to ISCED 2011 level 5, “Bachelor’s or equivalent” refers to level 6, “Master’s or equivalent” refers to level 7, and “Doctoral or equivalent” refers to level 8. Countries are ranked in descending order of the total percentage of tertiary-educated 25- to 34-year-olds. See Annex 3 for additional notes (https://doi.org/10.1787/f8d7880d-en).

SOURCE: Organisation for Economic Co-operation and Development (2019), Education at a Glance Database, http://stats.oecd.org


By Thomas Snyder