IES Blog

Institute of Education Sciences

Announcing ED/IES SBIR’s 2018 Awards: Funding the Next Generation of Education Technology

In recent years, thousands of schools around the country have used technologies developed through the Small Business Innovation Research program at the U.S. Department of Education’s Institute of Education Sciences (ED/IES SBIR). The program emphasizes a rapid research and development (R&D) process, with rigorous research informing iterative development and evaluating the promise of products for improving the intended outcomes. ED/IES SBIR also focuses on the commercialization after development is complete so that products can reach schools and be sustained over time.


This month, IES announced 21 new awards for 2018. Of these, 15 are Phase I projects to develop and test a prototype, and six are Phase II projects to fully develop and evaluate an education technology product for students, teachers, or administrators to use in classrooms and schools. A playlist of videos from the Phase II projects is available below. 

Many of the new projects continue trends that have emerged across the portfolio in recent years, including creating learning games and dashboards that present data to inform learning and instruction in core subjects like reading and math. Several other awards are for projects that promote learning in new areas, such as computer science and Career and Technical Education.

Trend #1: Learning Games

Games are increasingly being used to engage students in learning by presenting content in new ways. For the eighth straight year, many new ED/IES SBIR awardees will be developing game-based learning products.

  • Phase II awardee Electric Funstuff and Phase I awardee Schell Games are developing virtual reality (VR) games to immerse students in history in 360-degree environments, and Phase I awardee Gigantic Mechanic is developing a role-playing game on civic discourse facilitated by tablet-based computers.
  • With Phase I funding, Fablevision and Sirius Thinking are creating interventions that employ game mechanics to improve reading.
  • Several project teams are embedding storylines within learning games, including Phase II awardee MidSchoolMath for algebra, and Phase I awardees Codespark for computer science and Immersed Games for ecosystems science.
  • The 3C Institute is creating a game-based assessment of early grade science learning.

Trend #2: Dashboards for Students, Teachers and Administrators

Modern technologies provide the opportunity to organize and present data in real-time to students, teachers, and administrators to inform learning and decision-making. Several new awards are developing data dashboards.

  • Phase II awardees are fully developing dashboards across several areas. LiveSchool will generate reports on students’ behavior across classes with a recommendation engine for administrators and teachers to address challenges, StoryWorld will provide teachers of English Learners insights into students’ language acquisition, and Simbulus and Myriad Sensors will present real-time information to enrich classroom discussions on math and science topics.
  • Phase I projects by Appendis and Graspable are creating adaptive learning technologies which include teacher dashboards to present results on student performance to guide instruction. VidCode is creating a dashboard for teachers to monitor student progress in learning coding. Education Modified is developing a dashboard to provide special education teachers guidance on student IEPs, or individual educational plans.

New Areas of Focus

Along with continuing to support projects in the areas above, a series of Phase I 2018 awards are focusing on areas new to ED/IES SBIR.  VidCode, CodeSpark, and Zyante are focusing on computer science learning and Core Learning is seeking to build capacity in Career and Technical Education (CTE). Language Learning Partners is developing an automated avatar tutor to support English Learners through conversation. And in special education, Attainment Company is developing an app for supporting student writing.

Stay tuned for updates on Twitter and Facebook as IES continues to support innovative forms of technology.

Written by Edward Metz, Program Manager, ED/IES SBIR

Explore Data on Mental Health Services in K–12 Public Schools for Mental Health Awareness Month

It’s important for schools to help ensure students are safe and healthy, both physically and mentally, so that learning can occur. In addition to implementing security measures on school campuses, there has been a growing focus on whether schools provide mental health services. In school year 2015–16, some 71 percent of public schools reported having diagnostic assessments for mental health disorders available to students, and 64 percent of schools reported having treatment available. [i]

These data come from the School Survey on Crime and Safety (SSOCS). The 2015–16 SSOCS questionnaire added new questions asking principals to report whether diagnostic assessment and treatment services for mental health were available to students under the official responsibilities of a licensed mental health professional.[ii] Diagnostic assessments are used to identify whether a student has one or more medical and/or mental health diagnoses. Treatment is a clinical service, such as psychotherapy, medication, or counseling, which is intended to lessen or eliminate the symptoms of a disorder.

The prevalence of mental health services varied by school characteristics. In both middle and high schools, diagnostic assessment services were more common than treatment services: 74 percent of middle schools and 79 percent of high schools reported diagnostic assessments were available, compared with 66 percent of middle schools and 69 percent of high schools reporting treatment services were available. Compared to primary schools, a higher percentage of high schools reported that both types of mental health services were available.


Figure 1. Percentage of public schools reporting the availability of mental health services under the official responsibilities of a licensed mental health professional, by type of mental health service and school enrollment size: School year 2015–16

1Mental health disorders were defined for respondents as, collectively, all diagnosable mental disorders or health conditions that are characterized by alterations in thinking, mood, or behavior (or some combination thereof) associated with distress and/or impaired functioning.
NOTE: Mental health services are provided by several different types of mental health professionals, each of which have their own training and areas of expertise. The types of professionals who may provide mental health services include psychiatrists, psychologists, psychiatric/mental health nurse practitioners, psychiatric/mental health nurses, clinical social workers, and professional counselors. Responses were provided by the principal or the person most knowledgeable about school crime and policies to provide a safe environment.
SOURCE: U.S. Department of Education, National Center for Education Statistics, 2015–16 School Survey on Crime and Safety (SSOCS), 2016. See table 40.


The percentage of schools with 1,000 or more students that reported having diagnostic assessment services available (80 percent) was higher than the percentages of schools with fewer than 300 students (69 percent), 300–499 students (68 percent), and 500–999 students (71 percent).

The questionnaire also asked principals to report to what extent certain factors limited the school’s efforts to provide mental health services to students. The most common limiting factors reported by schools were inadequate funding (75 percent) and lack of parental support (71 percent).


Figure 2. Percentage of public schools reporting that their efforts to provide mental health services to students were limited in a major or minor way due to specified non-school-level factors: School year 2015–16

1Mental health disorders were defined for respondents as, collectively, all diagnosable mental disorders or health conditions that are characterized by alterations in thinking, mood, or behavior (or some combination thereof) associated with distress and/or impaired functioning.
2Mental health services are provided by several different types of mental health professionals, each of which have their own training and areas of expertise. The types of professionals who may provide mental health services include psychiatrists, psychologists, psychiatric/mental health nurse practitioners, psychiatric/mental health nurses, clinical social workers, and professional counselors. 
3Examples of legal issues provided to respondents were malpractice and insufficient supervision.
NOTE: Respondents were asked to rate the level of limitation in their school’s efforts to provide mental health services to students for each factor. Survey response options included “limits in major way,” “limits in minor way,” or “does not limit." Responses were provided by the principal or the person most knowledgeable about school crime and policies to provide a safe environment.
SOURCE: U.S. Department of Education, National Center for Education Statistics, 2015–16 School Survey on Crime and Safety (SSOCS), 2016. See table 39.


You can find more information on school crime and safety in NCES publications, including Crime, Violence, Discipline, and Safety in U.S. Public Schools: Findings From the School Survey on Crime and Safety: 2015–16 and the 2017 Indicators of School Crime and Safety.


By Rachel Hansen, NCES and Melissa Diliberti, AIR


[i] Includes services available at school by a mental health professional employed by the school or district; services available at school by a mental health professional other than a school or district employee, funded by the school or district; and services available outside of school by a mental health professional other than a school or district employee, funded by the school or district.

[ii] The 2015–16 questionnaire provided formal definitions for many terms, including at school, diagnostic assessment, mental health disorders, mental health professionals, and treatment.


Announcing the Condition of Education 2018 Release

We are pleased to present The Condition of Education 2018, a congressionally mandated annual report summarizing the latest data on education in the United States. This report is designed to help policymakers and the public monitor educational progress. This year’s report includes 47 indicators on topics ranging from prekindergarten through postsecondary education, as well as labor force outcomes and international comparisons. 

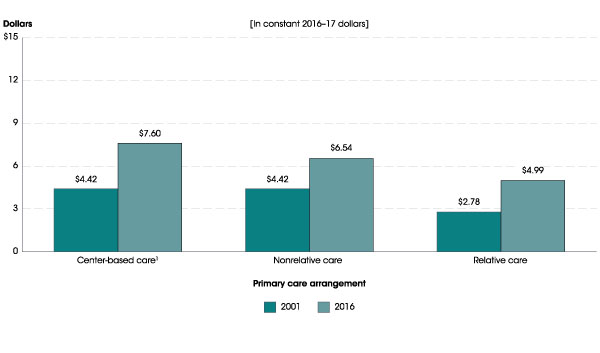
In addition to the regularly updated annual indicators, this year’s spotlight indicators highlight new findings from recent NCES surveys. The first spotlight indicator examines the choices and costs that families face as they select early childhood care arrangements. Drawing on data from the NCES National Household Education Survey, the indicator finds that early childhood care expenses were higher in 2016 than in 2001. For example, families’ average hourly out-of-pocket expenses for center-based care were 72 percent higher in 2016 ($7.60) than in 2001 ($4.42), in constant 2016–17 dollars. The indicator also finds that in 2016, some 57 percent of children under the age of 6 had parents who reported there were good choices for child care where they lived. Among children whose parents reported difficulty finding child care in 2016, some 32 percent cited cost as the primary reason. The complete indicator, Early Childhood Care Arrangements: Choices and Costs, contains more information about how these findings varied by family income, race/ethnicity, locale (urban, suburban, town, or rural), and children’s age.


Average hourly out-of-pocket child care expense for children under 6 years old and not yet in kindergarten whose families paid for child care, by primary type of child care arrangement: 2001 and 2016
1 Center-based arrangements include day care centers, Head Start programs, preschools, prekindergartens, and childhood programs.
NOTE: Estimates include only those children whose families paid at least part of the cost out of pocket for their child to receive nonparental care at least weekly.
SOURCE: U.S. Department of Education, National Center for Education Statistics, Early Childhood Program Participation Survey of the National Household Education Surveys Program (ECPP-NHES: 2001 and 2016). See Digest of Education Statistics 2017, table 202.30c.


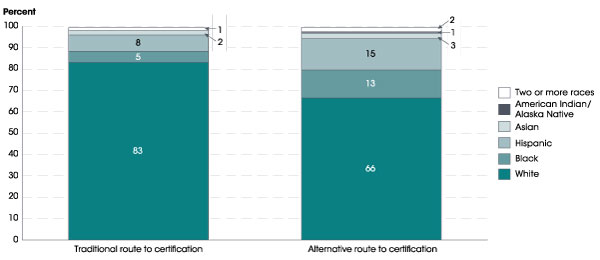
The second spotlight describes the characteristics of teachers who entered the teaching profession through an alternative route to certification program. Compared to those who entered through a traditional route, higher percentages of alternative route teachers in 2015–16 were Black (13 vs. 5 percent), Hispanic (15 vs. 8 percent), of Two or more races (2 vs. 1 percent), and male (32 vs. 22 percent), and lower percentages were White (66 vs. 83 percent). Overall, 18 percent of public school teachers in 2015–16 had entered teaching through an alternative route to certification program. The percentages were higher among those who taught career or technical education (37 percent), natural sciences (28 percent), foreign languages (26 percent), English as a second language (24 percent), math and computer science (22 percent), and special education (20 percent). The analysis also examines how the prevalence of alternative route teachers varies between charter schools and traditional public schools, between high and low poverty schools, and between schools that enroll high or low percentages of racial/ethnic minority students. For more findings from this analysis of data from the National Teacher and Principal Survey, see the complete indicator, Characteristics of Public School Teachers Who Completed Alternative Route to Certification Programs.


Percentage distribution of public elementary and secondary school teachers, by route to certification and race/ethnicity: 2015–16
NOTE: Teachers were asked whether they entered teaching through an alternative route to certification program, which is a program that was designed to expedite the transition of nonteachers to a teaching career (for example, a state, district, or university alternative route to certification program). Detail may not sum to totals because of rounding. Race categories exclude persons of Hispanic ethnicity. Data for American Indian/Alaska Native teachers who entered teaching through a traditional route and Pacific Islander teachers who entered teaching through traditional and alternative routes round to zero and are not displayed.
SOURCE: U.S. Department of Education, National Center for Education Statistics, National Teacher and Principal Survey (NTPS), “Public School Teacher Data File,” 2015–16. See Digest of Education Statistics 2017, table 209.24.


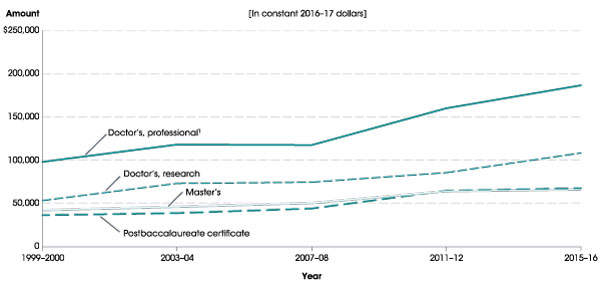
The third spotlight presents data on average student loan balances for students completing graduate degrees. Using data from the National Postsecondary Student Aid Study, this indicator examines how average student loan balances changed between 1999–2000 and 2015–16, and how those trends varied by degree type. Among graduate school completers who had student loans for undergraduate or graduate studies, average student loan balances increased for all degree types (in constant 2016–17 dollars). For example, average student loan balances for students who completed research doctorate degrees, such as a Ph.D., doubled during this time period, from $53,500 to $108,400 (an increase of 103 percent). Average student loan balances increased by 90 percent for those who completed professional doctorate degrees, such as medical doctorates and law degrees (from $98,200 to $186,600). The complete indicator, Trends in Student Loan Debt for Graduate School Completers, also describes how average student loan balances varied among specific degree programs, such as medical doctorates, law degrees, and master’s degrees in business administration.


Average cumulative student loan balance for graduate school completers, by degree type: Selected years, 1999–2000 through 2015–16
1 Includes chiropractic, dentistry, law, medicine, optometry, pharmacy, podiatry, and veterinary medicine. 
NOTE: Data refer to students who completed graduate degrees in the academic years indicated. Includes student loans for undergraduate and graduate studies. Average excludes students with no student loans.
SOURCE: U.S. Department of Education, National Center for Education Statistics, 1999–2000, 2003–04, 2007–08, 2011–12, and 2015–16 National Postsecondary Student Aid Study (NPSAS:2000, NPSAS:04, NPSAS:08, NPSAS:12, and NPSAS:16). See Digest of Education Statistics 2017, table 332.45.


The Condition includes an At a Glance section, which allows readers to quickly make comparisons within and across indicators, and a Highlights section, which captures key findings from each indicator. The report contains a Reader’s Guide, a Glossary, and a Guide to Sources that provide additional background information. Each indicator provides links to the source data tables used to produce the analyses.

As new data are released throughout the year, indicators will be updated and made available on The Condition of Education website. In addition, NCES produces a wide range of reports and datasets designed to help inform policymakers and the public. For more information on our latest activities and releases, please visit our website or follow us on Twitter, Facebook, and LinkedIn.

By James L. Woodworth, NCES Commissioner 

New Data from the 2015–16 National Postsecondary Student Aid Study

Seventy-two percent of all undergraduate students received some type of financial aid, including loans, in the 2015–16 academic year. For those who received aid, the average was about $12,300 per student. If you want to explore more statistics on student financial aid, you can! NCES has released new data from the 2015–16 National Postsecondary Student Aid Study (NPSAS:16). Data users have the ability to generate estimates and perform their own analyses using our online data analysis tools available in DataLab. Users can select the tool that best meets their needs, including PowerStats, QuickStats, and TrendStats.

NPSAS is the most comprehensive nationally representative study of how students and their families finance postsecondary education in the United States. The NPSAS:16 sample consisted of approximately 113,000 undergraduate and graduate students attending 1,800 postsecondary institutions in the 50 states, the District of Columbia, and Puerto Rico.

In addition to information on financial aid, the study collects data on many other topics, such as student demographics, total and net prices of attendance, education-related debt, major field of study, employment while enrolled, and participation in remedial education.

To enhance the data and address emerging policy issues, NCES has also included new and expanded items on these topics in NPSAS:16:

  • Financial literacy, including questions to measure understanding of key financial concepts such as inflation, interest rates, and investment, plus questions on the possible consequences for failing to repay federal student loans;
  • Alternative repayment options for federal loans, including awareness of and plans to use income-driven repayment and public service loan forgiveness;
  • Student veterans and military students, including an oversample of student veterans, measures of federal veterans’ education benefits derived from administrative sources, indicators of whether institutions offer programs targeted to veterans and military students, and new measures of state and institution aid specifically for student veterans; and
  • Study abroad, including the location and duration of time spent abroad.

A First Look report, which was released in January, highlighted key findings from the study. For more information on how the study was planned and conducted, including extensive details on sampling, data collection, response rates, weighting, and other topics, we encourage you to see the 2015–16 National Postsecondary Student Aid Study (NPSAS:16) Data File Documentation report.

By Tracy Hunt-White

Principals as Instructional Leaders and Managers—Not an “Either-Or”

Recently Morgaen Donaldson (University of Connecticut) and Madeline Mavrogordato (Michigan State), Peter Youngs (University of Virginia), and Shaun Dougherty (University of Connecticut) presented early results from their IES-funded study on principal evaluation policies at the AERA national conference. We asked the team to share their preliminary findings.

What is the purpose of your study?

There is widespread agreement among researchers, policymakers, and practitioners that principals play a critical role in providing high-quality education to students. The role of principals may grow even larger under the 2015 Every Student Succeeds Act, which grants districts and states more flexibility regarding how to promote effective principal leadership. However, we know remarkably little about what school districts can do to improve principals’ leadership practices.

Given the importance of principals and the relative dearth of research on how to improve their leadership, we have been studying the extent to which principal evaluation systems focus on learning-centered leadership, one promising conception of leadership, in 22 districts in Connecticut, Michigan, and Tennessee. We are examining associations between the types of leadership emphasized in principal evaluation policies, the leadership practices that principals implement in their schools, and student performance.  

What is the major focus of principal evaluation policies?

To date, through document analysis we have found that district principal evaluation policies heavily emphasize instructional leadership, which focuses on teaching and learning issues, and de-emphasize managerial leadership, which concentrates on administrative tasks such as budgeting and overseeing school facilities. Similarly, in interviews and surveys superintendents and principals report that their evaluation systems focus on instructional leadership. For example, one Michigan superintendent said, “the emphasis on education right now [is] to take the principals away from being a manager to being an instructional leader.”

How are administrators actually interpreting the policies?

Further investigation revealed a more nuanced relationship between written district policies and administrators’ interpretations of these policies, however. We found no relationship between written policies’ emphasis on instructional leadership and principals’ survey responses regarding whether their district focused on this type of leadership. Principals’ perceptions of their district’s focus on managerial leadership was related to the emphasis of this type of leadership in the policies, however. Thus, when districts placed a higher emphasis on managerial leadership in their written evaluation policies, principals reported that they perceived a stronger emphasis on this type of leadership.

Moreover, we found that holding constant the written policy’s emphasis on managerial leadership, there was an inverse relationship between the written policies’ emphasis on instructional leadership and the principals’ perceived policy emphasis on managerial leadership. Thus, the greater the written emphasis on instruction, the less principals perceived that their policy emphasized management.

In addition, interview data reveal that although superintendents state that they emphasize instructional leadership they in fact weigh managerial leadership quite heavily. In superintendents’ framing, a principal’s competence in managerial leadership enabled him or her to practice instructional leadership. Superintendents asserted that when principals addressed managerial concerns, they could progress to exercising instructional leadership. If principals were unable to address managerial issues, superintendents reported that they moved rapidly to intervene and potentially remove principals.

What are the next steps for your IES research project?

These preliminary findings add to a growing body of evidence suggesting a complex interplay between managerial and instructional leadership. They also reflect a longstanding tension between the two dominant conceptions of principal leadership among practitioners.  We plan to further examine the multifaceted relationship between instructional and managerial leadership as we continue our work on this project. We are currently surveying teachers about the types of leadership principals exercise in their schools and conducting a second round of interviews with superintendents to understand their perspectives in greater depth. In the next stage of the project, we will examine associations between the types of leadership emphasized in principal evaluation policies, the leadership practices that principals implement in their schools, and student performance in grades 3-8. 

Katina Stapleton, NCER Program Officer, oversees the project described in this blog post, and provided a framework for their responses.