IES Blog

Institute of Education Sciences

Measuring Student Safety: New Data on Bullying Rates at School

NCES is committed to providing reliable and up-to-date national-level estimates of bullying. As such, a new set of web tables focusing on bullying victimization at school was just released.  

These tables use data from the School Crime Supplement to the National Crime Victimization Survey, which collects data on bullying by asking a nationally representative sample of students ages 12–18 who were enrolled in grades 6–12 in public and private schools if they had been bullied at school. This blog post highlights data from these newly released web tables.

Some 19 percent of students reported being bullied during the 2021–22 school year. More specifically, bullying was reported by 17 percent of males and 22 percent of females and by 26 percent of middle school students and 16 percent of high school students. Moreover, among students who reported being bullied, 14 percent of males and 28 percent of females reported being bullied online or by text.

Students were also asked about the recurrence and perpetrators of bullying and about the effects bullying has on them. During the 2021–22 school year, 12 percent of students reported that they were bullied repeatedly or expected the bullying to be repeated and that the bullying was perpetrated by someone who was physically or socially more powerful than them and who was not a sibling or dating partner. When these students were asked about the effects this bullying had on them,

  • 38 percent reported negative feelings about themselves;
  • 27 percent reported negative effects on their schoolwork;
  • 24 percent reported negative effects on their relationships with family and friends; and
  • 19 percent reported negative effects on their physical health.

Explore the web tables for more data on how bullying victimization varies by student characteristics (e.g., sex, race/ethnicity, grade, household income) and school characteristics (e.g., region, locale, enrollment size, poverty level) and how rates of bullying victimization vary by crime-related variables such as the presence of gangs, guns, drugs, alcohol, and hate-related graffiti at school; selected school security measures; student criminal victimization; personal fear of attack or harm; avoidance behaviors; fighting; and the carrying of weapons.

Find additional information on this topic in the Condition of Education indicator Bullying at School and Electronic Bullying. Plus, explore more School Crime and Safety data and browse the Report on Indicators of School Crime and Safety: 2022.

NCES Releases Indicators on Rural Education

NCES is excited to announce the release of five Education Across America indicators that focus on education in rural areas. These indicators—which summarize data patterns and provide analyses of the rural education experience—focus on the following topics:

For example, Rural Students’ Access to the Internet highlights the percentage of students in rural areas who had no internet access or only dial-up access to the Internet in 2019 (7 percent or 663,000 students). This percentage was higher than the percentages for students in towns (6 percent), cities (5 percent), and suburban areas (3 percent). In addition, compared with students in other locales, it was less common for students in rural areas to have fixed broadband internet access at home and more common for them to have only mobile broadband internet access at home. 


Figure 1. Percentage of 5- to 17-year-old students with no access to the Internet or only dial-up access to the Internet at home, by home locale: 2019

[click to enlarge image]

Horizontal bar chart showing the percentage of 5- to 17-year-old students with no access to the Internet or only dial-up access to the Internet at home in 2019, by home locale

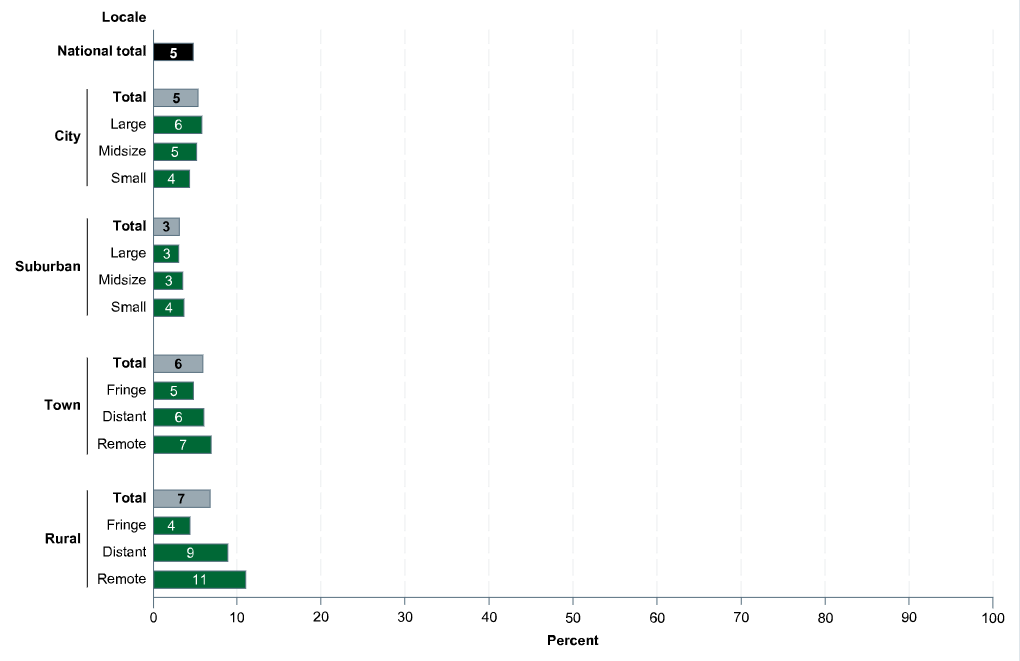
NOTE: "No access to the Internet or only dial-up access to the Internet" includes households where no member accesses the Internet at home as well as households where members access the Internet only with a dial-up service. Data are based on sample surveys of the entire population residing within the United States. This figure includes only students living in households, because respondents living in group quarters (e.g., shelters, healthcare facilities, or correctional facilities) were not asked about internet access. Excludes children under age 15 who are not related to the householder by birth, marriage, or adoption (e.g., foster children) because their family and individual income is not known and a poverty status cannot be determined for them. Although rounded numbers are displayed, figures are based on unrounded data.

SOURCE: U.S. Department of Commerce, Census Bureau, American Community Survey (ACS), 2019, Restricted-Use Data File. See Digest of Education Statistics 2020, table 218.70.


These indicators are currently available through the Condition of Education Indicator System. To access them, select Explore by Indicator Topics and then select the Education Across America icon.


Image of the Condition of Education's Explore by Indicator Topics page highlighting the Education Across America section


Stay tuned for the release of additional indicators in early 2023. Then, in spring/summer 2023, check back to explore our highlights reports—which will explore key findings across multiple indicators grouped together by a theme—and our spotlight on distant and remote rural areas and the unique challenges they face.

Explore the Education Across America resource hub—including locale definitions, locale-focused resources, and reference tables with locale-based data—and watch this video to learn more about the hub. Be sure to follow NCES on TwitterFacebookLinkedIn, and YouTube and subscribe to the NCES News Flash to stay up-to-date on Education Across America releases and resources.


By Xiaolei Wang and Jodi Vallaster, NCES

Introducing NCES’s New Locale-Focused Resource Hub: Education Across America

NCES is excited to announce the release of a resource hub that focuses on data by geographic locale—Education Across America: Cities, Suburbs, Towns, and Rural Areas—using a three-phased approach. Released today, Phase I of this new resource hub involves the consolidation of locale-focused data across NCES surveys and programs and makes updates to the latest data available. The result of this work is 140 tables with data disaggregated by all four locales (i.e., cities, suburbs, towns, and rural areas). These tables cover a wide range of topics grouped into broad themes: family characteristics, educational experiences, school resources and staffing, and educational outcomes. Phases II and III will focus on rural areas and involve summarizing findings in text.

To make these data more relevant and useful, NCES adopted a pyramid approach1 to attend to various user segments with tiered products (exhibit 1). Source tables containing data disaggregated by locale form the base of the pyramid. These tables, which contain the most detailed statistical information about education in each locale, target data-savvy users such as researchers.


Exhibit 1. Tiered Approach to Products in Education Across America Resource Hub

Infographic showing pyramid with five levels of NCES products; from bottom to top: source tables, indicators, thematic summaries, briefs, and digital media


The next level is indicators. These indicators, comprising text and figures, will supply in-depth analyses that focus on rural areas. In order to make our data relevant and useful, literature review and focused groups were conducted to identify the topics that are important to education in rural areas. The target audience for these indicators is those who are looking for comprehensive discussions on specific topics in rural education.

The middle level of the pyramid is thematic summaries. These summaries synthesize findings across multiple indicators grouped together by a theme. In addition to thematic summaries, we will create a spotlight that focuses on distant and remote rural areas because these areas are confronted with unique challenges and are of particular policy interest. These products target education leaders in higher education and at the state and local levels.

The next level of the pyramid is briefs, which includes an executive summary on key findings about rural education and an at-a-glance resource that highlights important statistics about schools and students in rural areas. These products are designed as quick reads and target nontechnical audiences—such as state and local education leaders, associations, and policymakers—as well as individuals with an interest in education—such as educators and parents.

The final level of the pyramid is digital media, which includes blogs and social media posts that highlight key findings and resources available in the Education Across America resource hub. These products are designed to connect the media, parents, and educators with information on educational experiences across America.

Phase II involves the development of 5 to 10 indicators focused on the experience of schools and students in rural areas and is expected to be completed in June 2022. Phase III—which is expected to be completed in October 2022—consists of the development of the remaining indicators as well as the products in the thematic summaries and briefs tiers.

Check out our locale-focused research hub, Education Across America, today. Be sure to check back over the summer and fall to explore the hub as we release new products focusing on education in rural areas.


By Xiaolei Wang, Ph.D., NCES; and Jodi Vallaster, Ed.D., NCES


[1] Schwabish, J. (2019). “Use the Pyramid Philosophy’ to Better Communicate Your Research.” Urban Institute. https://www.urban.org/urban-wire/use-pyramid-philosophy-better-communicate-your-research; Scanlan, C. (2003). “Writing from the Top Down: Pros and Cons of the Inverted Pyramid.” Poynter. https://www.poynter.org/reporting-editing/2003/writing-from-the-top-down-pros-and-cons-of-the-inverted-pyramid/