IES Blog

Institute of Education Sciences

NCES Provides New Data Table on School District Structures

The National Center for Education Statistics (NCES) has released a new data table (Excel) on local education agencies (LEAs)1 that serve multiple counties. This new data table can help researchers understand how many LEAs exist and break down enrollment by LEA and county.

Variation in School District Structures

The organizing structures for LEAs vary across the United States. In many areas of the country, LEAs share boundaries with counties or cities. In other areas, there are multiple LEAs within a single county. LEAs also can span multiple counties.

The organizing structures for LEAs or school districts reflect the policies and practices of local and state governments and historical trends across many states. For example, there was a large consolidation in LEAs in the last century as the number of regular school districts decreased from 117,100 in 1939–40 to fewer than 14,900 in 2000–01. In contrast to these declines, the numbers of charter schools and charter school agencies operating outside of regular school district and county frameworks have increased over the past 2 decades.2

Impact of Structural Differences in School Districts

These structural differences can make it challenging for researchers to estimate student enrollment by county and drill down into other data. This is important because the structure of LEAs and their relationships to county boundaries can impact the capability of researchers and policy analysts to align existing county and district data in ways that could better inform education policies.3 In addition, these structures can affect the designs of new surveys and research activities. For example, research or data collections on career and technical education (CTE) activities at the district level would need to accommodate structural differences in where CTE activities are typically provided—that is, in general education districts (as is the case in most states) or through separate CTE-focused LEAs.

New Data Table on LEAs Serving Multiple Counties

NCES has taken valuable steps to increase the amount of information available to the research community about funding crossing district lines. In fiscal year 2018, a data item was added to the School District Finance Survey (F-33) that includes current expenditures made by regional education service agencies (RESAs) and other specialized service agencies (e.g., supervisory unions) that benefit the reporting LEA.4

Our recently released data table (Excel)—which shows the prevalence and enrollment size of LEAs that serve multiple counties—will facilitate a better understanding of how RESA expenditures are included in the district-level total current expenditures and current expenditure per pupil amounts displayed in the annual Revenues and Expenditures for Public Elementary and Secondary School Districts finance tables.

Understanding the New Data Table

The data table uses data from the Common Core of Data (CCD) and Demographic and Geographic Estimates (EDGE) to provide county and student enrollment information on each LEA in the United States (i.e., in the 50 states and the District of Columbia) with a separate row for each county in which the agency has a school presence. The table includes all LEA types, such as regular school districts, independent charter school districts, supervisory union administrative centers, service agencies, state agencies, federal agencies, specialized public school districts, and other types of agencies.

LEA presence within a county is determined by whether it had at least one operating school in the county. School presence within a county is determined by whether there is at least one operating school in the county identified in the CCD school-level membership file. For example, an LEA that is coterminous with a county has one record (row) in the listing. A charter school LEA that serves a region of a state and has a presence in five counties has five records. LEA administrative units, which do not operate schools, are listed in the county in which the agency is located.

In the 2021–22_LEA_List tab, column D shows the “multicnty” (i.e., multicounty) variable. LEAs are assigned one of the following codes:

1 = School district (LEA) is in single county and has reported enrollment.

2 = School district (LEA) is in more than one county and has reported enrollment.

8 = School district (LEA) reports no schools and no enrollment, and the county reflects county location of the administrative unit. 

9 = School district (LEA) reports schools but no enrollment, and the county reflects county location of the schools.

In the Values tab, the “Distribution of local education agencies, by enrollment and school status: 2021–22” table shows the frequency of each of the codes (1, 2, 8, and 9) (i.e., the number of records that are marked with each of the codes in the 2021–22_LEA_List tab):

  • 17,073 LEAs had schools in only one county.
  • 1,962 LEAs had schools located in more than one county and reported enrollment for these schools.
  • 1,110 LEAs had no schools of their own and were assigned to a single county based on the location of the LEA address. (Typically, supervisory union administrative centers are examples of these LEAs.)
  • 416 LEAs had schools located in one county but did not report enrollment for these schools.


By Tom Snyder, AIR


[1] Find the official definition of an LEA.

[4] The annual School District Finance Survey (F-33) is collected by NCES from state education agencies and the District of Columbia. See Documentation for the NCES Common Core of Data School District Finance Survey (F-33) for more information.

Releasing CCD Nonfiscal Data

The Common Core of Data (CCD) contains basic information on public elementary and secondary schools, local education agencies (LEAs), and state education agencies (SEAs) in the United States. The CCD collects fiscal and nonfiscal data about all public schools, public school districts, and state education agencies in the United States. Both IPEDS and CCD provide a sampling frame to many survey collections, including many conducted by NCES and the Department of Education. This blog post, one in a series of posts about CCD nonfiscal data, focuses on CCD’s two major releases and their corresponding components. For information on how to access and use CCD data, read the blog post Accessing the Common Core of Data (CCD).
 

Data Releases

CCD nonfiscal data are published in two releases every school year—as preliminary files and as provisional data files—within the CCD Data File tool. Understanding the differences between the two releases is important to understand how CCD nonfiscal data are released.

  • The preliminary files contain basic information about schools and districts, such as name, address, phone number, status, and NCES ID number. Many schools and districts utilize information from the directory file, such as the NCES ID, to apply for grants or other opportunities for their schools. Therefore, it is important that these files are released first, even if the data are still preliminary. 
     
  • The provisional data files are the full release of the CCD nonfiscal data. These data files provide school-, district-, and state-level data on topics like enrollment, staffing, and free or reduced-price lunch. These files are much more detailed and include data that are broken down by characteristics such as grade, race/ethnicity, and gender—as well as by combinations of these characteristics. These files are not updated unless there is a significant change to the data.

Each file release includes a version that indicates the type of release. The first preliminary files have “0a” in the file names, and revised preliminary files include “0b,” “0c,” and so on. The first provisional files have “1a,” in the file names, and revised provisional files include “1b,” “1c,” and so on. Note, however, that releasing revised files is rare.
 

Components of a Release

It is important to utilize the various components that accompany each release to find additional information that is specific to the file and can help you better understand the data. In addition, there are other resources available that provide more ways to access and understand the data.
 

Documentation Components

Every data file will have documentation files that provide information about the data. These include the following:

  • release notes—basic information about the data release, including details about any changes to the files, such as a change in a variable’s description or a variable that was added to the file; summary tables that include national totals and tables with selected frequencies are also included.
     
  • state data notes—information on data anomalies that are discovered during NCES’s collaboration with the states; broken down by state and by file type, these notes describe things like changes to how data were collected by the state.
     
  • companion files—included in each data file component, these files include a list of all the variables in the data file—including a brief description—and frequency tables; you should start with the companion files to better understand what variables are in each data file.


Resources and Tools

Along with the release of the CCD nonfiscal data files, additional resources are also updated to improve access to the data.

  • Summary Tables: Released with the provisional data files, Summary Tables provide a national-level look at the data. These tables show the operational status of schools and districts by type as well as the number of schools, students, and teachers by state.
     
  • Locators and ElSi: There are two primary tools that can be used to access CCD data: the Locators (School Locator and District Locator) and the Elementary/Secondary Information System (ElSi). These tools are updated as the data files are released. The Locators are updated with each release, while ElSi is updated with the release of the provisional data files. Learn more about these tools.
     
  • Online Documentation: The online documentation provides some general information about CCD. This information is not year specific, but it provides a detailed explanation about how the data are collected, processed, and reviewed.
  • Reference Library: The reference library includes detailed documentation on various components of the CCD files that applies to multiple years, levels, and components of the data collection. The library includes crosswalks, documentation describing changes to the collection, and guidance for utilizing the data files, such as how to aggregate free or reduced-price lunch data.

Be sure to follow NCES on TwitterFacebookLinkedIn, and YouTube and subscribe to the NCES News Flash to stay up-to-date on future CCD releases and resources.


By Patrick Keaton, NCES

Changes in Pupil/Teacher Ratios in 2020: Impacts of the COVID-19 Pandemic

The COVID-19 pandemic has brought enormous challenges to the education system, including a historic decline in enrollment in fall 2020—the largest since during World War II. Due to the relatively small decrease in the number of teachers, there was a significant drop in the pupil/teacher ratio.  

The National Center for Education Statistics (NCES) releases key statistics, including school staffing data, compiled from state administrative records through the Common Core of Data (CCD). In 2019, about 48 percent of public school staff were teachers (3.2 million) and 13 percent were instructional aides (0.9 million). NCES’s new School Pulse Panel survey found that in January 2022, about 61 percent of public schools with at least one vacancy reported that the pandemic increased the number of teacher and staff vacancies, and 57 percent of schools with at least one vacancy found that the pandemic forced them to use teachers outside their normal duty areas.

Pupil/teacher ratios provide a measure of the quantity of instructional resources available to students by comparing the number of students with the total full-time equivalent (FTE) of all teachers, including special education teachers. The public and private elementary and secondary average class size is larger than the pupil/teacher ratio since it normally does not factor into team teaching, specialty teachers, or special education classes. Between fall 2019 and fall 2020, enrollment in public elementary and secondary schools1 decreased by 2.7 percent.2 This decrease was larger than the 0.2 percent (6,700)3 decrease in the number of public school teachers. Since fall 2020, public school enrollment decreased by a larger amount than did the number of teachers. Thus, the pupil/teacher ratio declined in school year 2020–21 by a relatively large 0.5 pupils per teacher, from 15.9 to 15.4 pupils per teacher (figure 1). This is the largest 1-year decrease in more than 4 decades. In comparison, the pupil/teacher ratio for private schools was 11.4 in 2019–20 (the latest year of actual data available). It is worth noting that pupil/teacher ratios vary across schools with different characteristics (table 208.10).

Viewed over a longer term, the pupil/teacher ratio in public schools in 2019–20 (15.9) was only slightly lower than in 2010–11 (16.0), so nearly all the change during the 2010–11 to 2020–21 period occurred in the last year. The pupil/teacher ratio for private schools decreased from 12.5 in 2010–11 to 11.4 in 2019–20.


Figure 1. Pupil/teacher ratio in public and private elementary and secondary schools: 2010–11 to 2020–21

Line graph showing pupil/teacher ratio in public and private elementary and secondary schools from 2010–11 to 2020–21

NOTE: Data in this figure represent the 50 states and the District of Columbia. Data for teachers are expressed in full-time equivalents (FTE). Counts of private school enrollment include prekindergarten through grade 12 in schools offering kindergarten or higher grades. Counts of private school teachers exclude teachers who teach only prekindergarten students. Counts of public school teachers and enrollment include prekindergarten through grade 12. The pupil/teacher ratio includes teachers for students with disabilities and other special teachers, while these teachers are generally excluded from class size calculations. Ratios for public schools reflect totals reported by states and differ from totals reported for schools or school districts.  The school year 2020–21 pupil/teacher ratio shown in this figure includes only states which reported both membership and FTE teacher counts for SY 2020–21.

SOURCE: U.S. Department of Education, National Center for Education Statistics, Digest of Education Statistics 2021, table 208.20; Common Core of Data, table 2.


The declines in pupil/teacher ratios in public schools were not consistent across states between 2019–20 and 2020–21 (figure 2). The relatively large enrollment decreases in many states—along with the smaller decreases or even increases in the number of teachers in fall 2020—led to decreases in the pupil/teacher ratios for most states. Three states (Nevada, Florida, and Ohio) reported increases in their pupil/teacher ratios, and the rest of the states reporting data had decreases in their pupil/teacher ratios. The states with the largest decreases in their pupil/teacher ratios were Indiana (-1.3 pupils per teacher), Arizona (-1.1 pupils per teacher), Kansas (-0.9 pupils per teacher), and Kentucky (-0.9 pupils per teacher).4


Figure 2. Change in pupil/teacher ratios in public elementary and secondary schools, by state: 2019–20 to 2020–21

Map of United States showing increases and decreases in pupil/teacher ratios in public elementary and secondary schools from 2019–20 to 2020–21

NOTE: Data for Illinois and Utah are not available.

SOURCE: U.S. Department of Education, National Center for Education Statistics, Common Core of Data (CCD), “State Nonfiscal Public Elementary/Secondary Education Survey,” 2019–20 v.1a, table 2, and 2020–21 v.1a, table 2.


By Tom Snyder, AIR


[1] Counts of public school teachers and enrollment include prekindergarten through grade 12.

[2] Enrollment data are for fall of the school year while pupil/teacher ratios are based on school years.

[3] Includes imputed teacher FTE data for Illinois and Utah.

[4] Although Oregon had a 2 pupil per teacher decrease based on the Summary Table 2 for 2019–20 and 2020–21, Oregon did not submit prekindergarten data for 2020–21, so the ratios were not comparable.

NCES's Top Hits of 2021

As 2021—another unprecedented year—comes to a close and you reflect on your year, be sure to check out NCES’s annual list of top web hits. From reports and Condition of Education indicators to Fast Facts, APIs, blog posts, and tweets, NCES releases an array of content to help you stay informed about the latest findings and trends in education. Don’t forget to follow us on Twitter, Facebook, and LinkedIn to stay up-to-date in 2022!
 

Top five reports, by number of PDF downloads

1. Condition of Education 2020 (8,376)

2Digest of Education Statistics 2019 (4,427)

3. Status and Trends in the Education of Racial and Ethnic Groups 2018 (3,282)

4. Indicators of School Crime and Safety: 2019 (2,906)

5. Trends in High School Dropout and Completion Rates in the United States: 2019 (2,590)


Top five indicators from the Condition of Education, by number of web sessions

1. Students With Disabilities (100,074)

2. Racial/Ethnic Enrollment in Public Schools (64,556)

3. Characteristics of Public School Teachers (57,188)

4. Public High School Graduation Rates (54,504)

5. Education Expenditures by Country (50,20)


Top five Fast Facts, by number of web sessions

1. Back-to-School Statistics (162,126)

2. Tuition Costs of Colleges and Universities (128,236)

3. Dropout Rates (74,399)

4. Graduation Rates (73,855)

5. Degrees Conferred by Race and Sex (63,178)


Top five NCES/EDGE API requested categories of social and spatial context GIS data, by number of requests

1. K–12 Schools (including district offices) (4,822,590)

2. School Districts (1,616,374)

3. Social/Economic (882,984)

4. Locales (442,715)

5. Postsecondary (263,047)


Top five blog posts, by number of web sessions

1. Understanding School Lunch Eligibility in the Common Core of Data (8,242)

2. New Report Shows Increased Diversity in U.S. Schools, Disparities in Outcomes (3,463)

3. Free or Reduced Price Lunch: A Proxy for Poverty? (3,457)

4. Back to School by the Numbers: 2019–20 School Year (2,694)

5. Educational Attainment Differences by Students’ Socioeconomic Status (2,587)


Top five tweets, by number of impressions

1. CCD blog (22,557)


2. NAEP dashboard (21,551)


3. IPEDS data tools (21,323)


4. ACGR web table (19,638)


5. Kids’ Zone (19,390)


By Megan Barnett, AIR

New Data Reveal Public School Enrollment Decreased 3 Percent in 2020–21 School Year

NCES recently released revised Common Core of Data (CCD) Preliminary Files, which are the product of the school year (SY) 2020–21 CCD data collection. CCD, the Department of Education’s primary database on public elementary and secondary education in the United States, provides comprehensive annual data on enrollment, school finances, and student graduation rates.

Here are a few key takeaways from the newly released data files:

Public school enrollment in SY 2020–21 was lower than it was in SY 2019–20.

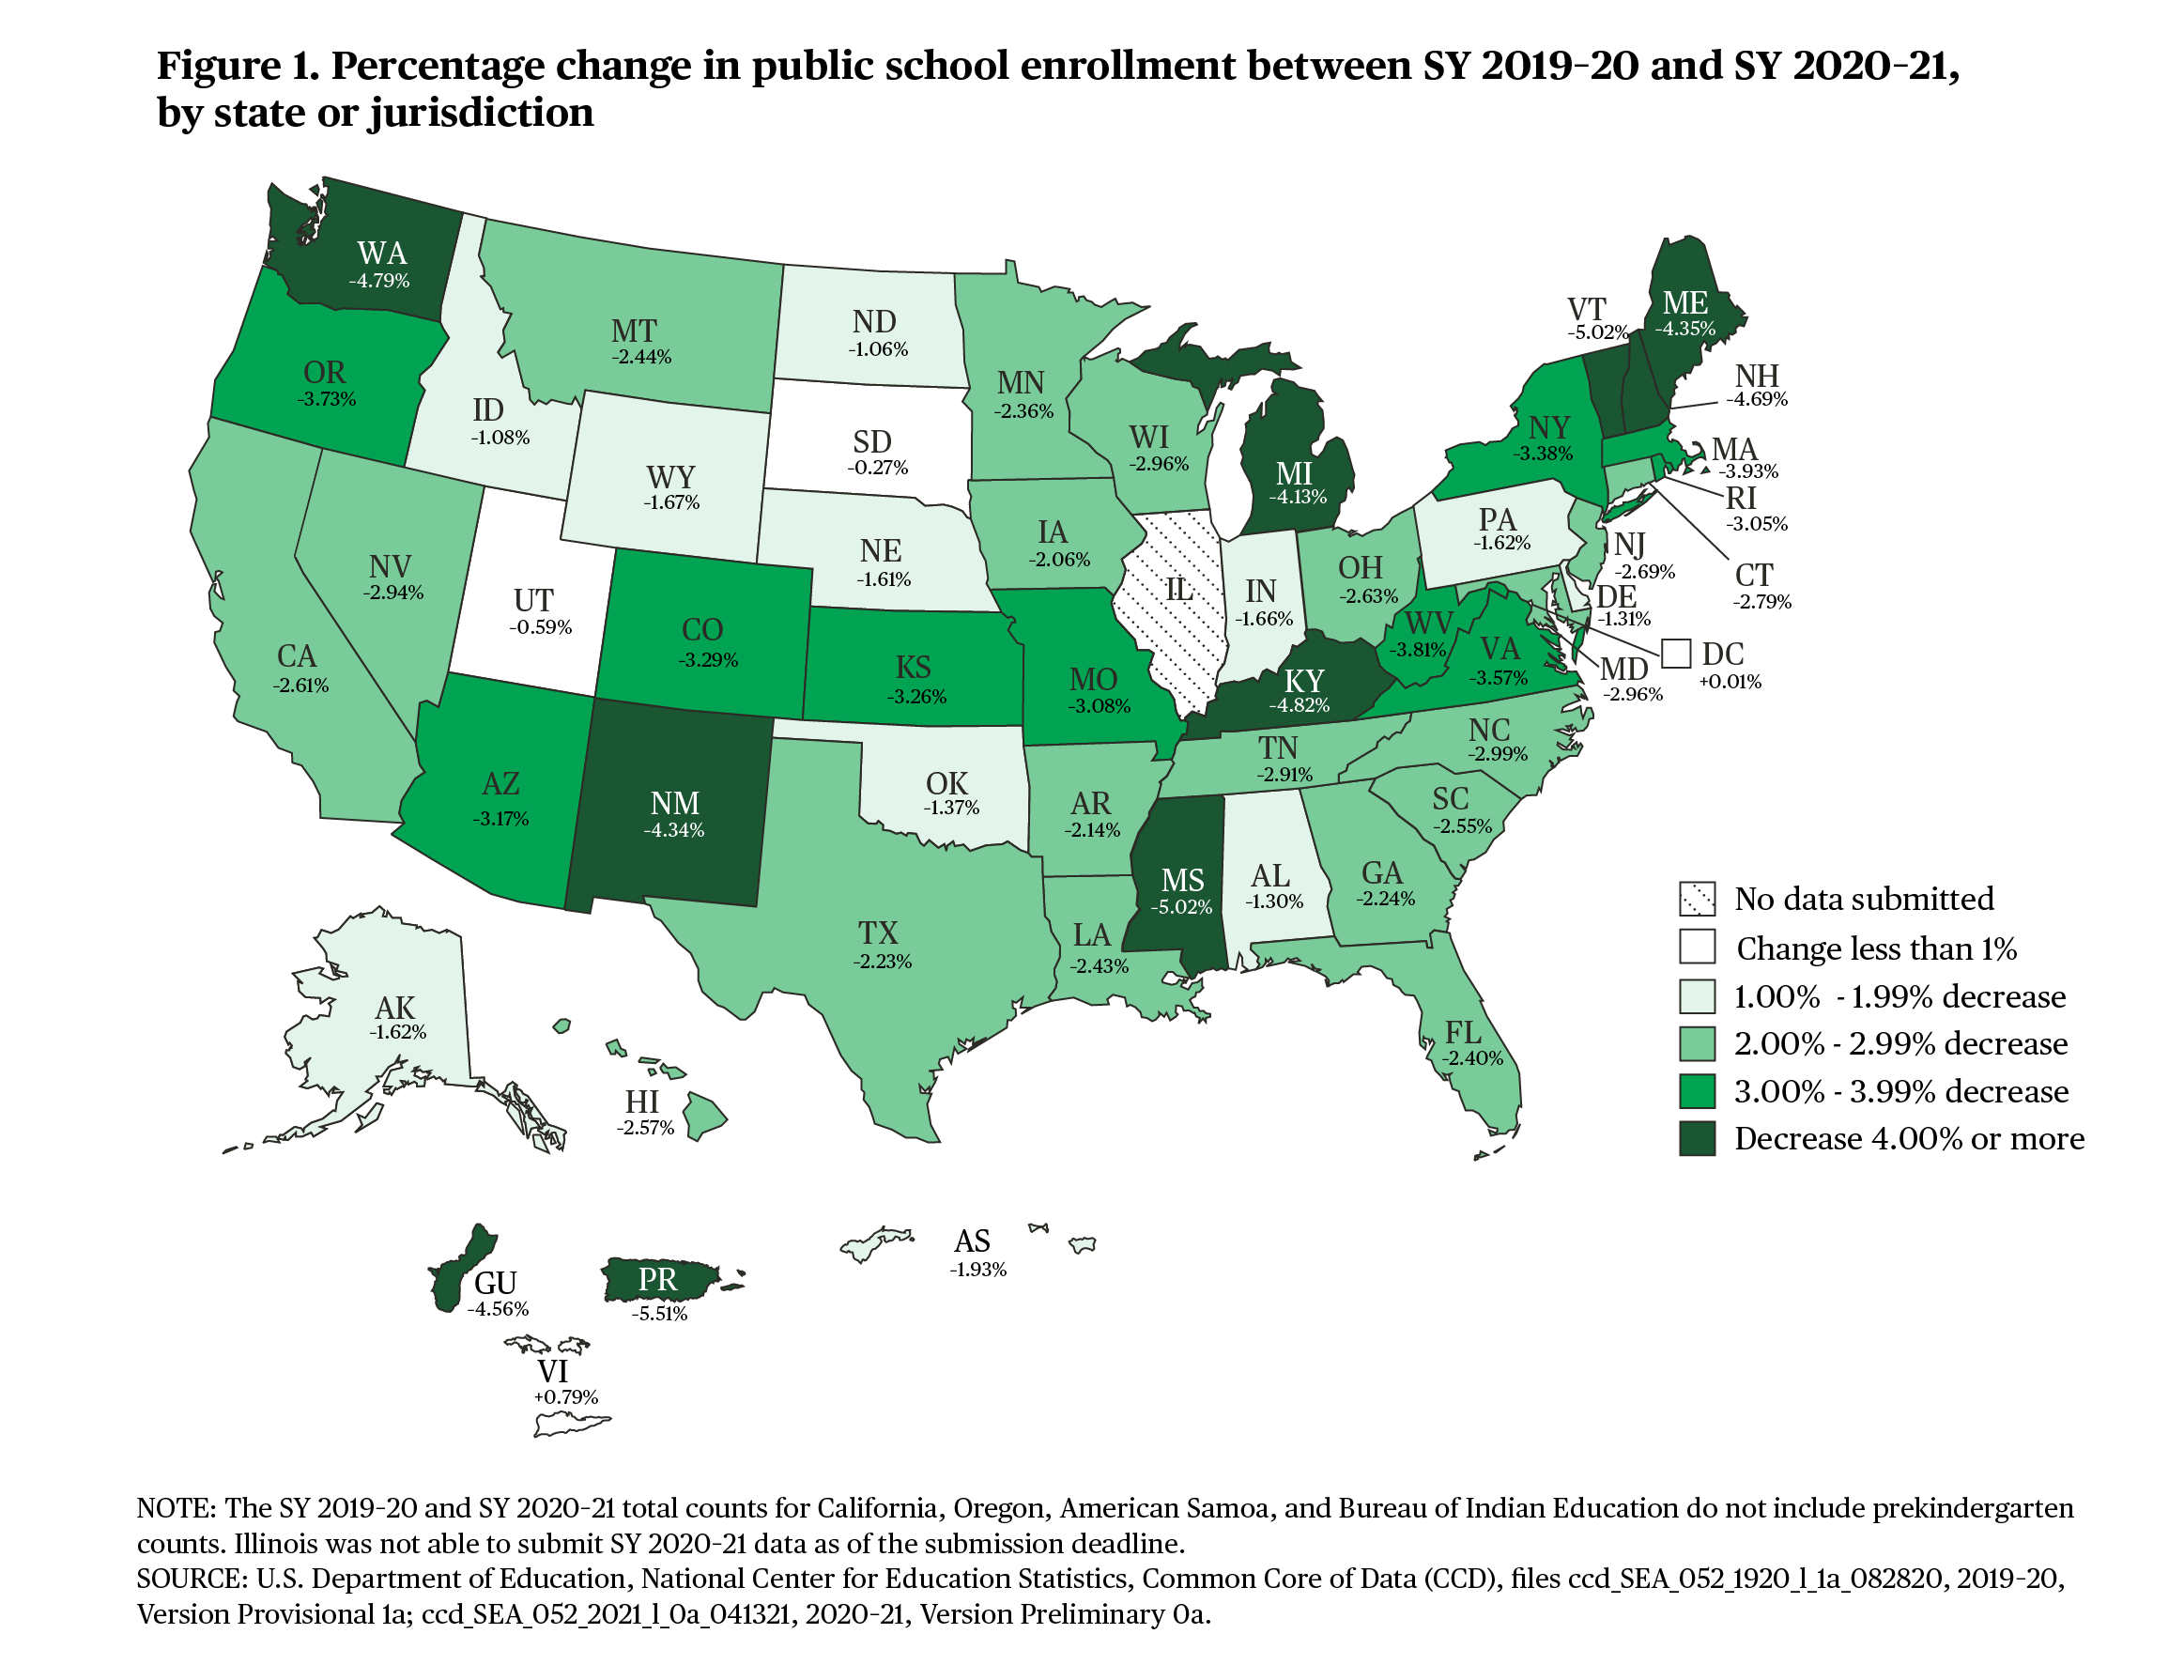
Overall, the number of students enrolled in public schools decreased by 3 percent from SY 2019–20 to SY 2020–21. Note that Illinois did not submit data in time to be included in this preliminary report. The SY 2019–20 and SY 2020–21 total enrollment counts for California, Oregon, American Samoa, and the Bureau of Indian Education do not include prekindergarten counts.

The rate of decline in public school enrollment in SY 2020–21 was not consistent across all states.

Within states, the largest decreases were in Mississippi and Vermont (5 percent each), followed by Washington, New Mexico, Kentucky, New Hampshire, and Maine (each between 4 and 5 percent) (figure 1). Eighteen states had decreases of 3 percent or more; 29 states had decreases between 1 and 3 percent; and the District of Columbia, South Dakota, and Utah had changes of less than 1 percent.


Lower grade levels experienced a greater rate of decline in public school enrollment than did higher grade levels in SY 2020–21.

Public school enrollment decreased by 13 percent for prekindergarten and kindergarten and by 3 percent for grades 1–8. Public school enrollment increased by 0.4 percent for grades 9–12.

Most other jurisdictions experienced declines in public school enrollment in SY 2020–21.

Public school enrollment decreased in Puerto Rico (6 percent), Guam (5 percent), and American Samoa (2 percent). The Virgin Islands, however, experienced an increase of less than 1 percent.

To access the CCD preliminary data files and learn more about public school enrollment in SY 2020–21, visit the CCD data files webpage.