IES Blog

Institute of Education Sciences

Risk Factors and Academic Outcomes in Kindergarten through Third Grade

By Amy Rathbun, AIR and Joel McFarland

Previous NCES research has shown that students with family risk factors tend to have lower average scores than their peers on academic assessments.[1] Risk factors can include coming from a low-income family or single-parent household, not having a parent who completed high school, and living in a household where the primary language is not English. How common is it for children entering U.S. kindergartens to have certain types of family risk factors? And, how do children with risk factors at kindergarten entry perform on academic assessments compared to their peers?  A new spotlight from The Condition of Education 2017 helps to answer these questions.

The spotlight focuses on children experiencing two types of risk factors - living in poverty (i.e., in households with income below the federal poverty threshold) and not having a parent who completed high school, as well as the combination and lack of the two risk factors. Data come from the Early Childhood Longitudinal Study, Kindergarten Class of 2010–11 (ECLS-K:2011). During the 2010–11 school year, 6 percent of first-time kindergartners had both risk factors , 18 percent had the single risk factor of living in poverty, and 2 percent had the single risk factor of not having a parent who completed high school. About 75 percent had neither of these two risk factors present during their kindergarten year.


Percentage distribution of fall 2010 first-time kindergartners, by risk factors related to parent education and poverty: School year 2010–11

NOTE: Detail may not sum to totals because of rounding.
SOURCE: U.S. Department of Education, National Center for Education Statistics, Early Childhood Longitudinal Study, Kindergarten Class of 2010–11 (ECLS-K:2011), Kindergarten–Third Grade Restricted-Use Data File. See Digest of Education Statistics 2016, table 220.39.


Are there differences in the prevalence of risk factors by student and family characteristics?

There were differences in the prevalence of family risk factors in relation to children’s race/ethnicity, primary home language, and family composition. For instance, it was more common for Hispanic students (15 percent) than for Black and Asian students (8 percent each) to have both risk factors, and these percentages were all higher than the percentage for White students (1 percent). Also, 23 percent of first-time kindergartners whose primary home language was not English had both the risk factor of living in poverty and the risk factor of not having a parent who completed high school, compared with 2 percent of kindergartners whose primary home language was English.

Does children’s performance in reading, math, and science in kindergarten through third grade differ based on risk factors?

Kindergarten students living in poverty and those with no parent that completed high school tended to score lower in reading, mathematics, and science over each of their first four years of school compared to their peers who had neither risk factor at kindergarten entry. For example, in the spring of third-grade, reading scores (on a scale of 0 to 141) were higher, on average, for students who had neither risk factor (114 points) than for those with the single risk factor of living in poverty (106 points), those with the single risk factor of not having a parent who completed high school (105 points), and those with both risk factors (102 points).[2]


Average reading scale scores of fall 2010 first-time kindergartners, by time of assessment and risk factors related to parent education and poverty: Fall 2010 through spring 2014

NOTE: Estimates weighted by W7C17P_7T170. Scores on the reading assessments reflect performance on questions measuring basic skills (print familiarity, letter recognition, beginning and ending sounds, rhyming words, and word recognition); vocabulary knowledge; and reading comprehension, including identifying information specifically stated in text (e.g., definitions, facts, and supporting details), making complex inferences from texts, and considering the text objectively and judging its appropriateness and quality. Possible scores for the reading assessment range from 0 to 141.
SOURCE: U.S. Department of Education, National Center for Education Statistics, Early Childhood Longitudinal Study, Kindergarten Class of 2010–11 (ECLS-K:2011), Kindergarten–Third Grade Restricted-Use Data File. See Digest of Education Statistics 2016, table 220.40.


For more information on family risk factors and children’s achievement in reading, mathematics, and science from the fall of kindergarten through the spring of third grade, see the spotlight on this topic in The Condition of Education 2017.

[1] Given that the spring third-grade reading scores have a mean of 110.2 points and a standard deviation (SD) of 12.3 points, this would mean the average score for children who had no risk factors was about 1.0 SD higher than the score for children with no risk factors.

[2] Rathbun, A., and West, J. (2004). From Kindergarten Through Third Grade: Children's Beginning School Experiences (NCES 2004–007). U.S. Department of Education. Washington, DC: National Center for Education Statistics. Retrieved March 2, 2017, from https://nces.ed.gov/pubsearch/pubsinfo.asp?pubid=2004007.


Understanding Outcomes for English Learners: The Importance of the ‘Ever EL' Category

The Institute of Education Sciences funds and supports Researcher-Practitioner Partnerships (RPP) that address significant challenges in education. In this guest blog post, Karen D. Thompson, of Oregon State University and Josh Rew, Martha Martinez, and Chelsea Clinton, of the Oregon Department of Education, describe the work their RPP is doing to better understand and improve the performance English learners in Oregon. Click here to learn more about RPP grants. This research will be part of a Regional Educational Laboratory webinar on June 21.


According to the most recent data, about 10 percent of K-12 students in U.S. public schools were classified as English learners (EL). But that only tells part of the story: a large proportion of students in U.S. schools are former ELs, who have attained proficiency in English and “exited” EL services. Currently, in most states and the nation, we do not know the size of the former EL group because states have only been required to monitor this group of students for a limited amount of time.

Education agencies and the media routinely report the achievement gap between current EL students and their non-EL peers. However, analyzing outcomes only for current EL students does not provide a complete picture of how well schools are serving the full group of students who entered school not yet proficient in English. We refer to this full group, which includes both current and former ELs, as Ever English Learners (Ever ELs).

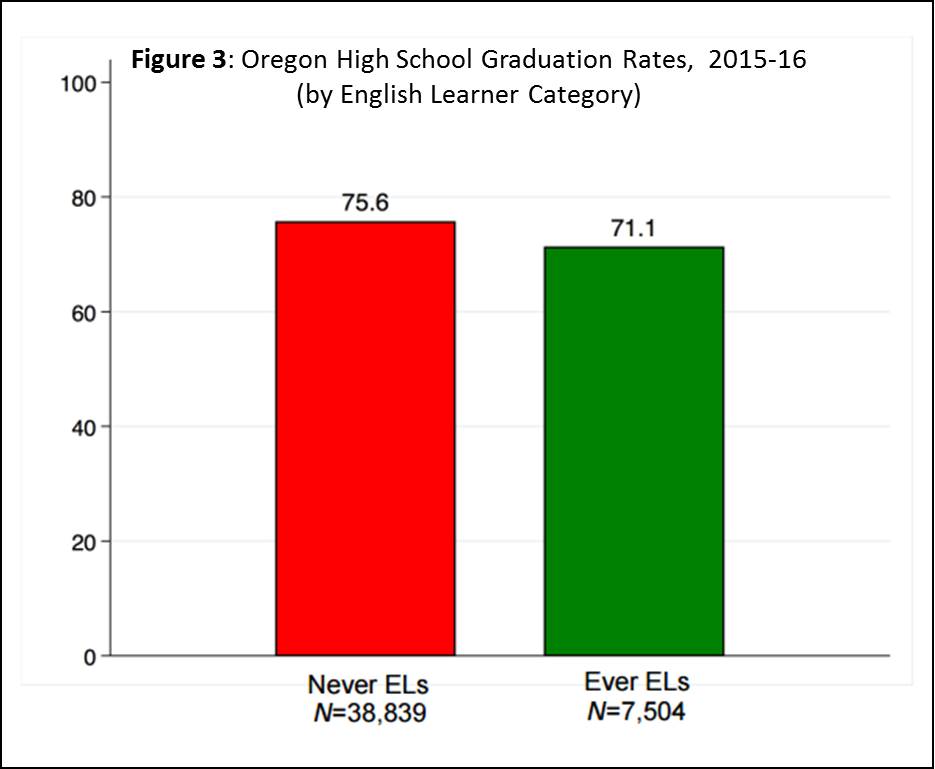
Through our IES-funded partnership, the Oregon Department of Education (ODE) and Oregon State University (OSU) has identified the full group of both current and former ELs in Oregon public K-12 schools. Using 2015-16 Oregon data, we looked at the proportion of Ever ELs who are current and former ELs at each grade level. As seen in Figure 1 below, former ELs outnumber current ELs in grades 6 and above, with the relative size of the former EL population increasing at each grade level.
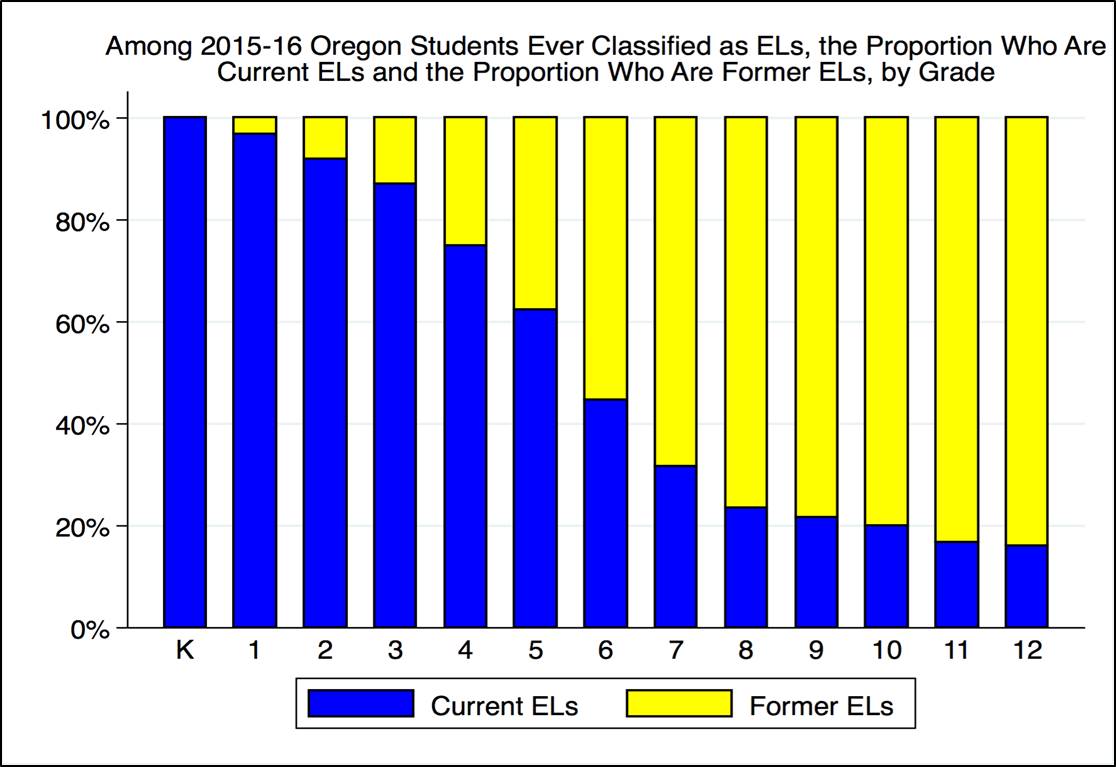

Figure 1


Starting with the 2012-13 school year, ODE began annually reporting to the public the outcomes of Ever ELs (e.g., achievement and growth, chronic absenteeism, rates of freshmen on-track, and graduation rates). These annual reports include school and district report cards, the statewide report card, and technical reports corresponding to specific state initiatives, such as graduation rates, chronic absenteeism, assessment participation, and district EL accountability. 

In the past, states have typically reported achievement outcomes for students currently classified as ELs and compared these to outcomes for all students not currently classified as ELs. Under this reporting scheme, the non-EL subgroup consists of students never classified as ELs and former ELs.  With this grouping (Figure 2), graduation rates for ELs appear much lower than graduation rates for non-ELs (52.9 percent for ELs compared to 75.8 percent for non-ELs).           
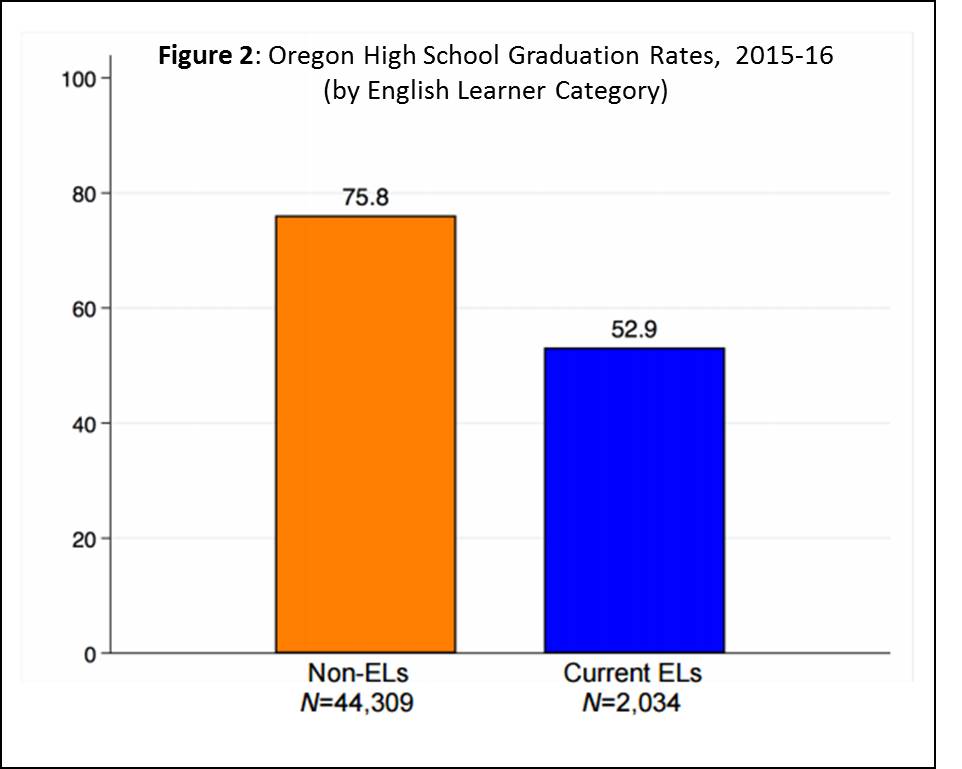
  

However, it may be more appropriate in some situations to instead analyze outcomes for the full group of students who entered school as ELs (Figure 3). Under this alternative reporting scheme, if we combine outcomes for both current and former ELs to create the Ever EL group, we see that graduation rates for Ever ELs are much closer to graduation rates for students never classified as ELs (71.1 percent for Ever ELs compared to 75.6 percent for Never ELs).

While the low graduation rates for current ELs are certainly concerning, it is also important to know that former ELs are graduating at rates slightly higher than students never classified as ELs (77.9 percent vs. 75.6 percent, respectively), as shown in Figure 4.
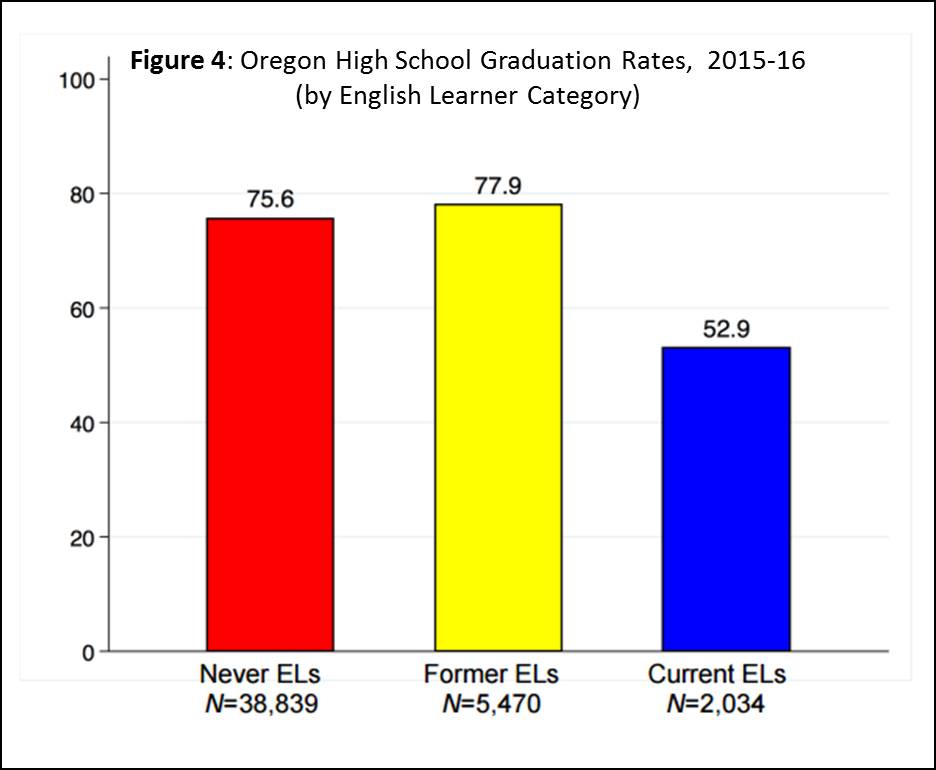
This is particularly noteworthy since former ELs represent a larger proportion of the student population than current ELs at the secondary level.

In addition to annual reporting, the ODE began using data for Ever ELs in 2015-16 to identify districts in need of support, assistance, and improvement, as required by state law.  The state’s accountability system identifies the districts with the highest needs and lowest outcomes as measured by demographic indicators (such as economically disadvantage, migrant or homeless status) and outcome data (e.g., growth, graduation, and post-secondary enrollment) for Ever ELs. Identified districts conduct a needs assessment, identify evidence-based and culturally responsive technical assistance, develop a technical assistance implementation plan, monitor progress, and review outcomes and make necessary adjustments. Along with its applications for reporting and accountability, we have used the Ever EL framework to analyze special education disproportionality, documenting implications for research, policy, and practice.

To learn more about how education agencies are using the Ever EL category, join us and colleagues from New York City for a June 21 webinar, sponsored by Regional Educational Laboratory Northeast and Islands.

Teach a Researcher to Fish: Training to Build Capacity for IES Data Analysis

The Institute of Education Sciences is pleased to announce upcoming training opportunities to help researchers study the state of adult skills and competencies. Training Researchers to Use PIAAC to Further Multidisciplinary Research is a hands-on, interactive training to build the field’s capacity for conducting research using data from the OECD Program for the International Assessment of Adult Competencies (PIAAC).

Picture of students participating in trainingThe training, conducted by the Educational Testing Service (ETS), aims to teach researchers how to use IES data and data tools for further, independent research beyond the training so that they can meet the emerging needs of policymakers and practitioners needs for years to come.

This program is an example of the various ways that IES is building the evidence base in education. The training is supported by a Methods Research Training grant from the National Center for Education Research. It uses PIAAC data, which in the U.S. were collected by the National Center for Education Statistics (NCES). The training also uses data tools that are available through NCES.

Beginning this August, ETS is holding 3-day and 1-day PIAAC trainings in cities throughout the U.S. These trainings will bring together researchers from various organizations and institutions to learn not only about the data and tools but also about how to use them to address important questions about policy-related research from a wide host of fields including education, gerontology, sociology, public health, economics, workforce development, and criminal justice and corrections education. These trainings will culminate with an IES/ETS-sponsored conference in Washington, D.C. in December 2018, during which participants will have an opportunity to present their research.

Who is Eligible?

Researchers from universities, research firms, or other organizations (e.g., advocacy groups, local governments) and who have a doctoral degree or are graduate students in a doctoral programs, experience with statistical packages (e.g., SAS, SPSS) and with secondary data analysis, and an interest in adult learning, skills, and competencies.

What Does it Cost?

The training itself is free for participants, and participants who are U.S. citizens or U.S. permanent residents will receive assistance to cover housing and per diem during the training. Visit the training website for more information about possible finical assistance.

When is the Training? How do I Apply?

The training will take place several times in the coming months:

  • August 30-Sept. 1, 2017 in Chicago;
  • October 2-4, 2017 in Atlanta; 
  • December 4-6, 2017 in Houston;
  • April 13, 2018 in New York City (at the AERA Annual Conference)
  • Culminating Conference: December 1-3, 2018, in Washington, DC

Visit the ETS training website for more information about the program and the most up-to-date schedule. Registration is open and can be completed online.

Written by Meredith Larson, Program Officer, National Center for Education Research


Building CASL: Improving Education through Cognitive Science Research

(Updated on Oct. 20, 2017)

In its 15 years, the Institute of Education Sciences (IES) has helped build the evidence base in many areas of education. One of the key areas where IES has focused in that time has been on Cognition and Student Learning – or CASL. 

The CASL program was established with the purpose of bringing what we know from laboratory-based cognitive science research to the classroom. In 2002, IES funded eight CASL grants—an investment of about $4.9 million. A lot has changed over 15 years. First, the CASL program has increased significantly in size. To date, CASL has funded 165 projects, representing a total investment of over $200 million. 

Second, the CASL program has expanded its research to cover a wider range of cognitive science topics. In the 2000s, many of the cognitive principles studied in education research came from what we know about how the memory system works. This makes sense, as cognitive scientists who study memory have always been thinking about the kinds of issues that are important in a classroom, such as how students encode, retain and successfully recall information.

More recently, the CASL program has supported research across a range of cognitive science topics, even those that do not seem on the surface to be directly relevant to education practice. For example, cognitive scientists who study attention and perception have made contributions to our understanding of how those processes affect learning and retention. These findings have provided the foundational knowledge necessary to design better textbooks, develop education technologies, and even inform how teachers should decorate their classroom walls.

Through CASL, researchers have developed and fine-tuned the process of working in school settings on complex problems of education practice and have developed effective models for moving back and forth between the laboratory and the classroom to advance both theory and practice. Through the CASL program, we now have many different examples of how cognitive science can improve teaching and learning:

  • Want to see how to use cognitive science principles to transform a curriculum? See the National Research & Development Center on Cognition & Mathematics Instruction’s work on the Connected Math Project (CMP) curriculum;
  • Want to see how small changes to instructional materials can make a big impact on student learning? See Nicole McNeil’s research on how best to teach the meaning of the equals sign, as one of many examples; and
  • Want to think about a completely different model for improving students’ STEM outcomes? See Holly Taylor’s project, where her team is further developing and pilot testing Think 3d!, an origami and pop-up paper engineering curriculum designed to teach spatial skills to students.

Sharing the Research

In 2007, findings from CASL research were included in a set of recommendations for educators to use in the classroom. Organizing Instruction and Study to Improve Student Learning was one of the first Educator’s Practice Guides published by the What Works Clearinghouse (another IES program) and was one of the first attempts to synthesize research from cognitive science in ways that would be useful for practitioners. The guide identified a set of effective learning principles, including:

  • spacing learning over time;
  • interleaving worked examples;
  • combining verbal and visual descriptions of concepts;
  • connecting abstract and concrete representations of concepts;
  • using quizzing to promote learning;
  • helping students allocate study time efficiently; and
  • asking deep, explanatory questions.

While the practice guide was successful in its goal of reaching a broader audience, many policymakers, practitioners, and even education researchers from other fields were still unaware of these principles. However, we have recently seen an uptick in the production of summaries of effective learning principles based in cognitive science for various stakeholders, like teachers, parents, and policymakers. Importantly, these summaries appear to be reaching people outside of the cognitive science and learning sciences communities.

Perhaps most well-known among these is Make It Stick: The Science of Successful Learning, by Peter Brown, Mark McDaniel, and Henry Roediger, a popular book published by Harvard University Press (pictured). The book includes findings from research Roediger and McDaniel conducted through three IES-funded CASL grants. CASL research also informed other publications, including The Science of Learning by Deans for Impact and Learning about Learning by the National Council on Teacher Quality.

CASL has come a long way in 15 years, but there are still many gaps in our understanding of how people learn and in how that knowledge can be applied effectively in the classroom to improve learning outcomes for all students. We look forward to sharing more about what IES-funded researchers are learning over the next 15 years and beyond.

EDITOR'S NOTE: This blog post was updated to reflect the FY 2017 awards , increasing the number of CASL grants to 165. 

Written by Erin Higgins, Program Officer for the Cognition and Student Learning program, National Center for Education Research