IES Blog

Institute of Education Sciences

U.S. Is Unique in Score Gap Widening in Mathematics and Science at Both Grades 4 and 8: Prepandemic Evidence from TIMSS

Tracking differences between the performance of high- and low-performing students is one way of monitoring equity in education. These differences are referred to as achievement gaps or “score gaps,” and they may widen or narrow over time.

To provide the most up-to-date international data on this topic, NCES recently released Changes Between 2011 and 2019 in Achievement Gaps Between High- and Low-Performing Students in Mathematics and Science: International Results From TIMSS. This interactive web-based Stats in Brief uses data from the Trends in International Mathematics and Science Study (TIMSS) to explore changes between 2011 and 2019 in the score gaps between students at the 90th percentile (high performing) and the 10th percentile (low performing). The study—which examines data from 47 countries at grade 4, 36 countries at grade 8, and 29 countries at both grades—provides an important picture of prepandemic trends.

This Stats in Brief also provides new analyses of the patterns in score gap changes over the last decade. The focus on patterns sheds light on which part of the achievement distribution may be driving change, which is important for developing appropriate policy responses. 


Did score gaps change in the United States and other countries between 2011 and 2019?

In the United States, score gap changes consistently widened between 2011 and 2019 (figure 1). In fact, the United States was the only country (of 29) where the score gap between high- and low-performing students widened in both mathematics and science at both grade 4 and grade 8.


Figure 1. Changes in scores gaps between high- and low-performing U.S. students between 2011 and 2019
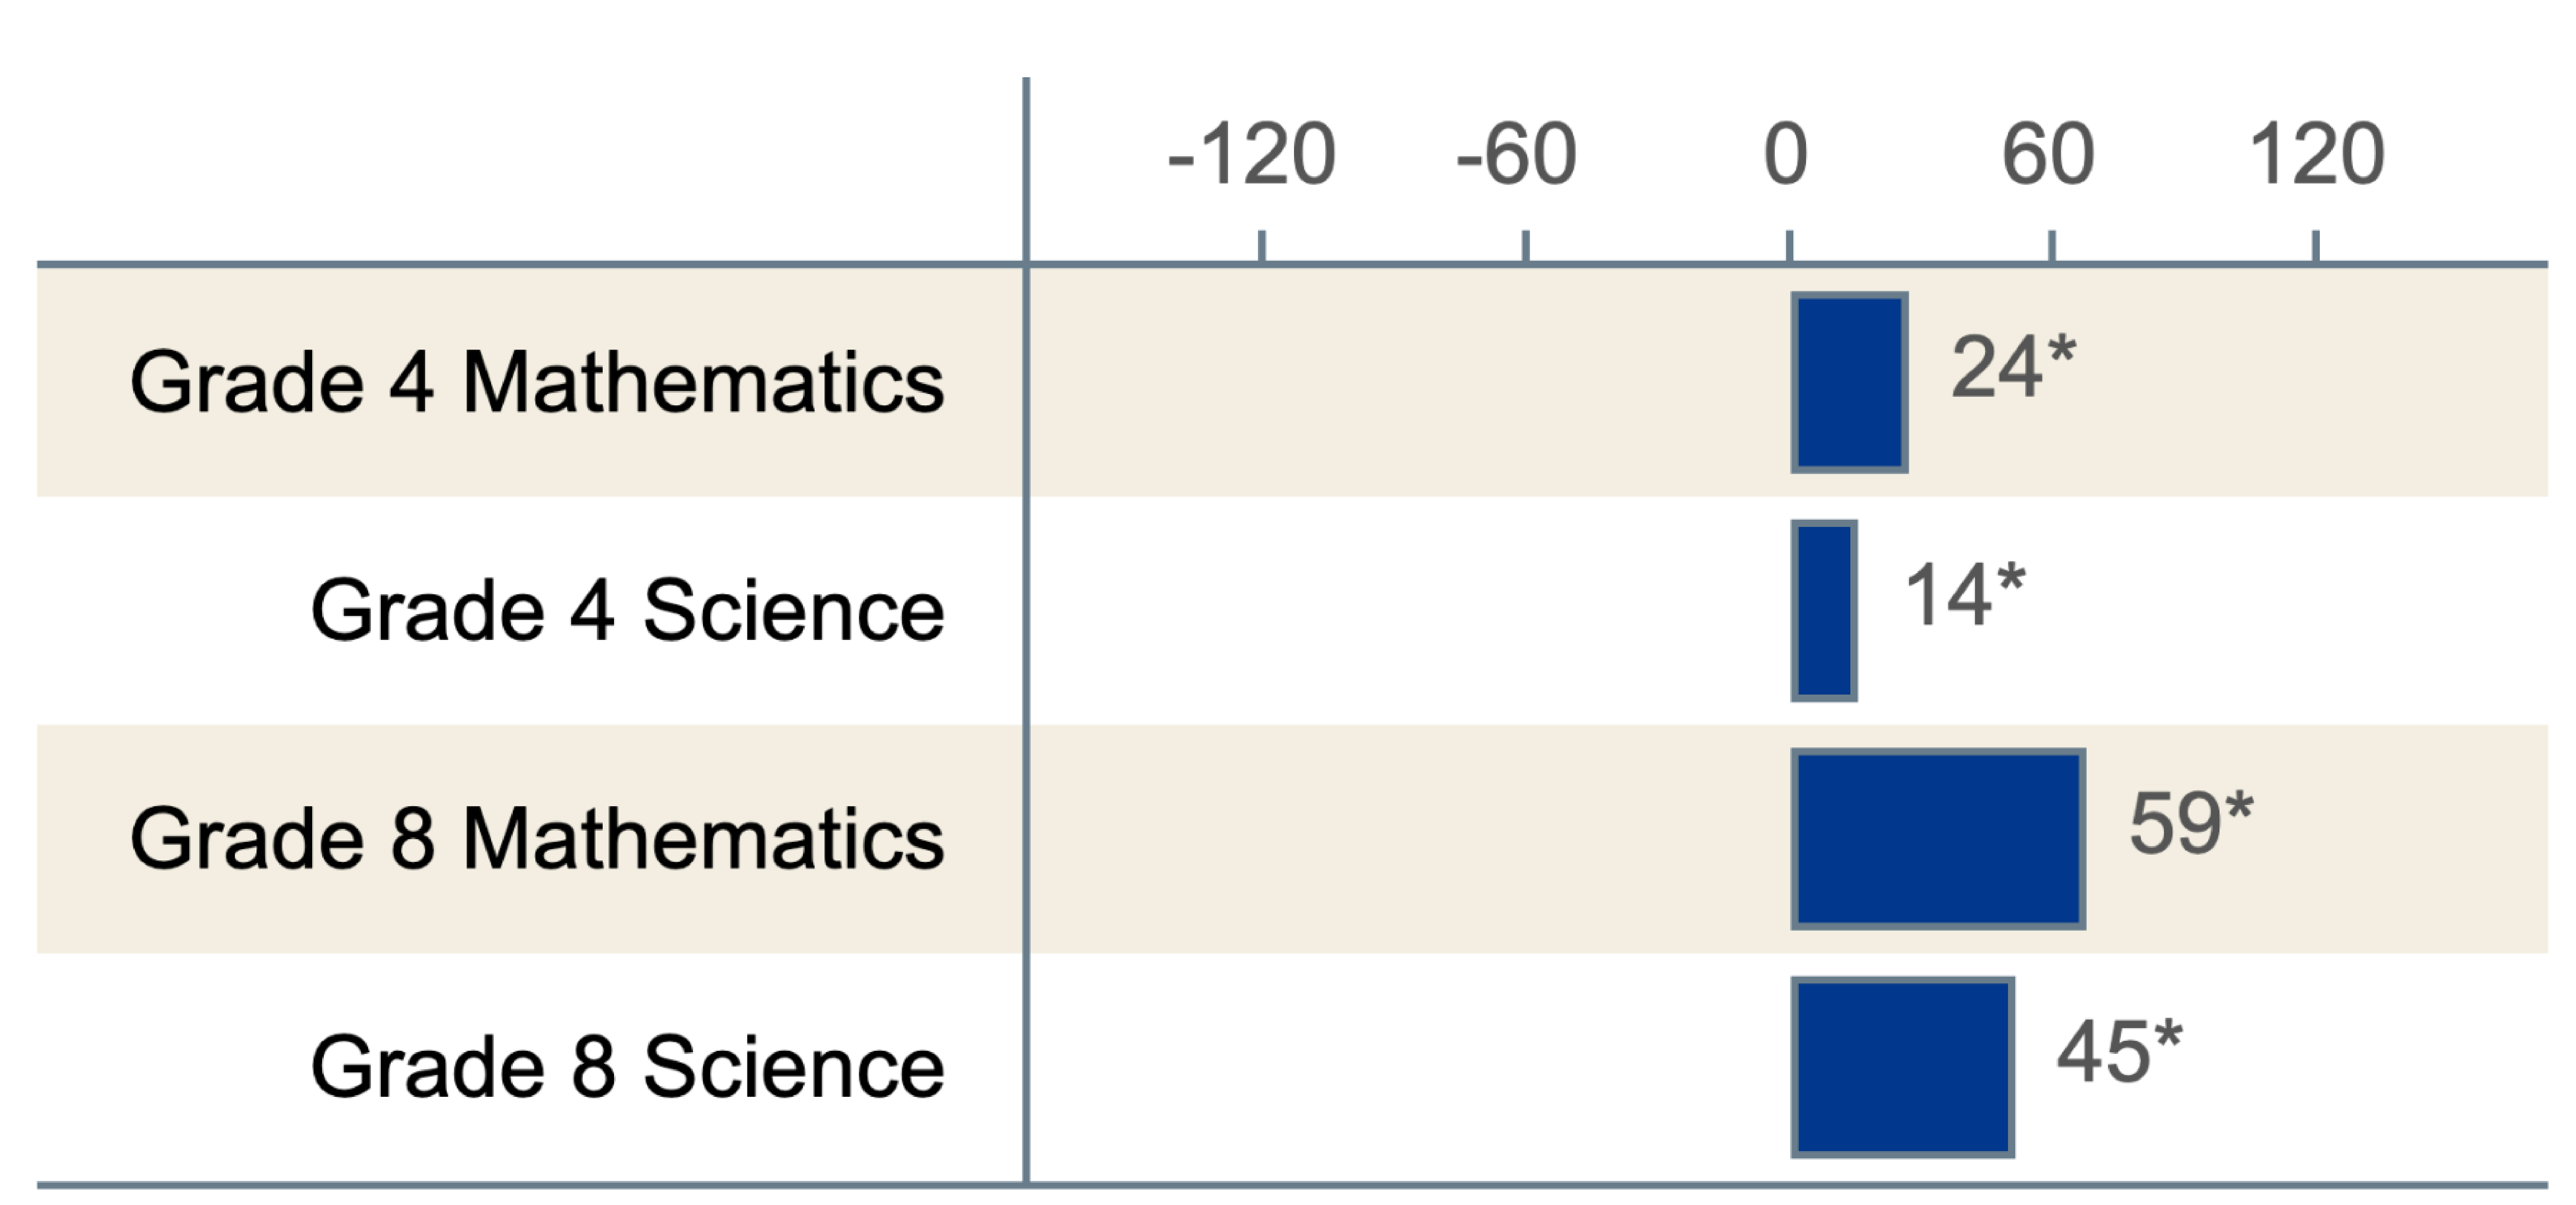
Horizontal bar chart showing changes in scores gaps between high- and low-performing U.S. students between 2011 and 2019

* p < .05. Change in score gap is significant at the .05 level of statistical significance.

SOURCE: Stephens, M., Erberber, E., Tsokodayi, Y., and Fonseca, F. (2022). Changes Between 2011 and 2019 in Achievement Gaps Between High- and Low-Performing Students in Mathematics and Science: International Results From TIMSS (NCES 2022-041). U.S. Department of Education. Washington, DC: National Center for Education Statistics, Institute of Education Sciences. Available at https://nces.ed.gov/pubsearch/pubsinfo.asp?pubid=2022041.


For any given grade and subject combination, no more than a quarter of participating countries had a score gap that widened, and no more than a third had a score gap that narrowed—further highlighting the uniqueness of the U.S. results.


Did score gaps change because of high-performing students, low-performing students, or both?

At grade 4, score gaps widened in the United States between 2011 and 2019 due to decreases in low-performing students’ scores, while high-performing students’ scores did not measurably change (figure 2). This was true for both mathematics and science and for most of the countries where score gaps also widened.


Figure 2. Changes in scores of high- and low-performing U.S. students between 2011 and 2019
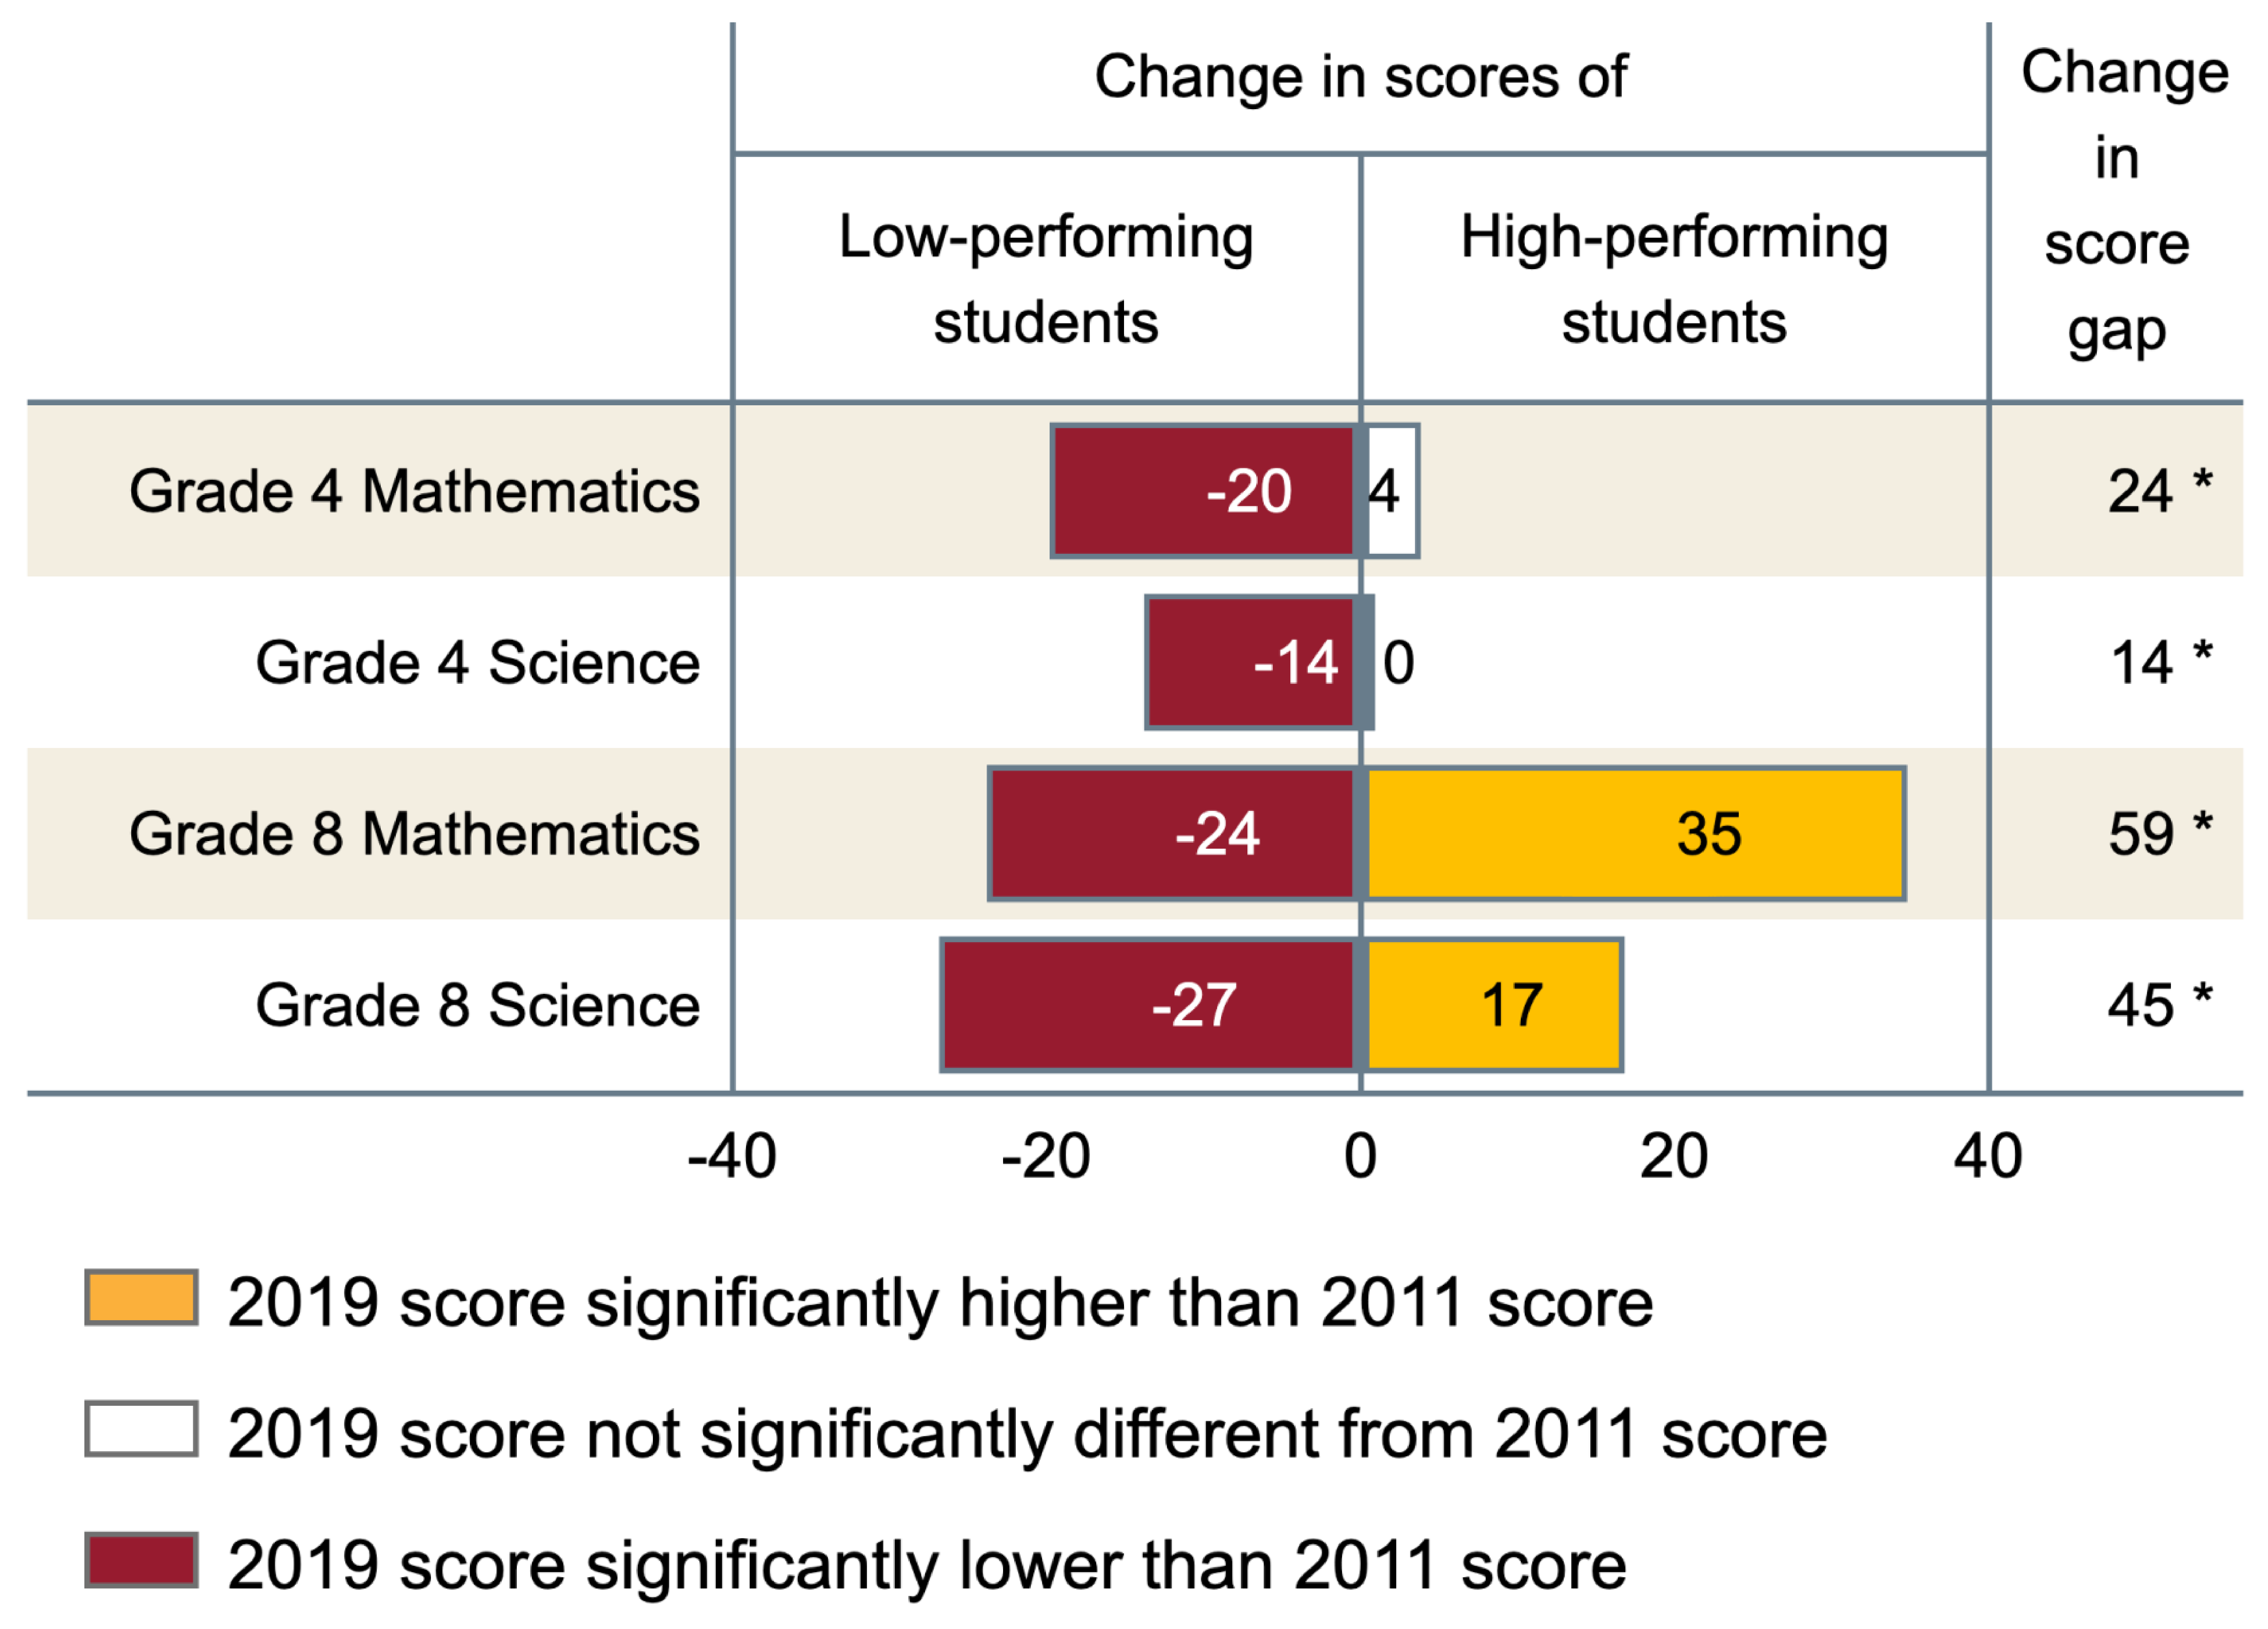
Horizontal bar chart showing changes in scores of high- and low-performing U.S. students between 2011 and 2019 and changes in the corresponding score gaps

p < .05. 2019 score gap is significantly different from 2011 score gap.

SOURCE: Stephens, M., Erberber, E., Tsokodayi, Y., and Fonseca, F. (2022). Changes Between 2011 and 2019 in Achievement Gaps Between High- and Low-Performing Students in Mathematics and Science: International Results From TIMSS (NCES 2022-041). U.S. Department of Education. Washington, DC: National Center for Education Statistics, Institute of Education Sciences. Available at https://nces.ed.gov/pubsearch/pubsinfo.asp?pubid=2022041.


Low-performing U.S. students’ scores also dropped in both subjects at grade 8, but at this grade, they were accompanied by rises in high-performing students’ scores. This pattern—where the two ends of the distribution move in opposite directions—led to the United States’ relatively large changes in score gaps. Among the other countries with widening score gaps at grade 8, this pattern of divergence was not common in mathematics but was more common in science.

In contrast, in countries where the score gaps narrowed, low-performing students’ scores generally increased. In some cases, the scores of both low- and high-performing students increased, but the scores of low-performing students increased more.

Countries with narrowing score gaps typically also saw their average scores rise between 2011 and 2019, demonstrating improvements in both equity and achievement. This was almost never the case in countries where the scores of low-performing students dropped, highlighting the global importance of not letting this group of students fall behind.  


What else can we learn from this TIMSS Stats in Brief?

In addition to providing summary results (described above), this interactive Stats in Brief allows users to select a subject and grade to explore each of the study questions further (exhibit 1). Within each selection, users can choose either a more streamlined or a more expanded view of the cross-country figures and walk through the findings step-by-step while key parts of the figures are highlighted.


Exhibit 1. Preview of the Stats in Brief’s Features
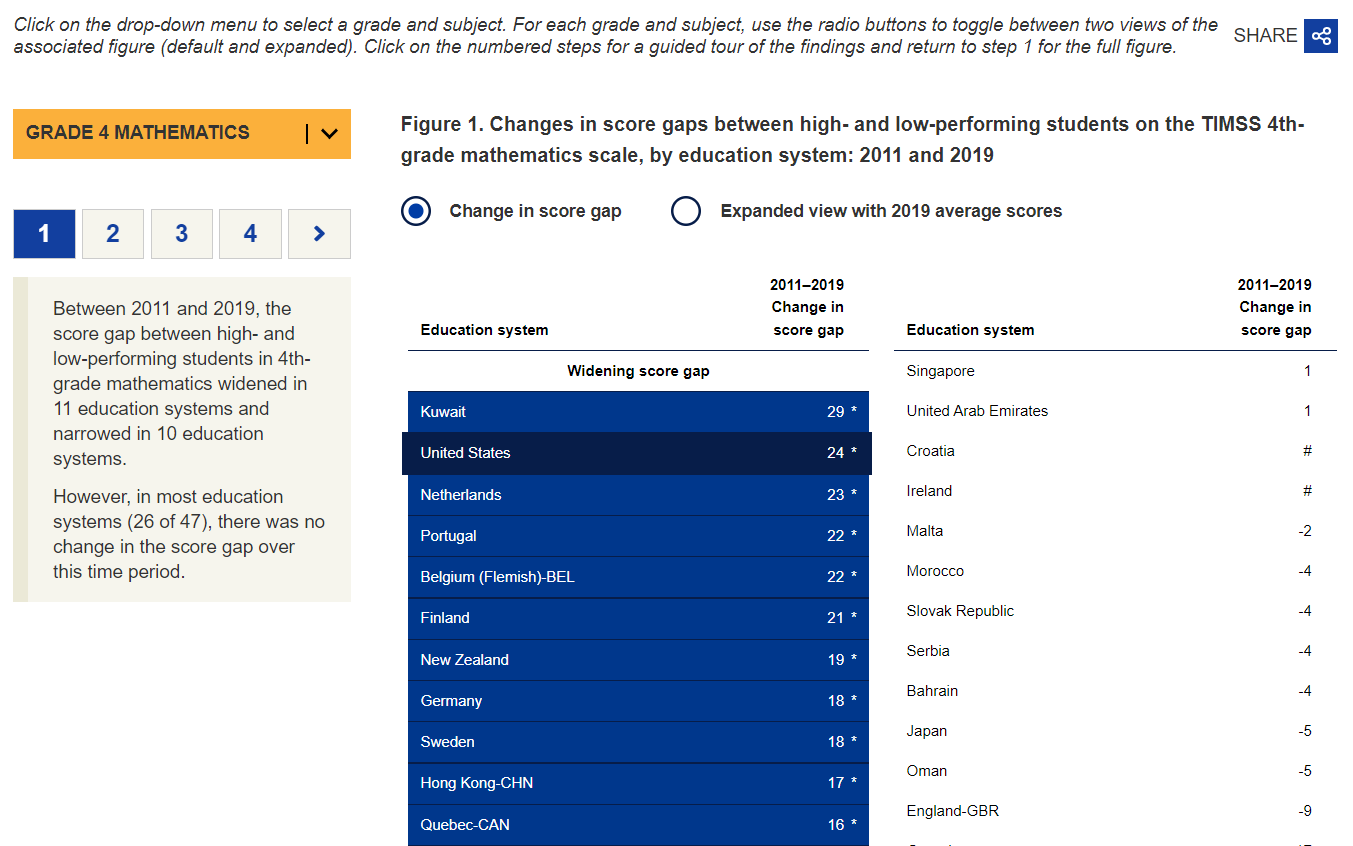
Image of the TIMSS Stats in Brief web report


Explore NCES’ new interactive TIMSS Stats in Brief to learn more about how score gaps between high- and low-performing students have changed over time across countries.

Be sure to follow NCES on TwitterFacebookLinkedIn, and YouTube and subscribe to the NCES News Flash to stay up-to-date on TIMSS data releases and resources.


By Maria Stephens and Ebru Erberber, AIR; and Lydia Malley, NCES

A Closer Look at the National Indian Education Study

While many NCES reports and products compare data between racial and ethnic groups, it is important to remember that outcomes can also differ substantially for individuals within these individual groups. The National Indian Education Study (NIES), part of the National Assessment of Education Progress (NAEP), is one way that NCES tries to look at the diverse experiences of a particular group of students.

One of the primary goals of NIES is to collect and report data for subgroups of American Indian and Alaska Native (AI/AN) students.  NCES released an initial report on the results of the 2015 NIES in early 2017 that focused on differences across three mutually exclusive school types:

  • Low density public schools (where less than 25 percent of all students in the school were AI/AN)
  • High density public schools (where 25 percent or more of all the students in the school were AI/AN)
  • Bureau of Indian Education schools

A recently released follow up report, National Indian Education Study 2015:  A Closer Look builds on the findings of the first report and focuses, in part, on NAEP 2015 assessment differences within the AI/AN student group. Although NIES provides a large enough sample size to facilitate comparisons among groups of AI/AN students, it is important to note that AI/AN students are diverse linguistically, culturally, geographically, economically, and in many other ways. By focusing specifically on this student group, NCES is able to highlight the educational experiences and related academic outcomes of these students.

National Indian Education Study 2015: A Closer Look reveals some significant differences when comparing AI/AN students performing at or above the 75th percentile (referred to in the report as “higher-performing”) with those performing below the 25th percentile (referred to as “lower-performing”). For example, higher-performing students in both mathematics and reading and in both grades 4 and 8 were more likely to have: 

  • A school library, media center, or resource center that contained materials about AI/AN people,
  • More than 25 books in their homes, and
  • A computer at home that they use.

A Technical Review Panel of American Indian and Alaska Native educators and researchers from across the country provides guidance on the study. Their expertise helps to ensure that this report will provide valuable, and much needed information to AI/AN educational stakeholders. In addition, whereas most other NCES reports are now electronic-only, hard copies of the NIES report are also produced in support of making them available for those AI/AN educational stakeholders who may not have easy access to the internet. This report is also unique in that the Technical Review Panel issued a statement highlighting the importance of this study and providing a brief overview of the overall context of AI/AN education, which may be helpful to readers as they read the report. This statement is available online at https://www2.ed.gov/about/offices/list/oese/resources.html


By Jamie Deaton

Measuring the Achievement and Experiences of American Indian and Alaska Native Youth: National Indian Education Study 2015

By Lauren Musu-Gillette and James Deaton

In order to measure the progress of education in the United States, it is important to examine equity and growth for students from many different demographic groups. The educational experiences of American Indian and Alaska Native (AI/AN) youth are of particular interest to educators and policymakers because of the prevalence of academic risk factors for this group. For example, the percentage of students served under the Individuals with Disabilities Education Act (IDEA) in 2013-14 was highest for AI/AN students,[1] and in 2013 a higher percentage of American Indian/Alaska Native 8th-grade students than of Hispanic, White, or Asian 8th-grade students were absent more than 10 days in the last month.[2]  

Although NCES attempts to collect data from AI/AN students in all of our surveys, disaggregated data for this group are sometimes not reportable due to their relatively small population size. Therefore, data collections that specifically target this group of students can be particularly valuable in ensuring the educational research and policy community has the information they need. The National Indian Education Survey is one of the primary resources for data on AI/AN youth.

The National Indian Education Study (NIES) is administered as part of the National Assessment of Educational Progress (NAEP) to allow more in-depth reporting on the achievement and experiences of AI/AN students in grade 4 and 8. NIES provides data at the national level and for select states with relatively high percentages of American Indians and/or Alaska Natives.[3] It also provides data by the concentration of AI/AN students attending schools in three mutually exclusive categories: Low density public schools (less than 25 percent AI/AN);[4] High density public schools (more than 25 percent AI/AN);[5] and Bureau of Indian Education (BIE) schools.[6]

In a recently released report on the results of the 2015 NIES, differences in performance on the reading and mathematics assessments emerged across school type. In 2015, students in low density public schools had higher scores in both subjects than those in high density public or BIE schools, and scores for students in high density public schools were higher than for those in BIE schools. Additionally, there were some score differences over time. For example, at grade 8, average reading scores in 2015 for students in BIE schools were higher than scores in 2009 and 2007, but were not significantly different from scores in 2011 and 2005 (Figure 2). 


* Significantly different (p < .05) from 2015.
NOTE: AI/AN = American Indian/Alaska Native. BIE = Bureau of Indian Education. School density indicates the proportion of AI/AN students enrolled. Low density public schools have less than 25 percent AI/AN students. High density public schools have 25 percent or more. All AI/AN students (public) includes only students in public and BIE schools. Performance results are not available for BIE schools at fourth grade in 2015 because school participation rates did not meet the 70 percent criteria.
SOURCE: U.S. Department of Education, Institute of Education Sciences, National Center for Education Statistics, National Assessment of Educational Progress (NAEP), various years, 2005-15 National Indian Education Studies.


The characteristics of students attending low density, high density, and BIE schools differed at both grades. For example, BIE schools had a significantly higher percentage of students who were English language learners (ELL) and eligible for the National School Lunch Program (NSLP). Additionally, high density schools had a significantly higher percentage of ELL students and NSLP-eligible students than low density schools.

The report also explored to what extent AI/AN culture and language are part of the school curricula. AI/AN students in grades 4 and 8 reported that family members taught them the most about Native traditions. Differences by school type and density were observed in responses to other questions about the knowledge AI/AN students had of their family’s Native culture, the role AI/AN languages played in their lives, and their involvement in Native cultural ceremonies and gatherings in the community. For example, 28 percent of 4th-grade students in BIE schools reported they knew “a lot” about the history, traditions, or arts and crafts of their tribe compared to 22 percent of their AI/AN peers in high density schools, and 18 percent of those in low density schools. Similarly, 52 percent of 8th-grade students at BIE schools participated several times a year in ceremonies and gatherings of their AI/AN tribe or group, compared to 28 percent of their peers at high density public schools, and 20 percent of their peers at low density public schools.

If you’re interested in learning more about NIES, including what the study means for American Indian and Alaska Native students and communities, you can view the video below. Access the compete report and find out more about the study here: https://nces.ed.gov/nationsreportcard/nies/


[1] See https://nces.ed.gov/programs/coe/indicator_cgg.asp

[2] See https://nces.ed.gov/programs/raceindicators/indicator_rcc.asp

[3] American Indian and Alaska Native state-specific 2015 NIES results are available for the following 14 states:  Alaska, Arizona, Minnesota, Montana, New Mexico, North Carolina, North Dakota, Oklahoma, Oregon, South Dakota, Utah, Washington, Wisconsin, and Wyoming. 

[4] Less than 25 percent of the student body is American Indian or Alaska Native. In low density schools, AI/AN students represented 1 percent of the students at grades 4 and 8.

[5] 25 percent or more of the student body is American Indian or Alaska Native. In high density schools, 53 percent of 4th-graders and 54 percent of 8th-graders were AI/AN students.

[6] In BIE schools, 97 percent of 4th-graders and 99 percent of 8th-graders were AI/AN students. 

America’s Advanced Mathematics and Physics Students in a Global Context

By Dana Tofig, Communications Director, Institute of Education Sciences

In today’s increasingly global economy, there is a lot of interest in understanding how students in the United States (U.S.) are performing compared to their peers around the world. That is why the National Center for Education Statistics participates in and conducts several international assessments. One of those assessments—the Trends in International Mathematics and Science Study (TIMSS) Advanced—gives us a unique opportunity to see how our advanced students are performing in rigorous mathematics and physics classes as they complete high school. TIMSS Advanced is part of a broader data collection that also assesses the performance of 4th- and 8th-grade students in mathematics and science, the results of which are summarized in another blog entry.

The TIMSS Advanced 2015 was administered to students from nine education systems that were in their final year of secondary school who had taken or were taking advanced mathematics or physics courses. In the U.S., the TIMSS Advanced was given to over 5,500 students in Grade 12 who were taking or had taken advanced mathematics courses covering topics in geometry, algebra and calculus, or a second-year physics course. The last time that the U.S. participated in TIMSS Advanced was 1995.

What Percentage of Students Take Advanced Mathematics and Physics?

Among the nine education systems participating in TIMSS Advanced 2015, the percentage of the corresponding age cohort (18-year-olds in the U.S.) taking advanced mathematics varies widely. This percentage, which TIMSS calls the “coverage index,” ranges from a low of 1.9 percent to a high of 34.4 percent. The U.S. falls in the middle, with 11.4 percent of 18-year-olds taking advanced mathematics courses.  The U.S. advanced mathematics coverage index in 2015 has nearly doubled since 1995, when it was 6.4 percent.

In the U.S. and two other participating systems—Portugal and Russian Federation—the students taking advanced mathematics were split fairly evenly between male and female. In the remaining systems, the students in the coverage index were majority male, except for Slovenia, where 60 percent were female. Interestingly, Slovenia had the highest coverage index, at 34.4 percent.

It’s a different story in science for the U.S. Among 18-year-olds in the U.S., 4.8 percent took Physics, which was among the lowest for the nine systems participating in TIMSS Advanced. Only Lebanon (3.9 percent) had a lower percentage, while France had the highest coverage index at 21.5 percent. Males made up a majority of physics students in all nine participating systems, including the U.S. 

How Did U.S. Students Perform in Advanced Mathematics?

U.S. students scored 485 on TIMSS Advanced 2015 in advanced mathematics, which is not significantly different from the average U.S. score in 1995. It should be noted that on TIMSS 2015, given to a representative sample of fourth- and eighth-graders across the U.S., mathematics scores for both grades increased significantly from 1995 to 2015.

On TIMSS Advanced 2015 in advanced mathematics, two systems scored significantly higher than the U.S. (Lebanon and Russian Federation students who took intensive courses[1]) while five systems scored significantly lower (Norway, Sweden, France, Italy and Slovenia). The remaining two systems scored about the same as the U.S.

How Did U.S. Students Perform in Physics?

U.S. students scored 437 on TIMSS Advanced 2015 in physics, which was not statistically different than in 1995. No education system did better on physics in 2015 than 1995, but several did worse—four of the six systems that took the TIMSS Advanced in both 1995 and 2015 saw a significant drop in their scores.

Four of the nine countries participating in TIMSS Advanced 2015 in physics had a score that was significantly higher than the U.S. (Russian Federation, Portugal, Norway, and Slovenia) and three countries scored significantly lower than the U.S. (Lebanon, Italy and France). Sweden’s physics score was not significantly different than the U.S. 

A Note about Interpretation

It’s important to remember that there are differences in student characteristics and the structure of the various education systems that participated in TIMSS Advanced 2015. Those differences should be kept in mind when interpreting results. 


[1] Intensive courses are advanced mathematics courses that involve 6 or more hours per week. Results for students in these courses are reported separately from the results for other students from the Russian Federation taking courses that involve 4.5 hours per week. 

New Data From the Trends in International Mathematics and Science Study

How do U.S. students compare to their international peers? A look at the Trends in International Mathematics and Science Study at 4th and 8th-grade

By Lydia Malley

In today’s interconnected world, it is important to understand the skills of students in the U.S. relative to their international peers. To this end, NCES participates in a number of international assessments. Results from one of these assessments, the Trends in International Mathematics and Science Study (TIMSS), were released on November 29th. Our new report, Highlights from TIMSS and TIMSS Advanced 2015, compares the mathematics and science performance of U.S. fourth- and eighth-grade to that of their peers in over 60 countries or education systems across 6 continents. This report also presents results from TIMSS Advanced, which assessed the advanced mathematics and physics knowledge and skills of twelfth-graders in 9 countries. The results from TIMSS Advanced are discussed more in depth in another blog post.


TIMSS results show that the mathematic scores of U.S. fourth- and eighth-grade students have improved over time, while science scores have held relatively steady. TIMSS is designed to measure trends in mathematics and science achievement. Conducted every 4 years, TIMSS 2015 represents the sixth such study since TIMSS was first conducted in 1995.

Among the report’s key findings:

Fourth-grade mathematics:

  • Fourth-grade mathematics performance in the United States has improved since 1995.
  • Among 54 education systems that participated in the most recent TIMSS, average scores in 10 systems were higher than the U.S. average, 9 education systems were not measurably different from the U.S. average, and average scores in 34 systems were lower than the U.S. average.

Eighth-grade mathematics:

  • The eighth-grade average mathematics score of the United States in 2015 was higher than in any prior administration of TIMSS, since the first administration in 1995.
  • Among 43 education systems, average scores in 8 systems were higher than the U.S. average, 10 education systems were not measurably different from the U.S. average, and average scores in 24 systems were lower than the U.S. average.

Fourth-grade science:

  • Fourth-grade science performance in the United States in 2015 was not measurably different from the performance in 1995 or 2011.
  • Among 53 education systems that participated in the 2015 TIMSS, average scores in 7 systems were higher than the U.S. average, 7 education systems were not measurably different from the U.S. average, and average scores in 38 systems were lower than the U.S. average.

Eighth-grade science: U.S. eighth-graders’ average science score increased between 1995 and 2015, although the scores in the most recent years (2011 and 2015) were not measurably different.

  • Among 43 education systems, in 2015 average scores in 7 systems were higher than the U.S. average, in 9 education systems the average scores were not measurably different from the U.S. average, and average scores in 26 systems were lower than the U.S. average.

Results by Gender:

  • Males scored 7 points higher than females in fourth-grade mathematics, and eighth-grade mathematics scores for males and females were not measurably different.
  • Males scored four points higher than females in fourth-grade science and five points higher in eighth-grade science.


TIMSS is designed to align broadly with mathematics and science curricula in the participating education systems and, therefore, to reflect students’ school-based learning. TIMSS also collects information about educational contexts (such as students’ schools and teachers) that may be related to students’ achievement.

The full report is available at https://nces.ed.gov/timss/. In addition, TIMSS results are now easier than ever to access, with more than 60 tables and figures, reports, detailed descriptions of the assessments, technical notes and more available on the TIMSS 2015 website, at https://nces.ed.gov/timss/results15.asp.

TIMSS and TIMSS Advanced are sponsored by the International Association for the Evaluation of Educational Achievement (IEA) and managed in the United States by the National Center for Education Statistics (NCES), part of the U.S. Department of Education.