IES Blog

Institute of Education Sciences

NCES Presentation at National HBCU Week Conference

In NCES’s recently released Strategic Plan, Goal 3 identifies our commitment to foster and leverage beneficial partnerships. To fulfill that goal, NCES participates in multiple conferences and meetings throughout the year. Recently, NCES participated in the National Historically Black Colleges and Universities (HBCU) Week Conference. NCES’s presentation at this conference helps us to establish a dialogue with HBCUs and develop partnerships to address critical issues in education.

NCES Commissioner Peggy G. Carr kicked off the presentation with an overview of HBCU data—such as student characteristics, enrollment, and financial aid. Then, NCES experts explored how data from various NCES surveys can help researchers, educators, and policymakers better understand the condition and progress of HBCUs. Read on to learn about these surveys.


Integrated Postsecondary Education Data System (IPEDS)

The Integrated Postsecondary Education Data System (IPEDS) is an annual administrative data collection that gathers information from more than 6,000 postsecondary institutions, including 99 degree-granting, Title IV–eligible HBCUs (in the 2021–22 academic year).

The data collected in IPEDS includes information on institutional characteristics and resources; admissions and completions; student enrollment; student financial aid; and human resources (i.e., staff characteristics). These data are disaggregated, offering insights into student and employee demographics by race/ethnicity and gender, students’ age categories, first-time/non-first-time enrollment statuses, and full-time/part-time attendance intensity.

Data from IPEDS can be explored using various data tools—such as Data Explorer, Trend Generator, and College Navigator—that cater to users with varying levels of data knowledge and varying data needs.


National Postsecondary Student Aid Study (NPSAS)

The National Postsecondary Student Aid Study (NPSAS) is a nationally representative study that examines the characteristics of students in postsecondary institutions—including HBCUs—with a special focus on how they finance their education. NPSAS collects data on the percentage of HBCU students receiving financial aid and the average amounts received from various sources (i.e., federal, state, and institution) by gender and race/ethnicity.

Conducted every 3 or 4 years, this study combines data from student surveys, student-level school records, and other administrative sources and is designed to describe the federal government’s investment in financing students’ postsecondary education.

Data from NPSAS can be explored using DataLab and PowerStats.


National Teacher and Principal Survey (NTPS)

The National Teacher and Principal Survey (NTPS) is the U.S. Department of Education’s primary source of information on K–12 public and private schools from the perspectives of teachers and administrators. NTPS consists of coordinated surveys of schools, principals, and teachers and includes follow-up surveys to study principal and teacher attrition.

Among many other topics, NTPS collects data on the race/ethnicity of teachers and principals. These data—which show that Black teachers and principals make up a relatively small portion of the K–12 workforce—can be used to explore the demographics and experiences of teachers and principals. NTPS provides postsecondary institutions, like HBCUs, a snapshot of the preK–12 experiences of students and staff.

Data from NTPS can be explored using DataLab and PowerStats.


National Assessment of Educational Progress (NAEP)

The National Assessment of Educational Progress (NAEP)—also known as the Nation’s Report Card—is the the largest nationally representative and continuing assessment of what students in public and private schools in the United States know and are able to do in various subjects.

Main NAEP assesses students in grades 4, 8, and 12 in subjects like reading, mathematics, science, and civics, while NAEP Long-Term Trend assesses 9-, 13-, and 17-year-olds in reading and mathematics.

Among many other topics, NAEP collects data on students by race/ethnicity. These data can help to shed light on students’ experiences, academic performance, and level of preparedness before they enroll in HBCUs.

Data from NAEP can be explored using the NAEP Data Explorer.


To explore more HBCU data from these and other NCES surveys—including enrollment trends from 1976 to 2021—check out this annually updated Fast Fact. Be sure to follow NCES on X, Facebook, LinkedIn, and YouTube and subscribe to the NCES News Flash to stay up to date on the latest from NCES.


By Megan Barnett, AIR

NCES Celebrates IES and NCES Anniversaries With Retrospective Report on Federal Education Statistics

This year marks the 20th anniversary of the Institute of Education Sciences (IES) and 155 years since the creation of a federal agency to collect and report education statistics for the United States, a role now fulfilled by the National Center for Education Statistics (NCES). To celebrate both of these anniversaries, NCES has just released a new commemorative report—A Retrospective Look at U.S. Education Statistics—that explores the history and use of federal education statistics.


The 11 statistical profiles in phase I of this report can be found within two tabs: Elementary and Secondary Education and Postsecondary Education. Users can toggle between these two tabs and then select a particular statistical profile in the drop-down menu, such as Number of Elementary and Secondary Schools, High School Coursetaking, Enrollment in Postsecondary Institutions, and Postsecondary Student Costs and Financing.


Image of report website showing tabs for Elementary and Secondary Education and Postsecondary Education and the drop-down menu to select individual statistical profiles


Each of the statistical profiles in this report is broken down into the following sections:

  • what the statistic measures (what the data may indicate about a particular topic)
  • what to know about the statistic (the history of the data collection and how it may have changed over time)
  • what the data reveal (broad historical trends/patterns in the data, accompanied by figures)
  • more information (reference tables and related resources)

Each statistical profile can be downloaded as a PDF, and each figure within a profile can be downloaded or shared via a link or on social media.

For background and context, this report also includes a Historical Event Timeline. In this section, readers can learn about major periods of prolonged economic downturn, periods of military action, and periods when U.S. troops were drafted as a part of military action—as well as major pieces of federal legislation—and how some of these events could have disrupted the nation’s social life and schooling or impacted education across the country.

The report also includes a brief overview of NCES, which can be accessed by expanding the dark blue bar labeled NCES Overview: Past, Present, and Future. This section covers the history of NCES and its mission, the evolution of NCES reports and data collections, and current and future changes to NCES’s reporting methods.


Image of report website showing introductory text and the NCES Overview blue bar


This commemorative guide to federal education statistics is not intended to be a comprehensive report on the subject but rather a resource that provides an in-depth look at a selection of statistics. Stay tuned for the release of phase II next year, which will include additional statistical profiles. Be sure to follow NCES on TwitterFacebookLinkedIn, and YouTube and subscribe to the NCES News Flash to stay up-to-date!


By Megan Barnett, AIR

Knock, Knock! Who’s There? Understanding Who’s Counted in IPEDS

The Integrated Postsecondary Education Data System (IPEDS) is a comprehensive federal data source that collects information on key features of higher education in the United States, including characteristics of postsecondary institutions, college student enrollment and academic outcomes, and institutions’ employees and finances, among other topics.

The National Center for Education Statistics (NCES) has created a new resource page, Student Cohorts and Subgroups in IPEDS, that provides data reporters and users an overview of how IPEDS collects information related to postsecondary students and staff. This blog post highlights key takeaways from the resource page.

IPEDS survey components collect counts of key student and staff subgroups of interest to the higher education community.

Data users—including researchers, policy analysts, and prospective college students—may be interested in particular demographic groups within U.S. higher education. IPEDS captures data on a range of student and staff subgroups, including race/ethnicity, gender, age categories, Federal Pell Grant recipient status, transfer-in status, and part-time enrollment status.

The Outcome Measures (OM) survey component stands out as an example of how IPEDS collects student subgroups that are of interest to the higher education community. Within this survey component, all entering degree/certificate-seeking undergraduates are divided into one of eight subgroups by entering status (i.e., first-time or non-first-time), attendance status (i.e., full-time or part-time), and Pell Grant recipient status.

Although IPEDS is not a student-level data system, many of its survey components collect counts of students and staff by subgroup.

Many IPEDS survey components—such as Admissions, Fall Enrollment, and Human Resources—collect data as counts of individuals (i.e., students or staff) by subgroup (e.g., race/ethnicity, gender) (exhibit 1). Other IPEDS survey components—such as Graduation Rates, Graduation Rates 200%, and Outcome Measures—also include selected student subgroups but monitor cohorts of entering degree/certificate-seeking students over time to document their long-term completion and enrollment outcomes. A cohort is a specific group of students established for tracking purposes. The cohort year is based on the year that a cohort of students begins attending college.


Exhibit 1. IPEDS survey components that collect counts of individuals by subgroup

Table showing IPEDS survey components that collect counts of individuals by subgroup; column one shows the unit of information (student counts vs. staff counts); column two shows the survey component


IPEDS collects student and staff counts by combinations of interacting subgroups.

For survey components that collect student or staff counts, individuals are often reported in disaggregated demographic groups, which allows for more detailed understanding of specific subpopulations. For example, the Fall Enrollment (EF) and 12-month Enrollment (E12) survey components collect total undergraduate enrollment counts disaggregated by all possible combinations of students’ full- or part-time status, gender, degree/certificate-seeking status, and race/ethnicity. Exhibit 2 provides an excerpt of the EF survey component’s primary data collection screen (Part A), in which data reporters provide counts of students who fall within each demographic group indicated by the blank cells.


Exhibit 2. Excerpt of IPEDS Fall Enrollment (EF) survey component data collection screen for full-time undergraduate men: 2022­–23

[click image to enlarge]

Image of IPEDS Fall Enrollment survey component data collection screen for full-time undergraduate men in 2022–23

NOTE: This exhibit reflects the primary data collection screen (Part A) for the 2022–23 Fall Enrollment (EF) survey component for full-time undergraduate men. This screen is duplicated three more times for undergraduate students, once each for part-time men, full-time women, and part-time women. For survey materials for all 12 IPEDS survey components, including complete data collection forms and detailed reporting instructions, visit the IPEDS Survey Materials website.


As IPEDS does not collect data at the individual student level, these combinations of interacting subgroups are the smallest unit of information available in IPEDS. However, data users may wish to aggregate these smaller subgroups to arrive at larger groups that reflect broader populations of interest.

For example, using the information presented in exhibit 2, a data user could sum all the values highlighted in the green column to arrive at the total enrollment count of full-time, first-time men. As another example, a data user could sum all the values highlighted in the blue row to determine the total enrollment count of full-time Hispanic/Latino men. Note, however, that many IPEDS data products provide precalculated aggregated values (e.g., total undergraduate enrollment), but data are collected at these smaller units of information (i.e., disaggregated subgroup categories).

Student enrollment counts and cohorts align across IPEDS survey components.

There are several instances when student enrollment or cohort counts reported in one survey component should match or very closely mirror those same counts reported in another survey component. For example, the number of first-time degree/certificate-seeking undergraduate students in a particular fall term should be consistently reported in the Admissions (ADM) and Fall Enrollment (EF) survey components within the same data collection year (see letter A in exhibit 3).


Exhibit 3. Alignment of enrollment counts and cohorts across IPEDS survey components

Infographic showing the alignment of enrollment counts and cohorts across IPEDS survey components


For a full explanation of the alignment of student counts and cohorts across IPEDS survey components (letters A to H in exhibit 3), visit the Student Cohorts and Subgroups in IPEDS resource page.

Be sure to follow NCES on TwitterFacebookLinkedIn, and YouTube, follow IPEDS on Twitter, and subscribe to the NCES News Flash to stay up-to-date on IPEDS data releases and resources.


By Katie Hyland and Roman Ruiz, AIR

Trends in Graduate Student Loan Debt

Sixty percent of students who completed a master’s degree in 2015–16 had student loan debt, either from undergraduate or graduate school. Among those with student loan debt, the average balance was $66,000.[i] But there are many types of master’s degrees. How did debt levels vary among specific degree programs? And how have debt levels changed over time? You can find the answers, for both master’s and doctorate degree programs, in the Condition of Education 2018.

Between 1999–2000 and 2015–16, average student loan debt for master’s degree completers increased by:

  • 71 percent for master of education degrees (from $32,200 to $55,200),
  • 65 percent for master of arts degrees (from $44,000 to $72,800),
  • 39 percent for master of science degrees (from $44,900 to $62,300), and
  • 59 percent for “other” master’s degrees[ii] (from $47,200 to $75,100).

Average loan balances for those who completed master of business education degrees were higher in 2015–16 than in 1999–2000 ($66,300 vs. $47,400), but did not show a clear trend during this period.

Between 1999–2000 and 2015–16, average student loan debt for doctorate degree completers increased by:

  • 97 percent for medical doctorates (from $124,700 to $246,000),
  • 75 percent for other health science doctorates[iii] (from $115,500 to $202,400),
  • 77 percent for law degrees (from $82,400 to $145,500),
  • 104 percent for Ph.D.’s outside the field of education (from $48,400 to $98,800), and
  • 105 percent for “other (non-Ph.D.) doctorates[iv] (from $64,500 to $132,200).

While 1999–2000 data were unavailable for education doctorate completers, the average balance in 2015–16 ($111,900) was 66 percent higher than the average loan balance for education doctorate completers in 2003–04 ($67,300).

For more information, check out the full analysis in the Condition of Education 2018.


By Joel McFarland


[i] The average balances in this analysis exclude students with no student loans.

[ii] Includes public administration or policy, social work, fine arts, public health, and other.

[iii] Includes chiropractic, dentistry, optometry, pharmacy, podiatry, and veterinary medicine.

[iv] Includes science or engineering, psychology, business or public administration, fine arts, theology, and other.

Announcing the Condition of Education 2018 Release

We are pleased to present The Condition of Education 2018, a congressionally mandated annual report summarizing the latest data on education in the United States. This report is designed to help policymakers and the public monitor educational progress. This year’s report includes 47 indicators on topics ranging from prekindergarten through postsecondary education, as well as labor force outcomes and international comparisons. 

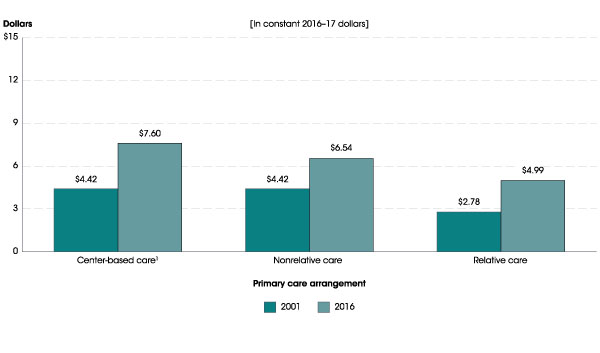
In addition to the regularly updated annual indicators, this year’s spotlight indicators highlight new findings from recent NCES surveys. The first spotlight indicator examines the choices and costs that families face as they select early childhood care arrangements. Drawing on data from the NCES National Household Education Survey, the indicator finds that early childhood care expenses were higher in 2016 than in 2001. For example, families’ average hourly out-of-pocket expenses for center-based care were 72 percent higher in 2016 ($7.60) than in 2001 ($4.42), in constant 2016–17 dollars. The indicator also finds that in 2016, some 57 percent of children under the age of 6 had parents who reported there were good choices for child care where they lived. Among children whose parents reported difficulty finding child care in 2016, some 32 percent cited cost as the primary reason. The complete indicator, Early Childhood Care Arrangements: Choices and Costs, contains more information about how these findings varied by family income, race/ethnicity, locale (urban, suburban, town, or rural), and children’s age.


Average hourly out-of-pocket child care expense for children under 6 years old and not yet in kindergarten whose families paid for child care, by primary type of child care arrangement: 2001 and 2016
1 Center-based arrangements include day care centers, Head Start programs, preschools, prekindergartens, and childhood programs.
NOTE: Estimates include only those children whose families paid at least part of the cost out of pocket for their child to receive nonparental care at least weekly.
SOURCE: U.S. Department of Education, National Center for Education Statistics, Early Childhood Program Participation Survey of the National Household Education Surveys Program (ECPP-NHES: 2001 and 2016). See Digest of Education Statistics 2017, table 202.30c.


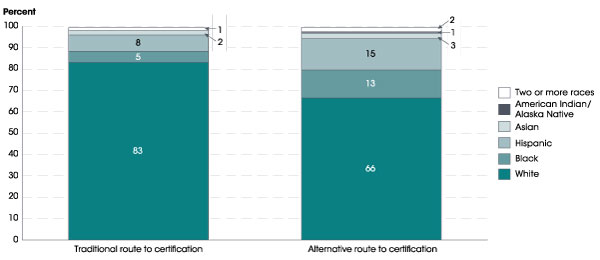
The second spotlight describes the characteristics of teachers who entered the teaching profession through an alternative route to certification program. Compared to those who entered through a traditional route, higher percentages of alternative route teachers in 2015–16 were Black (13 vs. 5 percent), Hispanic (15 vs. 8 percent), of Two or more races (2 vs. 1 percent), and male (32 vs. 22 percent), and lower percentages were White (66 vs. 83 percent). Overall, 18 percent of public school teachers in 2015–16 had entered teaching through an alternative route to certification program. The percentages were higher among those who taught career or technical education (37 percent), natural sciences (28 percent), foreign languages (26 percent), English as a second language (24 percent), math and computer science (22 percent), and special education (20 percent). The analysis also examines how the prevalence of alternative route teachers varies between charter schools and traditional public schools, between high and low poverty schools, and between schools that enroll high or low percentages of racial/ethnic minority students. For more findings from this analysis of data from the National Teacher and Principal Survey, see the complete indicator, Characteristics of Public School Teachers Who Completed Alternative Route to Certification Programs.


Percentage distribution of public elementary and secondary school teachers, by route to certification and race/ethnicity: 2015–16
NOTE: Teachers were asked whether they entered teaching through an alternative route to certification program, which is a program that was designed to expedite the transition of nonteachers to a teaching career (for example, a state, district, or university alternative route to certification program). Detail may not sum to totals because of rounding. Race categories exclude persons of Hispanic ethnicity. Data for American Indian/Alaska Native teachers who entered teaching through a traditional route and Pacific Islander teachers who entered teaching through traditional and alternative routes round to zero and are not displayed.
SOURCE: U.S. Department of Education, National Center for Education Statistics, National Teacher and Principal Survey (NTPS), “Public School Teacher Data File,” 2015–16. See Digest of Education Statistics 2017, table 209.24.


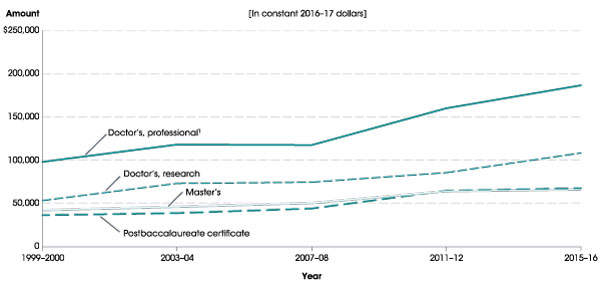
The third spotlight presents data on average student loan balances for students completing graduate degrees. Using data from the National Postsecondary Student Aid Study, this indicator examines how average student loan balances changed between 1999–2000 and 2015–16, and how those trends varied by degree type. Among graduate school completers who had student loans for undergraduate or graduate studies, average student loan balances increased for all degree types (in constant 2016–17 dollars). For example, average student loan balances for students who completed research doctorate degrees, such as a Ph.D., doubled during this time period, from $53,500 to $108,400 (an increase of 103 percent). Average student loan balances increased by 90 percent for those who completed professional doctorate degrees, such as medical doctorates and law degrees (from $98,200 to $186,600). The complete indicator, Trends in Student Loan Debt for Graduate School Completers, also describes how average student loan balances varied among specific degree programs, such as medical doctorates, law degrees, and master’s degrees in business administration.


Average cumulative student loan balance for graduate school completers, by degree type: Selected years, 1999–2000 through 2015–16
1 Includes chiropractic, dentistry, law, medicine, optometry, pharmacy, podiatry, and veterinary medicine. 
NOTE: Data refer to students who completed graduate degrees in the academic years indicated. Includes student loans for undergraduate and graduate studies. Average excludes students with no student loans.
SOURCE: U.S. Department of Education, National Center for Education Statistics, 1999–2000, 2003–04, 2007–08, 2011–12, and 2015–16 National Postsecondary Student Aid Study (NPSAS:2000, NPSAS:04, NPSAS:08, NPSAS:12, and NPSAS:16). See Digest of Education Statistics 2017, table 332.45.


The Condition includes an At a Glance section, which allows readers to quickly make comparisons within and across indicators, and a Highlights section, which captures key findings from each indicator. The report contains a Reader’s Guide, a Glossary, and a Guide to Sources that provide additional background information. Each indicator provides links to the source data tables used to produce the analyses.

As new data are released throughout the year, indicators will be updated and made available on The Condition of Education website. In addition, NCES produces a wide range of reports and datasets designed to help inform policymakers and the public. For more information on our latest activities and releases, please visit our website or follow us on Twitter, Facebook, and LinkedIn.

By James L. Woodworth, NCES Commissioner