IES Blog

Institute of Education Sciences

New Report Shows Increased Diversity in U.S. Schools, Disparities in Outcomes

The school-age population in the United States is becoming more racially and ethnically diverse. An NCES report released in February 2019, Status and Trends in the Education of Racial and Ethnic Groups 2018, examines how education experiences and outcomes vary among racial/ethnic groups. The report contains 36 indicators that cover preprimary to postsecondary education, as well as family background characteristics and labor force outcomes.

Between 2000 and 2017, the percentage of 5- to 17-year-olds who were White decreased from 62 to 51 percent, while the percentage who were Hispanic increased from 16 to 25 percent.


Figure 1. Percentage distribution of the U.S. resident population ages 5–17, by race/ethnicity: 2000 and 2017

# Rounds to zero.

NOTE: Data are for the resident population as of July 1 of the indicated year.

SOURCE: U.S. Department of Commerce, Census Bureau, 2000 Population Estimates, retrieved August 14, 2012, from http://www.census.gov/popest/data/national/asrh/2011/index.html; and 2017 Population Estimates, retrieved September 5, 2017, from https://www.census.gov/data/datasets/2016/demo/popest/nation-detail.html. See Digest of Education Statistics 2017, table 101.20.


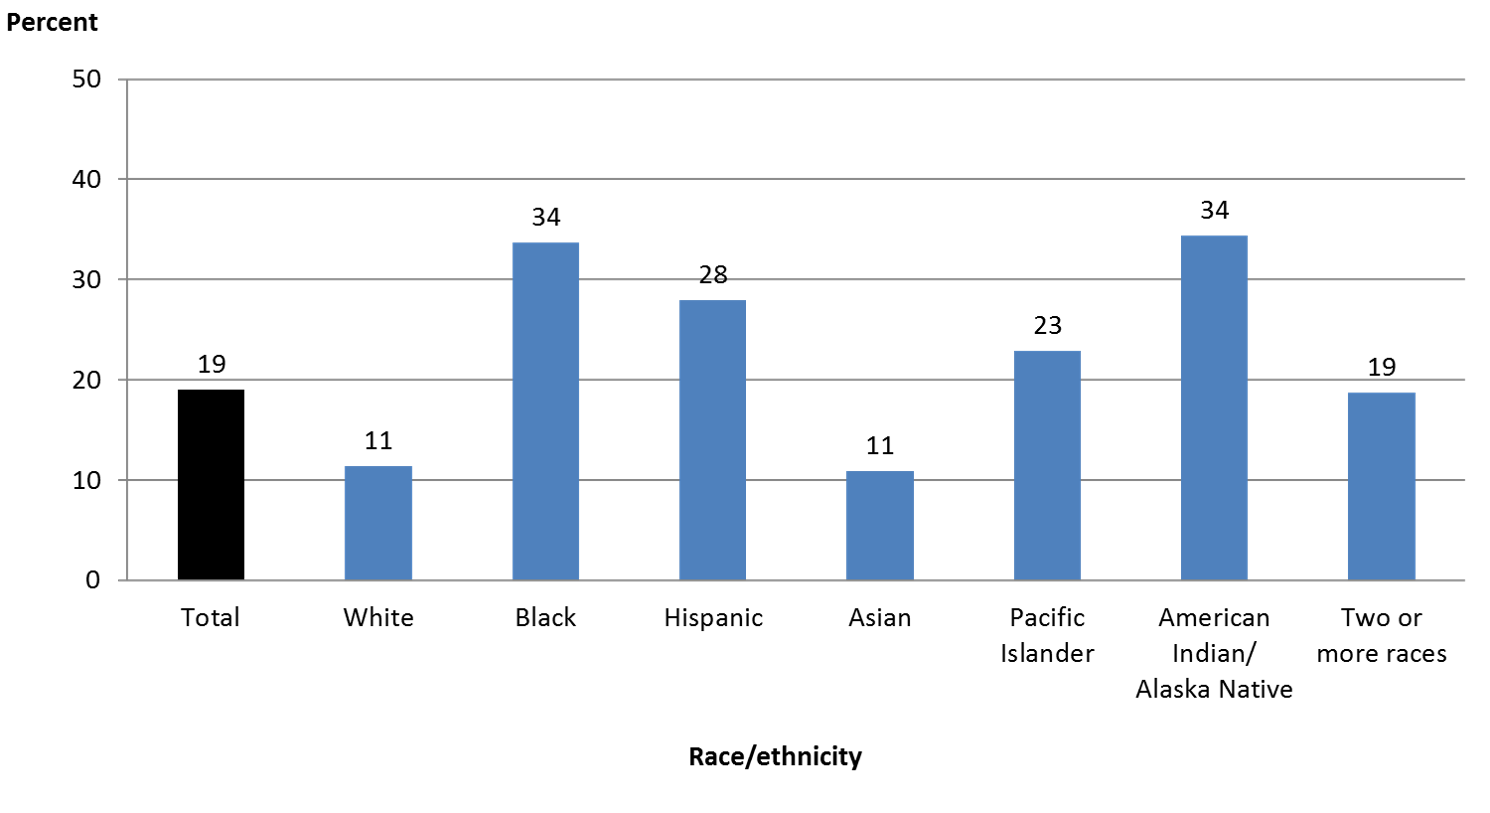
Prior research shows that living in poverty during early childhood is associated with lower-than-average academic performance that begins in kindergarten[1] and extends through high school, leading to lower-than-average rates of school completion.[2] In 2016, the percentages of children living in poverty were highest for Black and American Indian/Alaska Native children and lowest for White and Asian children.


Figure 2. Percentage of children under age 18 living in poverty, by race/ethnicity: 2016
NOTE: Data shown are based only on related children in a family; that is, all children in the household who are related to the householder by birth, marriage, or adoption (except a child who is the spouse of the householder).

SOURCE: U.S. Department of Commerce, Census Bureau, American Community Survey (ACS), 2016. See Digest of Education Statistics 2017, table 102.60.


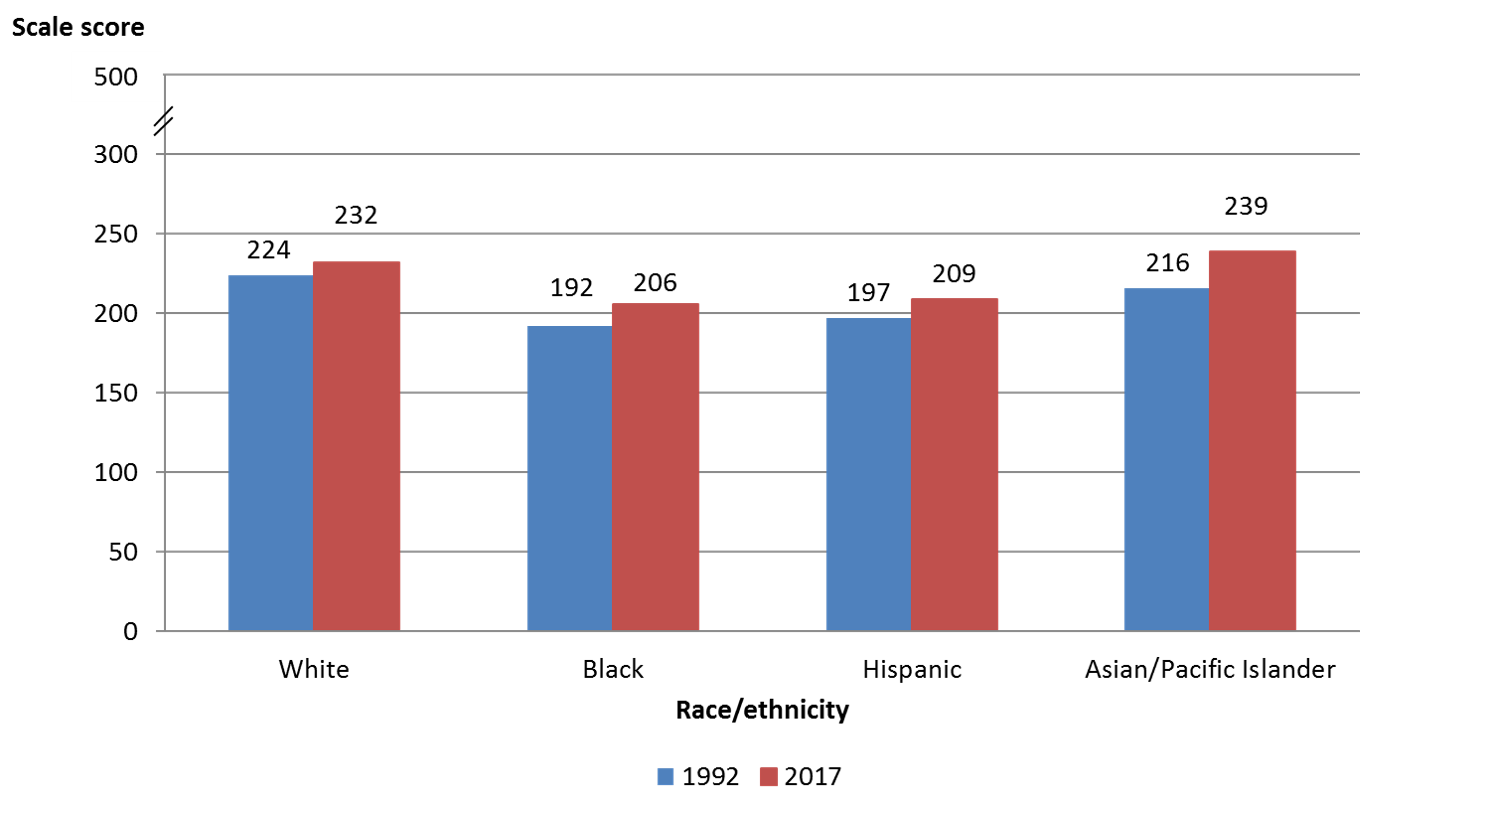
The National Assessment of Educational Progress (NAEP)—given to a representative sample of students across the United States—measures student performance over time in various subjects (including reading, math, and science) at grades 4, 8, and 12. Average grade 4 reading scores were higher in 2017 than in 1992 for the racial/ethnic groups with available data. Between 1992 and 2017, the White-Black score gap narrowed from 32 points in 1992 to 26 points in 2017. However, the White-Hispanic gap in 2017 was not measurably different from the corresponding gap in 1992.


Figure 3. Average National Assessment of Educational Progress (NAEP) reading scale scores of grade 4 students, by selected race/ethnicity: 1992 and 2017
NOTE: Includes public and private schools. Testing accommodations (e.g., extended time, small group testing) for children with disabilities and English language learners were not permitted in 1992.

SOURCE: U.S. Department of Education, National Center for Education Statistics, National Assessment of Educational Progress (NAEP), 1992 and 2017 Reading Assessments, NAEP Data Explorer. See Digest of Education Statistics 2017, table 221.10.


Looking at higher education, between 2000 and 2016, the largest changes in the racial/ethnic composition of undergraduate students were for White students and Hispanic students. The share of undergraduates who were White decreased from 70 to 56 percent, and the share who were Hispanic increased from 10 to 19 percent.


Figure 4. Percentage of total undergraduate student enrollment in degree-granting institutions, by race/ethnicity: Fall 2000 and fall 2016
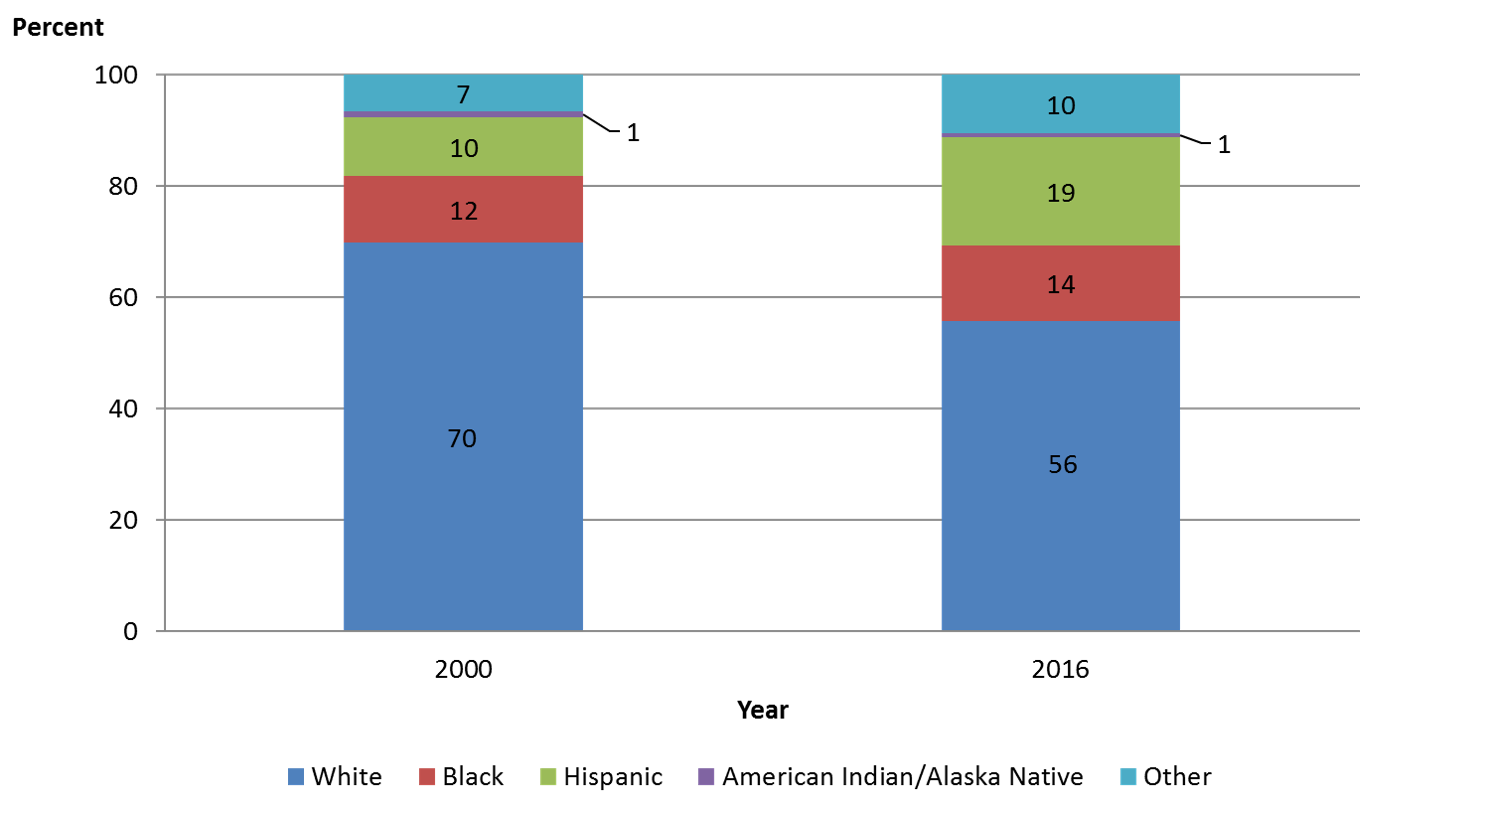
NOTE: Other includes Asian students, Pacific Islander students, and students of Two or more races.

SOURCE: U.S. Department of Education, National Center for Education Statistics, Integrated Postsecondary Education Data System (IPEDS), Spring 2001 and Spring 2017, Fall Enrollment component. See Digest of Education Statistics 2017, table 306.10.


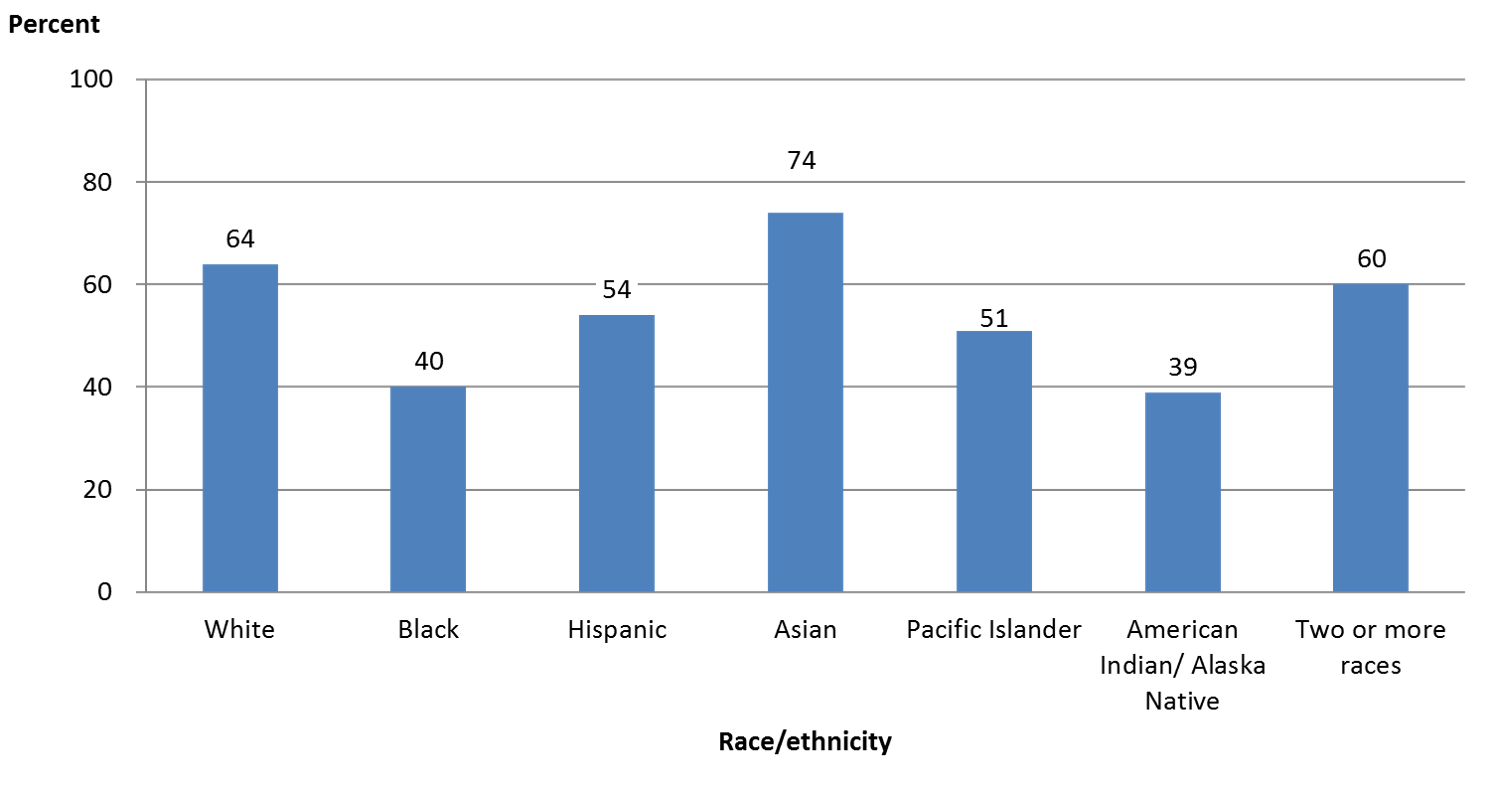
Postsecondary graduation rates vary widely by racial/ethnic group. For instance, among first-time students at 4-year institutions who enrolled in 2010, 74 percent of Asian students had graduated within 6 years. This was approximately 35 percentage points higher than the graduation rates for American Indian/Alaska Native students and Black students.   


Figure 5: Graduation rates within 6 years from first institution attended for first-time, full-time bachelor's degree-seeking students at 4-year postsecondary institutions, by race/ethnicity: Cohort entry year 2010
SOURCE: U.S. Department of Education, National Center for Education Statistics, Integrated Postsecondary Education Data System (IPEDS), Winter 2016–17, Graduation Rates component. See Digest of Education Statistics 2017, table 326.10.


The report also includes a new spotlight indicator, which highlights institutions that serve a large number of students from minority racial and ethnic groups. For instance, historically Black colleges and universities (HBCUs) are defined as “any historically Black college or university that was established prior to 1964, whose principal mission was, and is, the education of Black Americans.” In fall 2016, there were 102 HBCUs that enrolled over 292,000 students, 77 percent of whom were Black.


The spotlight also highlights other groups of minority-serving institutions—Hispanic-serving institutions, Tribally controlled colleges and universities, and Asian American and Native American Pacific Islander-serving institutions—describes how an institution is recognized as belonging to one of these groups, and discusses other institution characteristics, such as enrollment and degrees conferred.

For more information, visit the report’s website, where you can browse the indicators or download the full report


By Cris de Brey


[1] Mulligan, G.M., Hastedt, S., and McCarroll, J.C. (2012). First-Time Kindergartners in 2010–11: First Findings From the Kindergarten Rounds of the Early Childhood Longitudinal Study, Kindergarten Class of 2010–11 (ECLS-K:2011) (NCES 2012-049). U.S. Department of Education. Washington, DC: National Center for Education Statistics. Retrieved from https://nces.ed.gov/pubsearch/pubsinfo.asp?pubid=2012049.

[2] Ross, T., Kena, G., Rathbun, A., KewalRamani, A., Zhang, J., Kristapovich, P., and Manning, E. (2012). Higher Education: Gaps in Access and Persistence Study (NCES 2012-046). U.S. Department of Education. Washington, DC: National Center for Education Statistics. Retrieved from https://nces.ed.gov/pubsearch/pubsinfo.asp?pubid=2012046.

Guiding Principles for Successful Data Sharing Agreements

Data sharing agreements are critical to conducting research in education. They allow researchers to access data collected by state or local education agencies to examine trends, determine the effectiveness of interventions, and support agencies in their efforts to use research-based evidence in decision-making.

Yet the process for obtaining data sharing agreements with state or local agencies can be challenging and often depends on the type of data involved, state and federal laws and regulations regarding data privacy, and specific agency policies. Some agencies have a research application process and review timeline available on their websites. Others may have a more informal process for establishing such agreements. In all instances, these agreements determine how a researcher can access, use, and analyze education agency data.

What are some guiding principles for successfully obtaining data sharing agreements? 

Over several years of managing projects that require data sharing agreements, I have learned a few key principles for success. While they may seem obvious, I have witnessed data sharing agreements fall apart because one or more of these principles were not met:

  • Conduct research on a topic that is a priority for the state or local education agency. Given the time and effort agencies invest in executing a data sharing agreement and preparing data, researchers should design studies that provide essential information to the agency on a significant topic. It can be helpful to communicate exactly how and when the findings will be shared with the agency and possible actions that may result from the study findings.
  • Identify a champion within the agency. Data sharing agreements are often reviewed by some combination of program staff, legal counsel, Institutional Review Board staff, and research or data office staff. An agency staff member who champions the study can help navigate the system for a timely review and address any internal questions about the study. That champion can also help the researcher work with the agency staff who will prepare the data.
  • Be flexible and responsive. Agencies have different requirements for reviewing data sharing agreements, preparing and transferring data, securely handling data, and destroying data upon study completion. A data sharing agreement often requires some back-and-forth to finalize the terms. Researchers need to be prepared to work with their own offices and staff to meet the needs of the agency.
  • Work closely with the data office to finalize data elements and preparation. Researchers should be able to specify the sample, timeframe, data elements, and whether they require unique identifiers to merge data from multiple files. I have found it beneficial to meet with the office(s) responsible for preparing the data files in order to confirm any assumptions about the format and definitions of data elements. If the study requires data from more than one office, I recommend having a joint call to ensure that the process for pulling the data is clear and feasible to all staff involved. For example, to link student and teacher data, it might be necessary to have a joint call with the office that manages assessment data and the office that manages employment data.
  • Strive to reduce the burden on the agency. Researchers should make the process of sharing data as simple and efficient as possible for agency staff. Strategies include providing a template for the data sharing agreement, determining methods to de-identify data prior to transferring it, and offering to have the agency send separate files that the researchers can link rather than preparing the file themselves.
  • Start early. Data sharing agreements take a lot of time. Start the process as soon as possible because it always takes longer than expected. I have seen agreements executed within a month while others can take up to a year. A clear, jointly developed timeline can help ensure that the work starts on time.

What resources are available on data sharing agreements?

If you are new to data sharing agreements or want to learn more about them, here are some helpful resources:

Written by Jacqueline Zweig, Ph.D., Research Scientist, Education Development Center. Dr. Zweig is the Principal Investigator on an IES-funded research grant, Impact of an Orientation Course on Online Students' Completion Rates, and this project relies on data sharing. 

IES Research Centers are Hiring

IES is seeking professionals in education-related fields to apply for open positions in our Research Centers, National Center for Education Research (NCER) and the National Center for Special Education Research (NCSER). The Research Centers support research focused on practices and policies that improve education outcomes and access to education opportunities. Learn more about our work here: https://ies.ed.gov/ncer/ and here: https://ies.ed.gov/ncser/

If you are even potentially interested in this sort of position, we strongly encourage you to set up a profile in USAJobs (https://www.usajobs.gov/) and to upload your information now. As you build your profile, include all relevant research experience on your resume whether acquired in a paid or unpaid position. The positions will open in USAJobs on June 24, 2019 and will close as soon as 50 applications are received, or on July 8, 2019, whichever is earlier. Getting everything in can take longer than you might expect, so please apply as soon as the positions open in USAJobs (look for vacancy numbers IES-2019-0010 and IES-2019-2011).

Revenues and Expenditures for Public Schools Rebound for Third Consecutive Year in School Year 2015–16

Revenues and expenditures per pupil on elementary and secondary education increased in school year 2015–16 (fiscal year [FY] 2016), continuing a recent upward trend in the amount of money spent on public preK–12 education. This is the third consecutive year that per pupil revenues and expenditures have increased, reversing three consecutive years of declines in spending between FY 10 and FY 13 after adjusting for inflation. The findings come from the recently released Revenues and Expenditures for Public Elementary and Secondary School Districts: School Year 2015–16 (Fiscal Year 2016).


The national median of total revenues across all school districts was $12,953 per pupil in FY 16, reflecting an increase of 3.2 percent from FY 15, after adjusting for inflation.[1] This increase in revenues per pupil follows an increase of 2.0 percent for FY 15 and 1.6 percent for FY 14. These increases in revenues per pupil between FY 14 and FY 16 contrast with the decreases from FY 10 to FY 13. The national median of current expenditures per pupil was $10,881 in FY 16, reflecting an increase of 2.4 percent from FY 15. Current expenditures per pupil also increased in FY 15 (1.7 percent) and FY 14 (1.0 percent). These increases in median revenues and current expenditures per pupil between FY 14 and FY 16 represent a full recovery in education spending following the decreases from FY 10 to FY 13.

The school district finance data can help us understand differences in funding levels for various types of districts. For example, median current expenditures per pupil in independent charter school districts were lower than in noncharter and mixed charter/noncharter school districts in 21 out of the 25 states that were able to report finance data for independent charter school districts. Three of the 4 states where median current expenditures were higher for independent charter school districts had policies that affected charter school spending. The new School District Finance Survey (F-33) data offer researchers extensive opportunities to investigate local patterns of revenues and expenditures and how they relate to conditions for other districts across the country.


By Stephen Q. Cornman, NCES; Malia Howell, Stephen Wheeler, and Osei Ampadu, U.S. Census Bureau; and Lei Zhou, Activate Research


[1] In order to compare from one year to the next, revenues are converted to constant dollars, which adjusts figures for inflation. Inflation adjustments use the Consumer Price Index (CPI) published by the U.S. Department of Labor, Bureau of Labor Statistics. For comparability to fiscal education data, NCES adjusts the CPI from a calendar year basis to a school fiscal year basis (July through June). See Digest of Education Statistics 2016, table 106.70, https://nces.ed.gov/programs/digest/d16/tables/dt16_106.70.asp.