IES Blog

Institute of Education Sciences

Measuring Student Safety: New Data on Bullying Rates at School

NCES is committed to providing reliable and up-to-date national-level estimates of bullying. As such, a new set of web tables focusing on bullying victimization at school was just released.  

These tables use data from the School Crime Supplement to the National Crime Victimization Survey, which collects data on bullying by asking a nationally representative sample of students ages 12–18 who were enrolled in grades 6–12 in public and private schools if they had been bullied at school. This blog post highlights data from these newly released web tables.

Some 19 percent of students reported being bullied during the 2021–22 school year. More specifically, bullying was reported by 17 percent of males and 22 percent of females and by 26 percent of middle school students and 16 percent of high school students. Moreover, among students who reported being bullied, 14 percent of males and 28 percent of females reported being bullied online or by text.

Students were also asked about the recurrence and perpetrators of bullying and about the effects bullying has on them. During the 2021–22 school year, 12 percent of students reported that they were bullied repeatedly or expected the bullying to be repeated and that the bullying was perpetrated by someone who was physically or socially more powerful than them and who was not a sibling or dating partner. When these students were asked about the effects this bullying had on them,

  • 38 percent reported negative feelings about themselves;
  • 27 percent reported negative effects on their schoolwork;
  • 24 percent reported negative effects on their relationships with family and friends; and
  • 19 percent reported negative effects on their physical health.

Explore the web tables for more data on how bullying victimization varies by student characteristics (e.g., sex, race/ethnicity, grade, household income) and school characteristics (e.g., region, locale, enrollment size, poverty level) and how rates of bullying victimization vary by crime-related variables such as the presence of gangs, guns, drugs, alcohol, and hate-related graffiti at school; selected school security measures; student criminal victimization; personal fear of attack or harm; avoidance behaviors; fighting; and the carrying of weapons.

Find additional information on this topic in the Condition of Education indicator Bullying at School and Electronic Bullying. Plus, explore more School Crime and Safety data and browse the Report on Indicators of School Crime and Safety: 2022.

Highlights From the FY 21 Revenues and Expenditures for Public Elementary and Secondary Education Report

NCES recently released a finance tables report, Revenues and Expenditures for Public Elementary and Secondary Education: FY 21 (NCES 2023-301), which draws from data in the National Public Education Financial Survey (NPEFS). To accompany the report, NCES has updated the interactive data visualization tool to highlight the per pupil revenues and expenditures (adjusted for inflation) and average daily attendance (ADA) trends from the fiscal year 2021 (FY 21) NPEFS.

This tool allows users to see national or state-specific per pupil amounts and year-to-year percentage changes for both total revenue and current expenditures by using a slider to toggle between the two variables. Total revenues are shown by source, and total current expenditures are shown by function and subfunction. Clicking on a state in the map will display data for the selected state in the bar charts.

The tool also allows users to see the ADA for each state. It is sortable by state, ADA amount, and percentage change. It may also be filtered to easily compare selected states. Hovering over the ADA of a state will display another bar graph with the last 3 years of ADA data.

Overall, the results show that spending1 on elementary and secondary education increased in school year 2020–21 (FY 21). This is the eighth consecutive year that year-over-year education spending increased (since FY 13), after adjusting for inflation. This increase follows declines in year-over-year spending for the prior 4 years (FY 10 through FY 13).


Revenues

The 50 states and the District of Columbia reported $837.3 billion in revenues collected for public elementary and secondary education in FY 21. State and local governments provided $748.9 billion, or 89.4 percent of all revenues. The federal government contributed $88.4 billion, or 10.6 percent of all revenues. Total revenues increased by 3.0 percent after adjusting for inflation2 (from $812.8 to $837.3 billion) from FY 20 to FY 21; local revenues remained relatively unchanged (from $365.1 to $365.1 billion); state revenues decreased by 0.6 percent (from $385.9 to $383.8 billion); and federal revenues increased by 43.2 percent (from $61.8 to $88.4 billion).

Total revenues per pupil averaged $17,015 on a national basis in FY 21. This reflects an increase of 5.9 percent between FY 20 and FY 21 and follows an increase of 1.5 percent from FY 19 to FY 20. The percentage change in revenues per pupil from FY 20 to FY 21 ranged from an increase of 15.3 percent in Maine to a decrease of 4.2 percent in Hawaii.


Image of NPEFS data visualization site showing revenues per pupil for public elementary and secondary schools in FY 20 and FY 21


Revenues from COVID-19 Federal Assistance Funds for public elementary and secondary education totaled $25.3 billion, or 28.6 percent of all federal revenues.

  • Revenues from the Federal Coronavirus Relief Fund accounted for $8.9 billion, or 35.2 percent of total revenues from COVID-19 Federal Assistance Funds.
     
  • Revenues from the Elementary and Secondary School Emergency Relief (ESSER I) Fund accounted for $8.5 billion, or 33.7 percent of total revenues from COVID-19 Federal Assistance Funds.
     
  • Revenues from the Elementary and Secondary School Emergency Relief (ESSER II) Fund accounted for $6.5 billion, or 25.8 percent of total revenues from COVID-19 Federal Assistance Funds.


Expenditures

Current expenditures for public elementary and secondary education across the nation increased by 0.7 percent between FY 20 and FY 21 (from $698.3 to $703.5 billion). Within that increase, expenditures for instruction increased by 1.1 percent between FY 20 and FY 21 (from $422.4 to $427.1 billion), and student support expenditures increased by 3.6 percent between FY 20 and FY 21 (from $44.0 to $45.6 billion).

Current expenditures per pupil for the day-to-day operation of public elementary and secondary schools was $14,295 in FY 21, an increase of 3.5 percent from FY 20.3 In FY 21, education spending was 16.7 percent higher than at the lowest point of the Great Recession in FY 13.


Figure 1. National inflation-adjusted current expenditures per public for public elementary and secondary education: Fiscal years 2012 through 2021


NOTE: Spending is reported in constant FY 21 dollars, based on the Consumer Price Index (CPI). National totals include the 50 states and the District of Columbia. California did not report prekindergarten membership in the State Nonfiscal Survey of Public Elementary/Secondary Education. California reported prekindergarten expenditures separately, and these expenditures were excluded from the amounts reported in this figure.
SOURCE: U.S. Department of Education, National Center for Education Statistics, Common Core of Data (CCD), “National Public Education Financial Survey,” fiscal years 2012 through 2020, Final Version 2a; and fiscal year 2021, Provisional Version 1a; and Digest of Education Statistics 2021, table 106.75. Retrieved March 9, 2023, from nces.ed.gov/programs/digest/d21/tables/dt21_106.75.asp.


Without making adjustments for geographic cost differences, current expenditures per pupil ranged from $9,014 in Utah to $26,097 in New York. In addition to New York, current expenditures per pupil were highest in the District of Columbia ($25,113), Vermont ($24,050), New Jersey ($22,784), and Connecticut ($22,216). In addition to Utah, current expenditures per pupil were lowest in Idaho ($9,054), Arizona ($9,571), Mississippi ($10,060), and Nevada ($10,073). The states with the largest increases in current expenditures per pupil from FY 20 to FY 21 were Maine (11.9 percent), Arizona (7.6 percent), Montana (7.4 percent), Louisiana (7.3 percent), and Massachusetts (6.6 percent).


Image of NPEFS data visualization site showing current expenditures per pupil for public elementary and secondary schools in FY 20 and FY 21


In FY 21, salaries and wages ($389.2 billion) in conjunction with employee benefits ($169.7 billion) accounted for 79.4 percent ($558.8 billion) of current expenditures for public elementary and secondary education. Expenditures for instruction and instructional staff support services comprised 65.8 percent ($462.9 billion) of total current expenditures.

Between FY 20 and FY 21, total expenditures increased by 0.2 percent (from $812.3 to $813.6 billion). Of the $813.6 billion in total expenditures in FY 21, 86.5 percent were current expenditures, 9.8 percent were capital outlay expenditures, 2.7 percent were interest on debt, and 1.1 percent were expenditures for other programs.

Current expenditures from federal Title I grants for economically disadvantaged students (including carryover expenditures) accounted for $16.3 billion, or 2.3 percent of current expenditures for public elementary and secondary education at the national level in FY 21. Nationally, Title I expenditures per pupil averaged $331 and ranged from $123 in Utah to $874 in New York.

Current expenditures paid from COVID-19 Federal Assistance Funds for public elementary and secondary education totaled $24.2 billion for the 50 states and the District of Columbia. Of these, instructional expenditures accounted for $13.7 billion, or 56.5 percent of current expenditures paid from COVID-19 Federal Assistance Funds, and support services expenditures accounted for $9.1 billion, or 37.6 percent of current expenditures paid from COVID-19 Federal Assistance Funds.

To explore data on public elementary and secondary revenues, expenditures, and ADA, check out our new data visualization tool.

Be sure to follow NCES on TwitterFacebookLinkedIn, and YouTube and subscribe to the NCES News Flash to stay up-to-date on the latest from the National Public Education Financial Survey.


By Stephen Q. Cornman, NCES, and Malia Howell and Jeremy Phillips, U.S. Census Bureau


[1] Spending refers to current expenditures. Current expenditures are composed of expenditures for the day-to-day operation of schools and school districts for public elementary and secondary education, including expenditures for staff salaries and benefits, supplies, and purchased services. Current expenditures include instruction, instruction-related, support services (e.g., social work, health, and psychological services), and other elementary/secondary current expenditures but exclude expenditures on capital outlay, other programs, and interest on long-term debt.

[2] Throughout this blog post, all comparisons between years are adjusted for inflation by converting the figures to constant dollars. Inflation adjustments utilize the Consumer Price Index (CPI) published by the U.S. Department of Labor, Bureau of Labor Statistics. For comparability to fiscal education data, NCES adjusts the CPI from a calendar year to a school fiscal year basis (July through June). See Digest of Education Statistics 2021, table 106.70.

[3] Per pupil expenditures are calculated using student membership derived from the State Nonfiscal Survey of Public Elementary/Secondary Education. In some states, adjustments are made to ensure consistency between membership and reported fiscal data. More information on these adjustments can be found in the data file documentation.

Rescaled Data Files for Analyses of Trends in Adult Skills

In January 2022, NCES released the rescaled data files for three adult literacy assessments conducted several decades earlier: the 1992 National Adult Literacy Survey (NALS), the 1994 International Adult Literacy Survey (IALS), and the 2003 Adult Literacy and Lifeskills Survey (ALL). By connecting the rescaled data from these assessments with data from the current adult literacy assessment, the Program for the International Assessment of Adult Competencies (PIAAC), researchers can examine trends on adult skills in the United States going back to 1992. This blog post traces the history of each of these adult literacy assessments, describes the files and explains what “rescaling” means, and discusses how these files can be used in analyses in conjunction with the PIAAC files. The last section of the post offers several example analyses of the data.

A Brief History of International and National Adult Literacy Assessments Conducted in the United States

The rescaled data files highlighted in this blog post update and combine historical data from national and international adult literacy studies that have been conducted in the United States.

NALS was conducted in 1992 by NCES and assessed U.S. adults in households, as well as adults in prisons. IALS—developed by Statistics Canada and ETS in collaboration with 22 participating countries, including the United States—assessed adults in households and was administered in three waves between 1994 and 1998. ALL was administered in 11 countries, including the United States, and assessed adults in two waves between 2003 and 2008.

PIAAC seeks to ensure continuity with these previous surveys, but it also expands on their quality assurance standards, extends the definitions of literacy and numeracy, and provides more information about adults with low levels of literacy by assessing reading component skills. It also, for the first time, includes a problem-solving domain to emphasize the skills used in digital (originally called “technology-rich”) environments.

How Do the Released Data Files From the Earlier Studies of Adult Skills Relate to PIACC?

All three of the released restricted-use data files (for NALS, IALS, and ALL) relate to PIAAC, the latest adult skills assessment, in different ways.

The NALS data file contains literacy estimates and background characteristics of U.S. adults in households and in prisons in 1992. It is comparable to the PIAAC data files for 2012/14 and 2017 through rescaling of the assessment scores and matching of the background variables to those of PIAAC.

The IALS and ALL data files contain literacy (IALS and ALL) and numeracy (ALL) estimates and background characteristics of U.S. adults in 1994 (IALS) and 2003 (ALL). Similar to NALS, they are comparable to the PIAAC restricted-use data (2012/14) through rescaling of the literacy and numeracy assessment scores and matching of the background variables to those of PIAAC. These estimates are also comparable to the international estimates of skills of adults in several other countries, including in Canada, Hungary, Italy, Norway, the Netherlands, and New Zealand (see the recently released Data Point International Comparisons of Adult Literacy and Numeracy Skills Over Time). While the NCES datasets contain only the U.S. respondents, IALS and ALL are international studies, and the data from other participating countries can be requested from Statistics Canada (see the IALS Data Files/Publications and ALL Data pages for more detail). See the History of International and National Adult Literacy Assessments page for additional background on these studies. 

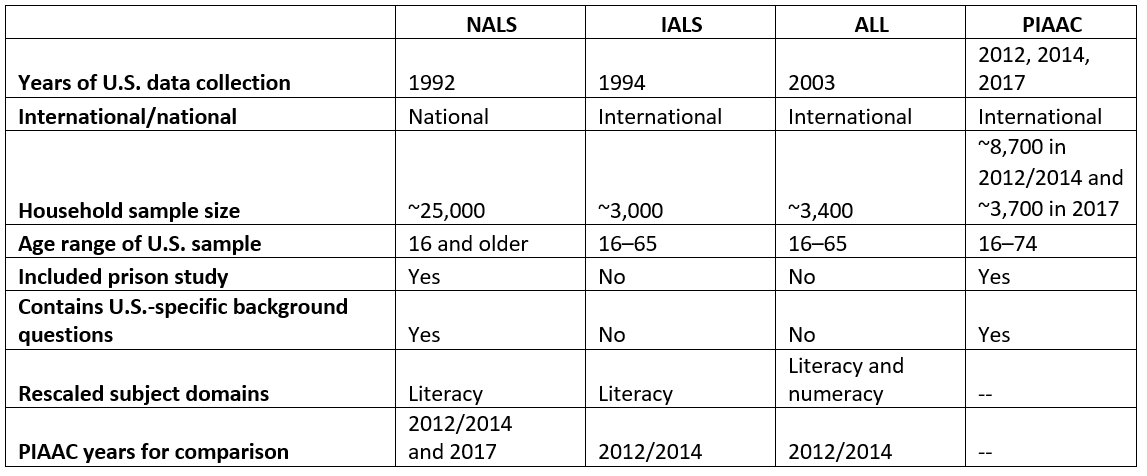
Table 1 provides an overview of the rescaled NALS, IALS, and ALL data files.


Table 1. Overview of the rescaled data files for the National Adult Literacy Survey (NALS), International Adult Literacy Survey (IALS), and Adult Literacy and Lifeskills Survey (ALL) 

Table showing overview of the rescaled data files for the National Adult Literacy Survey (NALS), International Adult Literacy Survey (IALS), and Adult Literacy and Lifeskills Survey


What Does “Rescaled” Mean?

“Rescaling” the literacy (NALS, IALS, ALL) and numeracy (ALL) domains from these three previous studies means that the domains were put on the same scale as the PIAAC domains through the derivation of updated estimates of proficiency created using the same statistical models used to create the PIAAC skills proficiencies. Rescaling was possible because PIAAC administered a sufficient number of the same test questions used in NALS, IALS, and ALL.1 These rescaled proficiency estimates allow for trend analysis of adult skills across the time points provided by each study.

What Can These Different Files Be Used For?

While mixing the national and international trend lines isn’t recommended, both sets of files have their own distinct advantages and purposes for analysis.

National files

The rescaled NALS 1992 files can be used for national trend analyses with the PIAAC national trend points in 2012/2014 and 2017. Some potential analytic uses of the NALS trend files are to

  • Provide a picture of the skills of adults only in the United States;
  • Examine the skills of adults in prison and compare their skills with those of adults in households over time, given that NALS and PIAAC include prison studies conducted in 1992 and 2014, respectively;
  • Conduct analyses on subgroups of the population (such as those ages 16–24 or those with less than a high school education) because the larger sample size of NALS allows for more detailed breakdowns along with the U.S. PIAAC sample;
  • Focus on the subgroup of older adults (ages 66–74), given that NALS sampled adults over the age of 65, similar to PIAAC, which sampled adult ages 16–74; and
  • Analyze U.S.-specific background questions (such as those on race/ethnicity or health-related practices).

International files

The rescaled IALS 1994 and ALL 2003 files can be used for international trend analyses among six countries with the U.S. PIAAC international trend point in 2012/2014: Canada, Hungary, Italy, Norway, the Netherlands, and New Zealand. Some potential analytic uses of the IALS and ALL trend files are to

  • Compare literacy proficiency results internationally and over time using the results from IALS, ALL, and PIAAC; and
  • Compare numeracy proficiency results internationally and over time using the results from ALL and PIAAC.

Example Analyses Using the U.S. Trend Data on Adult Literacy

Below are examples of a national trend analysis and an international trend analysis conducted using the rescaled NALS, IALS, and ALL data in conjunction with the PIAAC data.

National trend estimates

The literacy scores of U.S. adults increased from 269 in NALS 1992 to 272 in PIAAC 2012/2014. However, the PIAAC 2017 score of 270 was not significantly different from the 1992 or 2012/2014 scores.


Figure 1. Literacy scores of U.S. adults (ages 16–65) along national trend line: Selected years, 1992–2017

Line graph showing literacy scores of U.S. adults (ages 16–65) along national trend line for NALS 1992, PIAAC 2012/2014, and PIAAC 2017

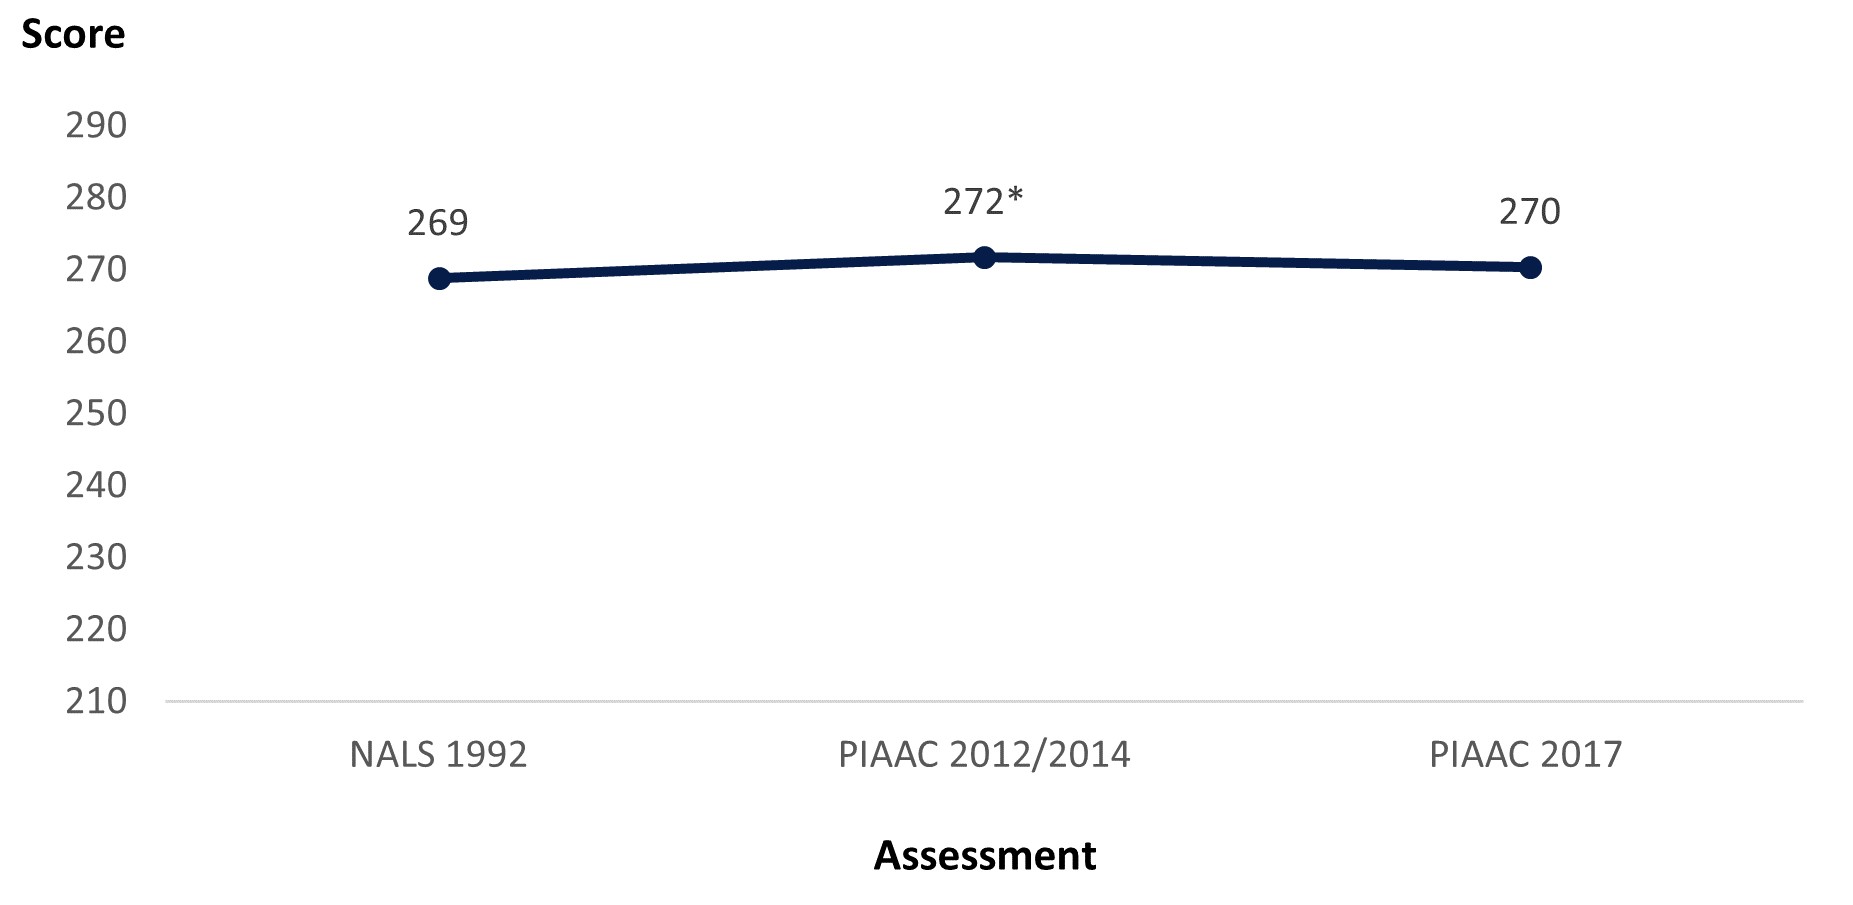
* Significantly different (p < .05) from NALS 1992 estimate.
SOURCE: U.S. Department of Education, National Center for Education Statistics, National Adult Literacy Survey (NALS), NALS 1992; and Program for the International Assessment of Adult Competencies (PIAAC), PIAAC 2012–17.


International trend estimates

The literacy scores of U.S. adults decreased from 273 in IALS 1994 to 268 in ALL 2003 before increasing to 272 in PIAAC 2012/2014. However, the PIAAC 2012/2014 score was not significantly different from the IALS 1994 score.


Figure 2. Literacy scores of U.S. adults (ages 16–65) along international trend line: Selected years, 1994–2012/14

Line graph showing literacy scores of U.S. adults (ages 16–65) along international trend line for IALS 1994, ALL 2003, and PIAAC 2012/2014

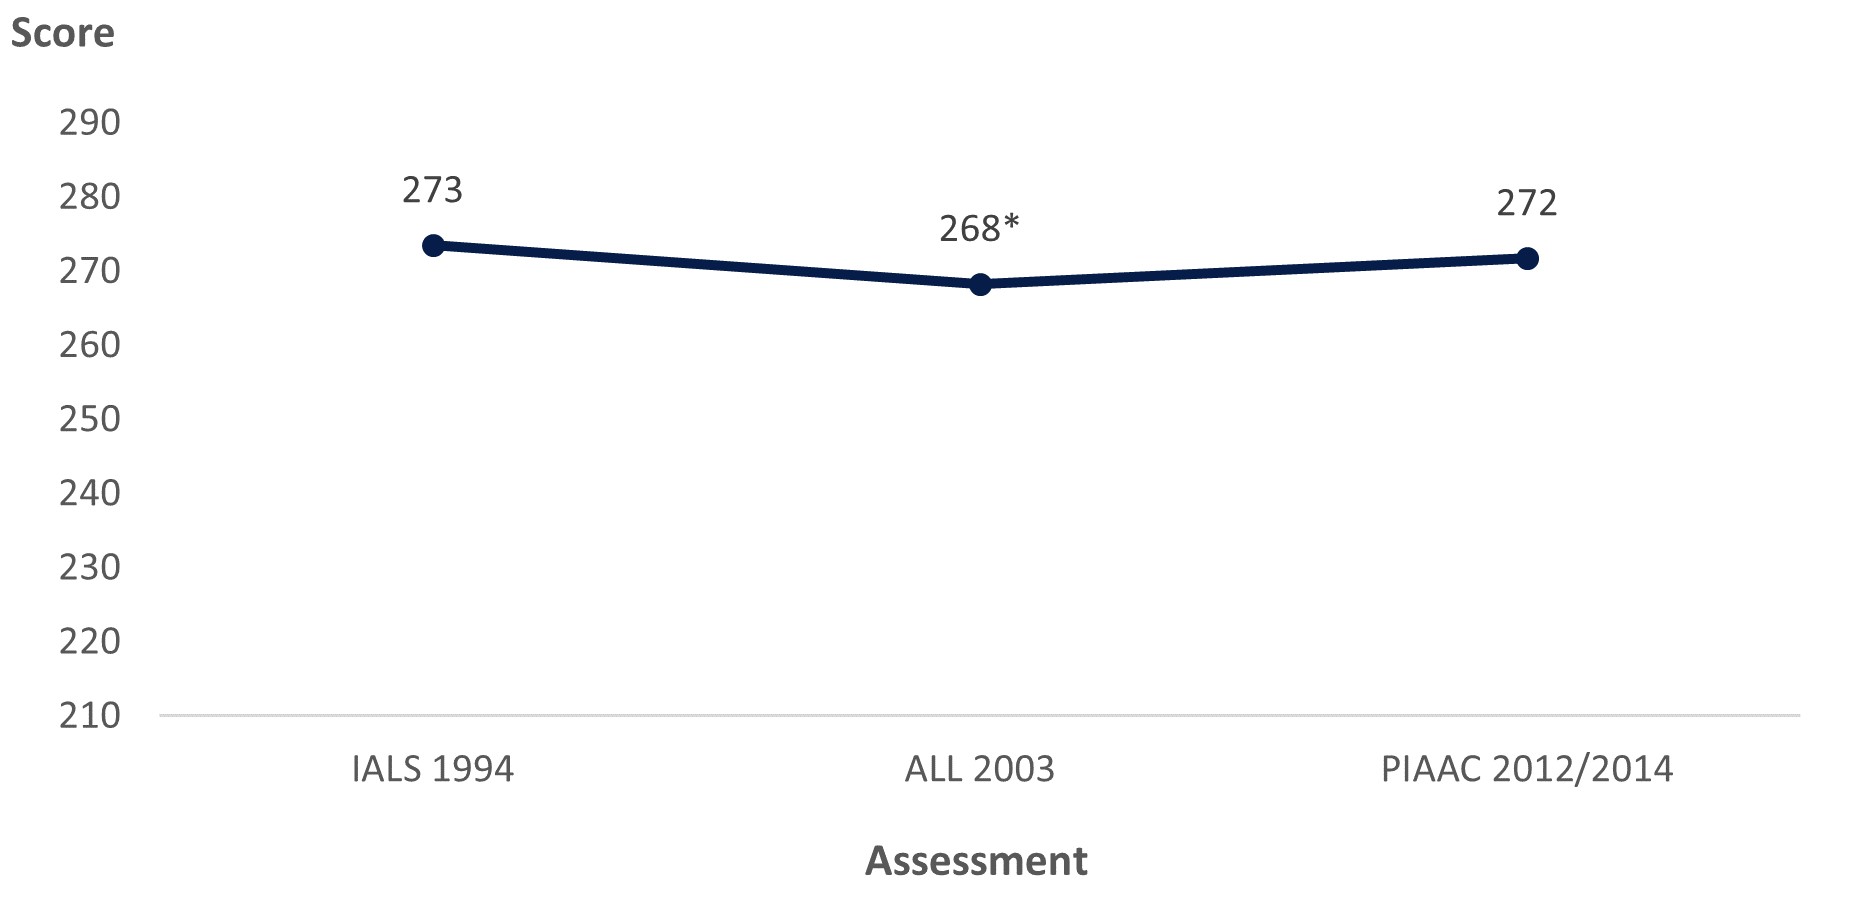
* Significantly different (p < .05) from IALS 1994 estimate.
SOURCE: U.S. Department of Education, National Center for Education Statistics, Statistics Canada and Organization for Economic Cooperation and Development (OECD), International Adult Literacy Survey (IALS), 1994–98; Adult Literacy and Lifeskills Survey (ALL), 2003–08; and Program for the International Assessment of Adult Competencies (PIAAC), PIAAC 2012/14. See figure 1 in the International Comparisons of Adult Literacy and Numeracy Skills Over Time Data Point.


How to Access the Rescaled Data Files

More complex analyses can be conducted with the NALS, IALS, and ALL rescaled data files. These are restricted-use files and researchers must obtain a restricted-use license to access them. Further information about these files is available on the PIAAC Data Files page (see the “International Trend Data Files and Data Resources” and “National Trend Data Files and Data Resources” sections at the bottom of the page).

Additional resources:

By Emily Pawlowski, AIR, and Holly Xie, NCES


[1] In contrast, the 2003 National Assessment of Adult Literacy (NAAL), another assessment of adult literacy conducted in the United States, was not rescaled for trend analyses with PIAAC. For various reasons, including the lack of overlap between the NAAL and PIAAC literacy items, NAAL and PIAAC are thought to be the least comparable of the adult literacy assessments.

New Report on the Effects of the Coronavirus Pandemic on Undergraduate Student Experiences in Spring 2020

NCES recently released a report on the experiences of undergraduate students early in the COVID-19 pandemic. The report uses early release data from the 2019–20 National Postsecondary Student Aid Study (NPSAS:20) to describe how the pandemic disrupted students’ enrollment, housing, and finances in the spring of 2020. It also discusses how institutions helped students with these issues.

NPSAS:20 student surveys started in March 2020, and items about the COVID-19 pandemic were added in April 2020 to collect information about the effects of the pandemic on students’ educational experiences between January 1 and June 30, 2020. These early release data do not include students who answered before the pandemic questions were added. The data show that 87 percent of students had their enrollment disrupted or changed during this time. Students who experienced disruptions may have withdrawn or taken a leave of absence, had an extended school break, had changes made to their study-abroad program, or had classes cancelled or moved online.

Twenty-eight percent of students had a housing disruption or change, and 40 percent had a financial disruption or change. Students who had a housing disruption had to move or had difficulty finding safe and stable housing. Students who had a financial disruption may have lost a job or income or may have had difficulty getting food; they may have also received financial help from their postsecondary institutions.

The report also provides information about the experiences of students with different characteristics. For example, students with Pell Grants had a similar rate of enrollment disruption (87 percent) as those without them (88 percent). Those with Pell Grants had a lower rate of housing disruption (23 percent) than those without them (31 percent). However, they had a higher rate of financial disruption (48 percent) than their peers without Pell Grants (34 percent).


Figure 1. Percentage of undergraduates who experienced enrollment, housing, or financial disruptions or changes at their institution due to the COVID-19 pandemic, by Pell Grant recipient status: Spring 2020

SOURCE: U.S. Department of Education, National Center for Education Statistics, 2019–20 National Postsecondary Student Aid Study (NPSAS:20, preliminary data).


The final NPSAS:20 raw data will be available in late 2022. Sign up for the IES Newsflash to receive announcements about NCES data products.


By Tracy Hunt-White

New Data Reveal Public School Enrollment Decreased 3 Percent in 2020–21 School Year

NCES recently released revised Common Core of Data (CCD) Preliminary Files, which are the product of the school year (SY) 2020–21 CCD data collection. CCD, the Department of Education’s primary database on public elementary and secondary education in the United States, provides comprehensive annual data on enrollment, school finances, and student graduation rates.

Here are a few key takeaways from the newly released data files:

Public school enrollment in SY 2020–21 was lower than it was in SY 2019–20.

Overall, the number of students enrolled in public schools decreased by 3 percent from SY 2019–20 to SY 2020–21. Note that Illinois did not submit data in time to be included in this preliminary report. The SY 2019–20 and SY 2020–21 total enrollment counts for California, Oregon, American Samoa, and the Bureau of Indian Education do not include prekindergarten counts.

The rate of decline in public school enrollment in SY 2020–21 was not consistent across all states.

Within states, the largest decreases were in Mississippi and Vermont (5 percent each), followed by Washington, New Mexico, Kentucky, New Hampshire, and Maine (each between 4 and 5 percent) (figure 1). Eighteen states had decreases of 3 percent or more; 29 states had decreases between 1 and 3 percent; and the District of Columbia, South Dakota, and Utah had changes of less than 1 percent.


Lower grade levels experienced a greater rate of decline in public school enrollment than did higher grade levels in SY 2020–21.

Public school enrollment decreased by 13 percent for prekindergarten and kindergarten and by 3 percent for grades 1–8. Public school enrollment increased by 0.4 percent for grades 9–12.

Most other jurisdictions experienced declines in public school enrollment in SY 2020–21.

Public school enrollment decreased in Puerto Rico (6 percent), Guam (5 percent), and American Samoa (2 percent). The Virgin Islands, however, experienced an increase of less than 1 percent.

To access the CCD preliminary data files and learn more about public school enrollment in SY 2020–21, visit the CCD data files webpage.