Spending on elementary and secondary education increased in school year 2015–16 (Fiscal Year 2016). At the national level, education spending has recovered from the economic downturn between 2009 and 2013. This is the third consecutive year spending increased, reversing a decline in spending for the prior four years after adjusting for inflation. These findings come from a recently released report from the National Center for Education Statistics (NCES).
The First Look report, Revenues and Expenditures for Public Elementary and Secondary Education: School Year 2015–16 (Fiscal Year 2016) is based on data from the National Public Education Finance Survey (NPEFS), a component of the Common Core of Data (CCD).
The amount spent per student for the day-to-day operation of public elementary and secondary schools rose to $11,841 in Fiscal Year (FY) 16.[1] Current expenditures per student increased by 2.9 percent between FY 15 and 16, following on the heels of an increase of 3.2 percent from the prior year, after adjusting for inflation.[2] Although spending per student was higher in FY 16 than in FY 07, it had decreased each year from FY 09 to FY 13.
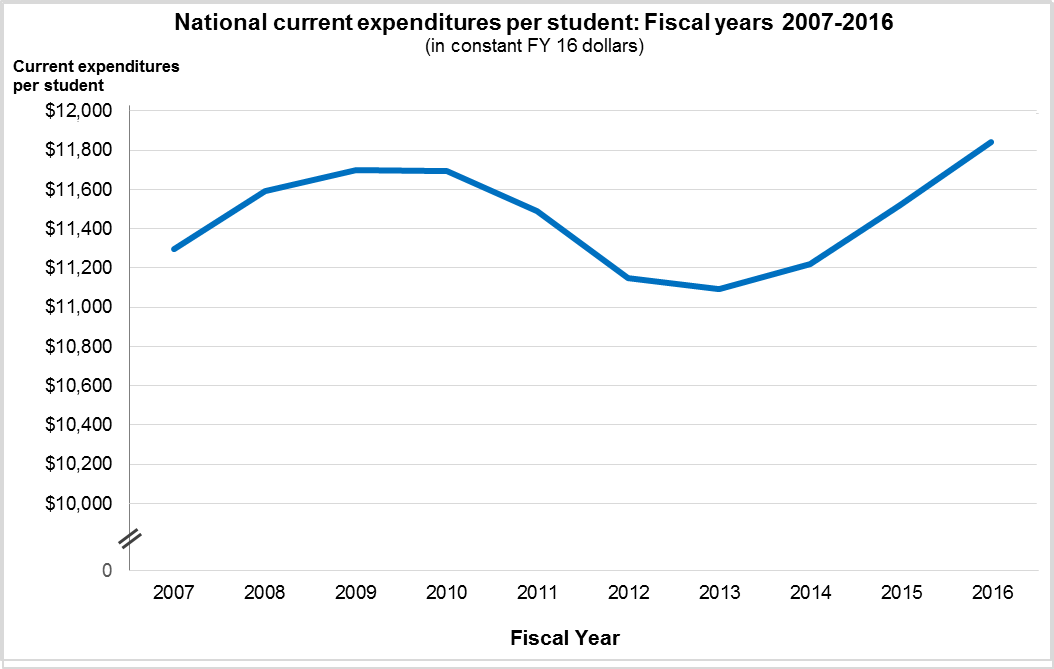
NOTE: Spending is reported in constant FY 16 dollars, based on the Consumer Price Index (CPI).
SOURCE: U.S. Department of Education, National Center for Education Statistics, Common Core of Data (CCD), "National Public Education Financial Survey," fiscal years 2007 through 2016.
Salaries and wages make up the largest proportion of current expenditures, but have increased at a much slower rate than employee benefits or other expenditures.[3] After peaking at $7,047 per pupil in FY 09, salaries and wages declined to a low of $6,452 per pupil in FY 2013, and increased to $6,748 per pupil in FY 16.
The proportion of salaries and wages in current expenditures per pupil decreased from 60.2 percent in FY 09 to 57.0 in FY 16. In contrast, the proportion of employee benefits in current expenditures per pupil increased from 20.4 percent in FY 09 to 22.9 percent in FY 16.
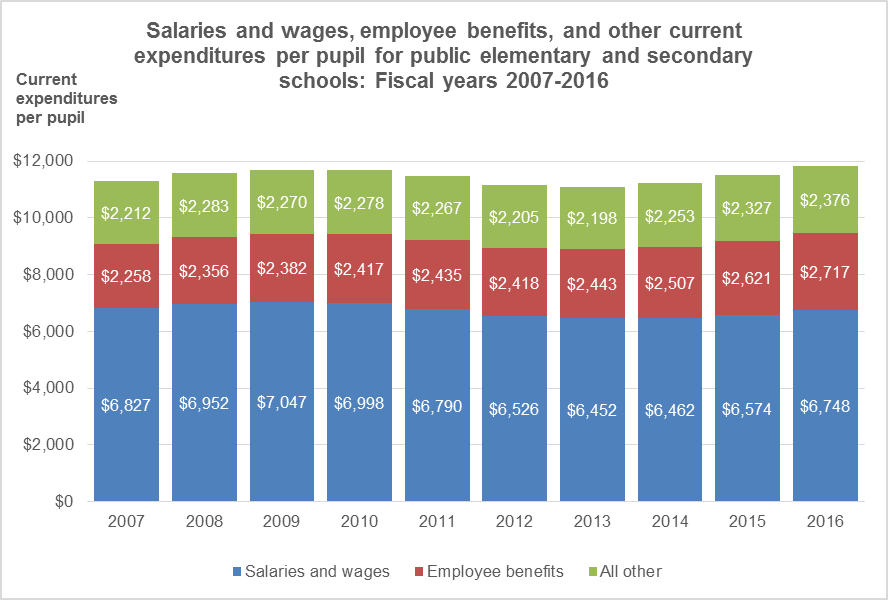
NOTE: Spending is reported in constant FY 16 dollars, based on the Consumer Price Index (CPI).
SOURCE: U.S. Department of Education, National Center for Education Statistics, Common Core of Data (CCD), "National Public Education Financial Survey," fiscal years 2007 through 2016.
At the state level, spending on current expenditures per student ranged from a low of $7,006 in Utah to a high of $22,231 in New York. Current expenditures per student were at least 40 percent higher than the national average in the following states and jurisdictions:
- New York ($22,231)
- District of Columbia ($21,135)
- Connecticut ($19,615)
- New Jersey ($19,041)
- Vermont ($19,023)
- Alaska ($17,510)
- Massachusetts ($16,986)
Current expenditures per student for public elementary and secondary education, by state: Fiscal year 2016
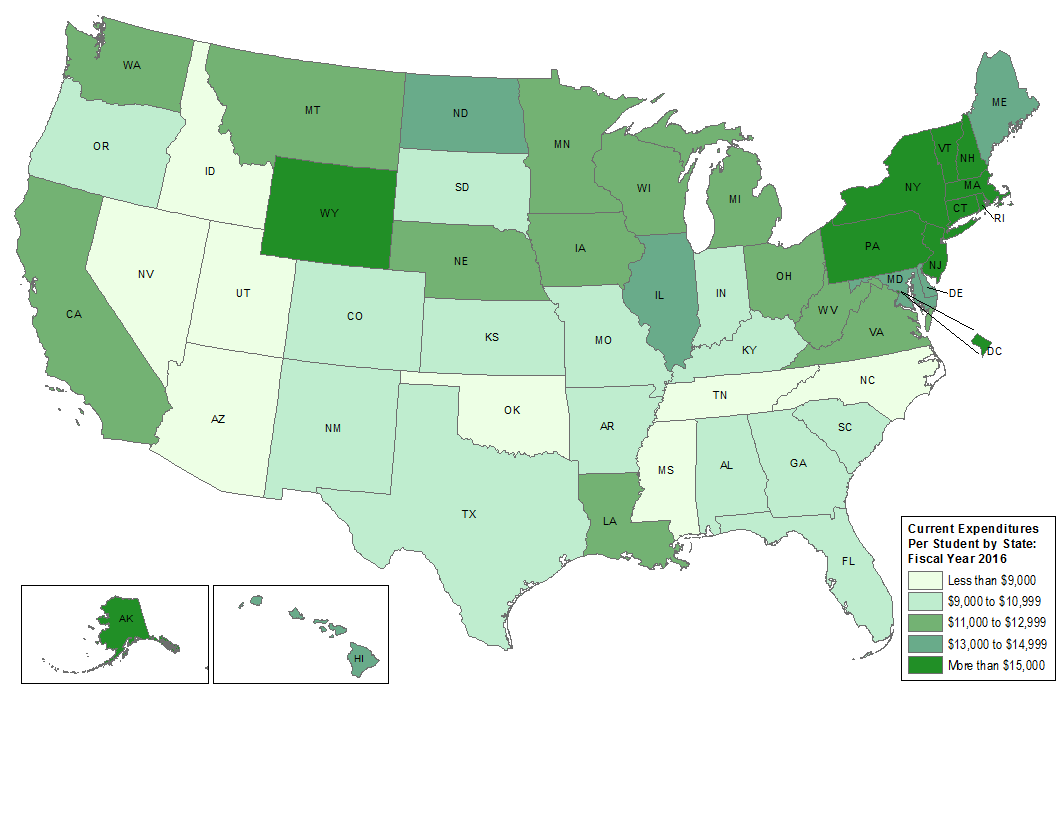
SOURCE: U.S. Department of Education, National Center for Education Statistics, Common Core of Data (CCD), "National Public Education Financial Survey," fiscal year 2016
Between FY 14 and FY 16, current expenditures per student increased by 3 percent or more in 29 states, and by 1 to less than 3 percent in 15 states. Increases in current expenditures per student from FY 14 to FY 16 were highest in California (16.4 percent), Washington (9.9 percent), Hawaii (9.3 percent), New York (8.8 percent), and Pennsylvania (8.2 percent).
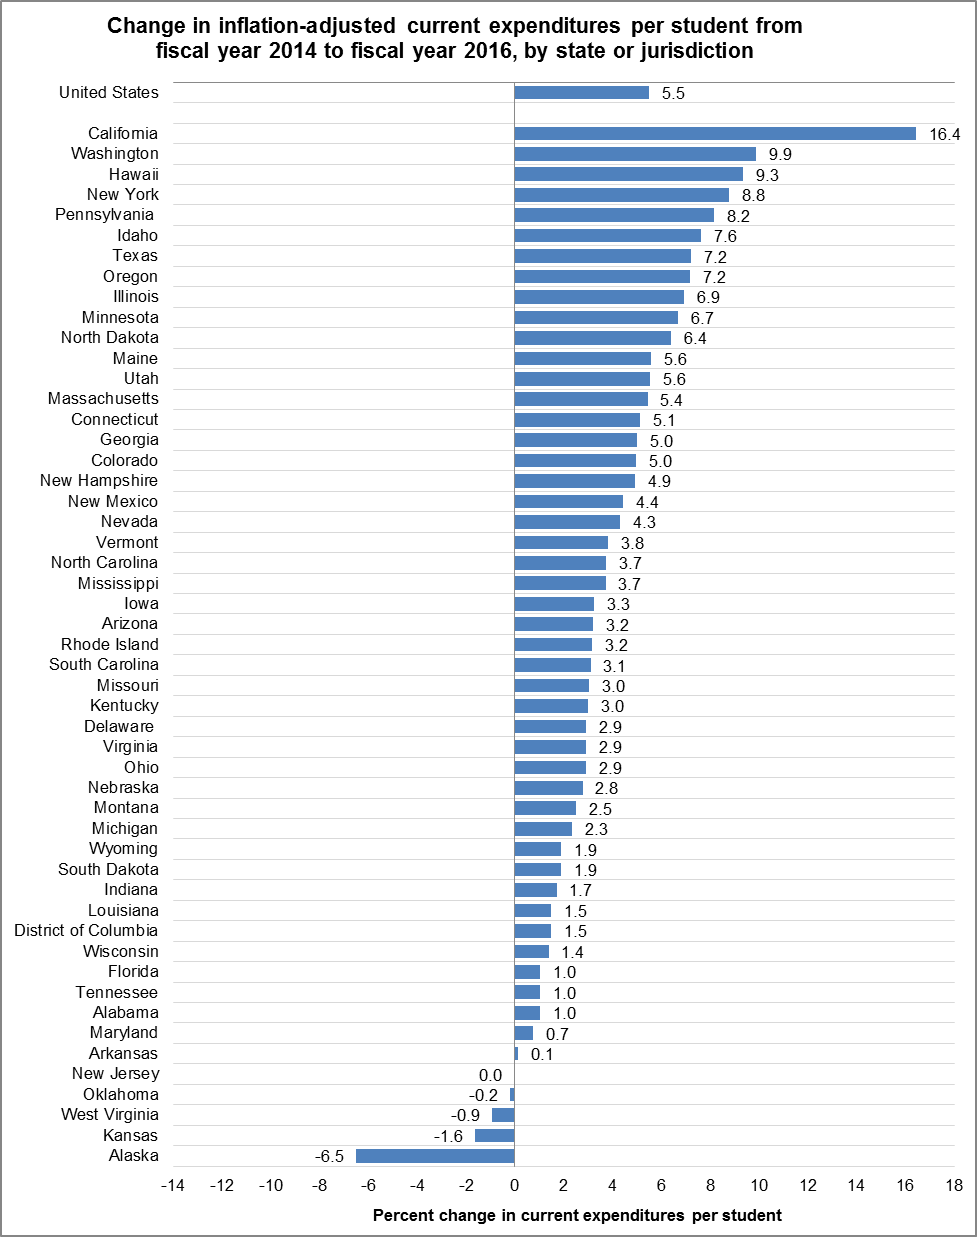
NOTE: Spending is reported in constant FY 16 dollars, based on the Consumer Price Index (CPI).
SOURCE: U.S. Department of Education, National Center for Education Statistics, Common Core of Data (CCD), "National Public Education Financial Survey," fiscal years 2014 and 2016.
The recently released report also presents national and state data on public school funding by source.[4] Total education funding increased by 4.0 percent (from $652.1 to $678.4 billion) from FY 15 to FY 16 following an increase of 3.3 percent from FY 14 to FY 15. Local funding increased by 3.7 percent (from $291.1 to $303.8 billion), state funding increased by 4.9 percent (from $303.6 to $318.6 billion), and federal funding slightly increased by 1.1 percent (from $55.4 to $56.0 billion).
SOURCE: U.S. Department of Education, National Center for Education Statistics, Common Core of Data (CCD), "National Public Education Financial Survey," fiscal years 2007 through 2016.
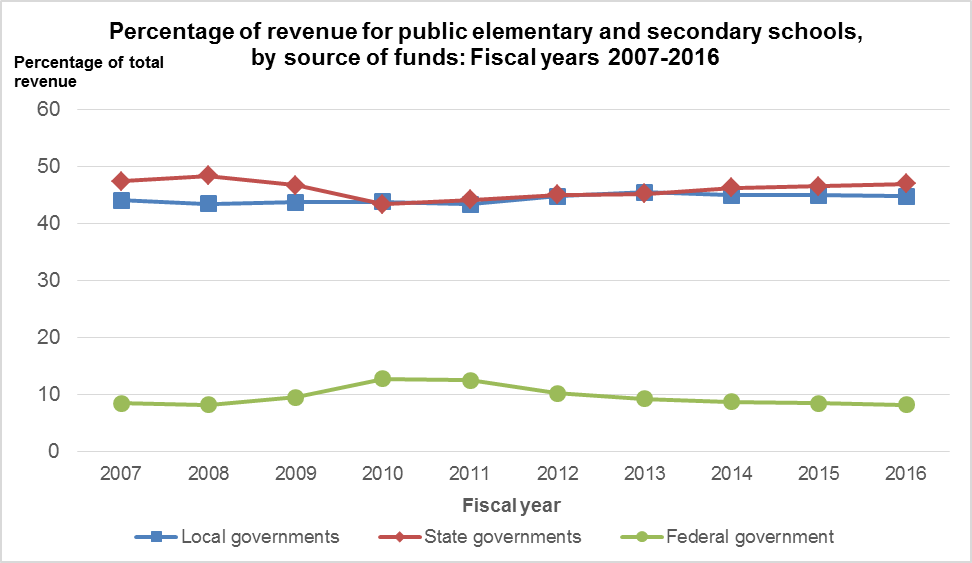
The percentage of total funding from federal sources accounted for approximately 9 percent of total funding in both FY 07 and FY 16; however, there were notable fluctuations during this period. The federal percentage increased from 8.2 percent of funding in FY 08 to 12.5 percent of funding in FY 11. In part, this increase reflects the impact of the American Recovery and Reinvestment Act (ARRA). As the funds from the program were spent, the federal percentage decreased from 10.2 percent of total funding in FY 12 to 8.3 percent in FY 16.
Local sources accounted for 44.8 percent of total funding in FY 16, and have been relatively stable over the past 10 years. The percentage of total funding from state sources decreased from a high of 48.3 percent in FY 08 to 43.4 percent in FY 10, and has since increased to 47 percent in FY 16.
[1] Spending refers to current expenditures. Current expenditures are comprised of expenditures for the day-to-day operation of schools and school districts for public elementary and secondary education, including expenditures for staff salaries and benefits, supplies, and purchased services. Current expenditures include instruction, instruction-related, support services (e.g., social work, health, and psychological services), and other elementary/secondary current expenditures, but exclude expenditures on capital outlay, other programs, and interest on long-term debt.
[2] In order to compare spending from one year to the next, expenditures are converted to constant dollars, which adjusts figures for inflation.
[3] Other expenditures include current expenditures other than salaries, wages, and employee benefits, such as purchased services, tuition, supplies, etc.
[4] Funding refers to revenues. Revenues are comprised of all funds received from external sources, net of refunds, and correcting transactions. Noncash transactions, such as receipt of services, commodities, or other receipts in kind are excluded, as are funds received from the issuance of debt, liquidation of investments, and nonroutine sale of property.