International comparisons provide reference points for researchers and policy analysts to understand trends and patterns in national education data and are very important as U.S. students compete in an increasingly global economy.
Education at a Glance (EAG), an annual publication produced by the Organization for Economic Cooperation and Development (OECD), provides data on the structure, finances, and progress of education systems in 38 OECD countries—including the United States—as well as a number of OECD accession and partner countries. Data presented in EAG on topics of high policy interest in the United States are also featured in NCES reports, including the Condition of Education and Digest of Education Statistics.
The recently released 2023 edition of EAG shows that the United States is above the international average on some measures, such as funding of postsecondary education, but lags behind in others, such as participation in early childhood education and care (ECEC). The 2023 report also features a Spotlight on Vocational Education and Training as well as interactive data dashboards on ECEC systems, upper secondary education systems, and educational support for Ukrainian refugees.
Spotlight on Vocational Education and Training (VET)
Each EAG edition centers on a particular theme of high policy relevance in OECD countries. The focus of this year’s report is VET programs, which look very different in the United States compared with many other OECD countries. Unlike in many OECD countries, most high schools in the United States do not offer a separate, distinct vocational track at the upper secondary (high school) level. Instead, vocational education is available as optional career and technical education (CTE) courses throughout high school. Regardless of whether they choose to take CTE courses, all U.S. students who complete high school have the same potential to access postsecondary programs. In other OECD countries, selecting a vocational track at this level may lead to different postsecondary opportunities. Check out the 2023 EAG Spotlight for an overview of VET programs across OECD countries.
Highlights From EAG 2023
Below is a selection of topics from the EAG report highlighting how key education benchmarks in the United States compare with other OECD countries.
Postsecondary Educational Attainment
The percentage of U.S. 25- to 34-year-olds with a postsecondary degree increased by 13 percentage points between 2000 and 2022, reaching 51 percent (the OECD average in 2022 was 47 percent) (Table A1.3).1 In this age group in the United States, higher percentages of women than men attained a postsecondary degree (56 vs. 46 percent) (Table A1.2). Across OECD countries, the average postsecondary educational attainment gap between 25- to 34-year-old men and women in 2022 (13 percentage points) was wider than the gap in the United States (10 percentage points). In the United States, the postsecondary attainment rate for 25- to 34-year-old men was 5 percentage points higher than the OECD average, and the attainment rate for women was 3 percentage points higher than the OECD average.
Figure 1. Percentage of 25- to 34-year-olds with a postsecondary degree, by OECD country: 2022
[click to enlarge image]
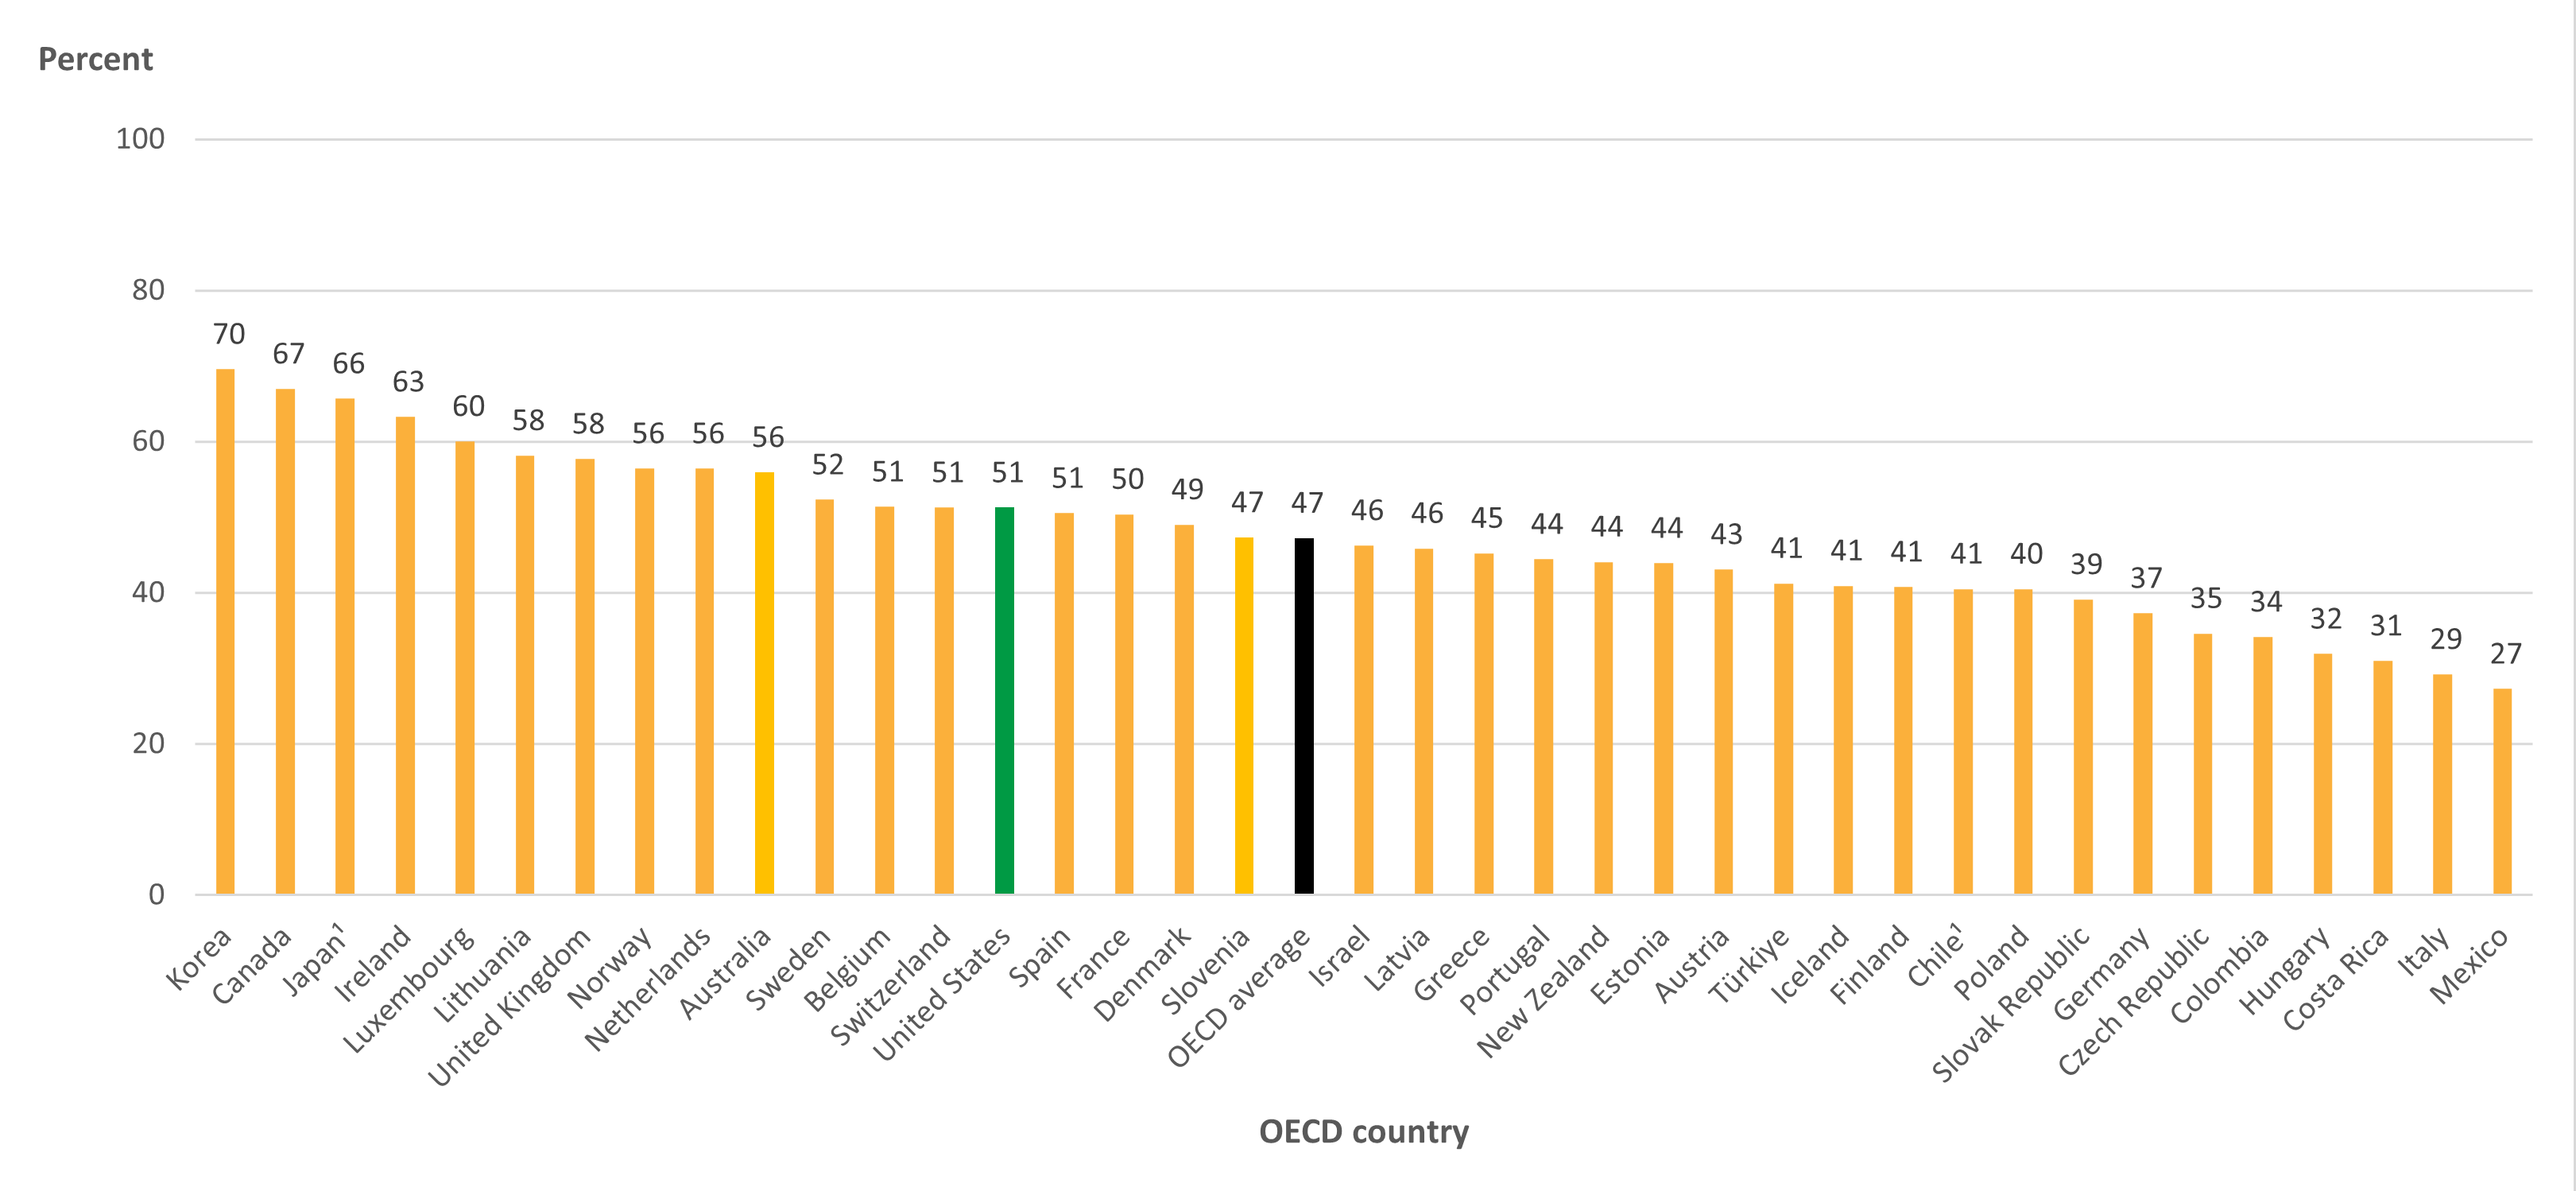
1 Data include a small percentage of adults with lower levels of attainment.
2 Year of reference differs from 2022. Refer to the source table for more details.
SOURCE: OECD (2023), Table A1.3. See Source section for more information and Annex 3 for notes.
International Student Enrollment
The United States is the top OECD destination country for international students enrolling in postsecondary education. In 2021, some 833,204 foreign students were enrolled in postsecondary programs in the United States, representing 13 percent of the international education market share (Table B6.1).2 In comparison, the United Kingdom had the second highest number of international students enrolled in postsecondary education in 2021, representing 9 percent of the international education market share. Interestingly, when examining enrollment trends over the past 3 years (2019 to 2021), foreign student enrollment decreased by 143,649 students (15 percent) in the United States but increased by 111,570 students (23 percent) in the United Kingdom. International student enrollment during these years was likely affected by the coronavirus pandemic, which had large impacts on global travel in 2020 and 2021.
Education Spending
U.S. spending on education is relatively high across all levels of education compared with the OECD average. The largest difference is in postsecondary spending, where the United States spent $36,172 per full-time postsecondary student in 2020, the second highest amount after Luxembourg ($53,421) and nearly double the OECD average ($18,105) (Table C1.1).3 This spending on postsecondary education amounts to 2.5 percent of the U.S. GDP, higher than the OECD average (1.5 percent) (Table C2.1). These total expenditures include amounts received from governments, students, and all other sources.
Figure 2. Expenditures per full-time equivalent student, by education level and OECD country: 2020
[click to enlarge image]
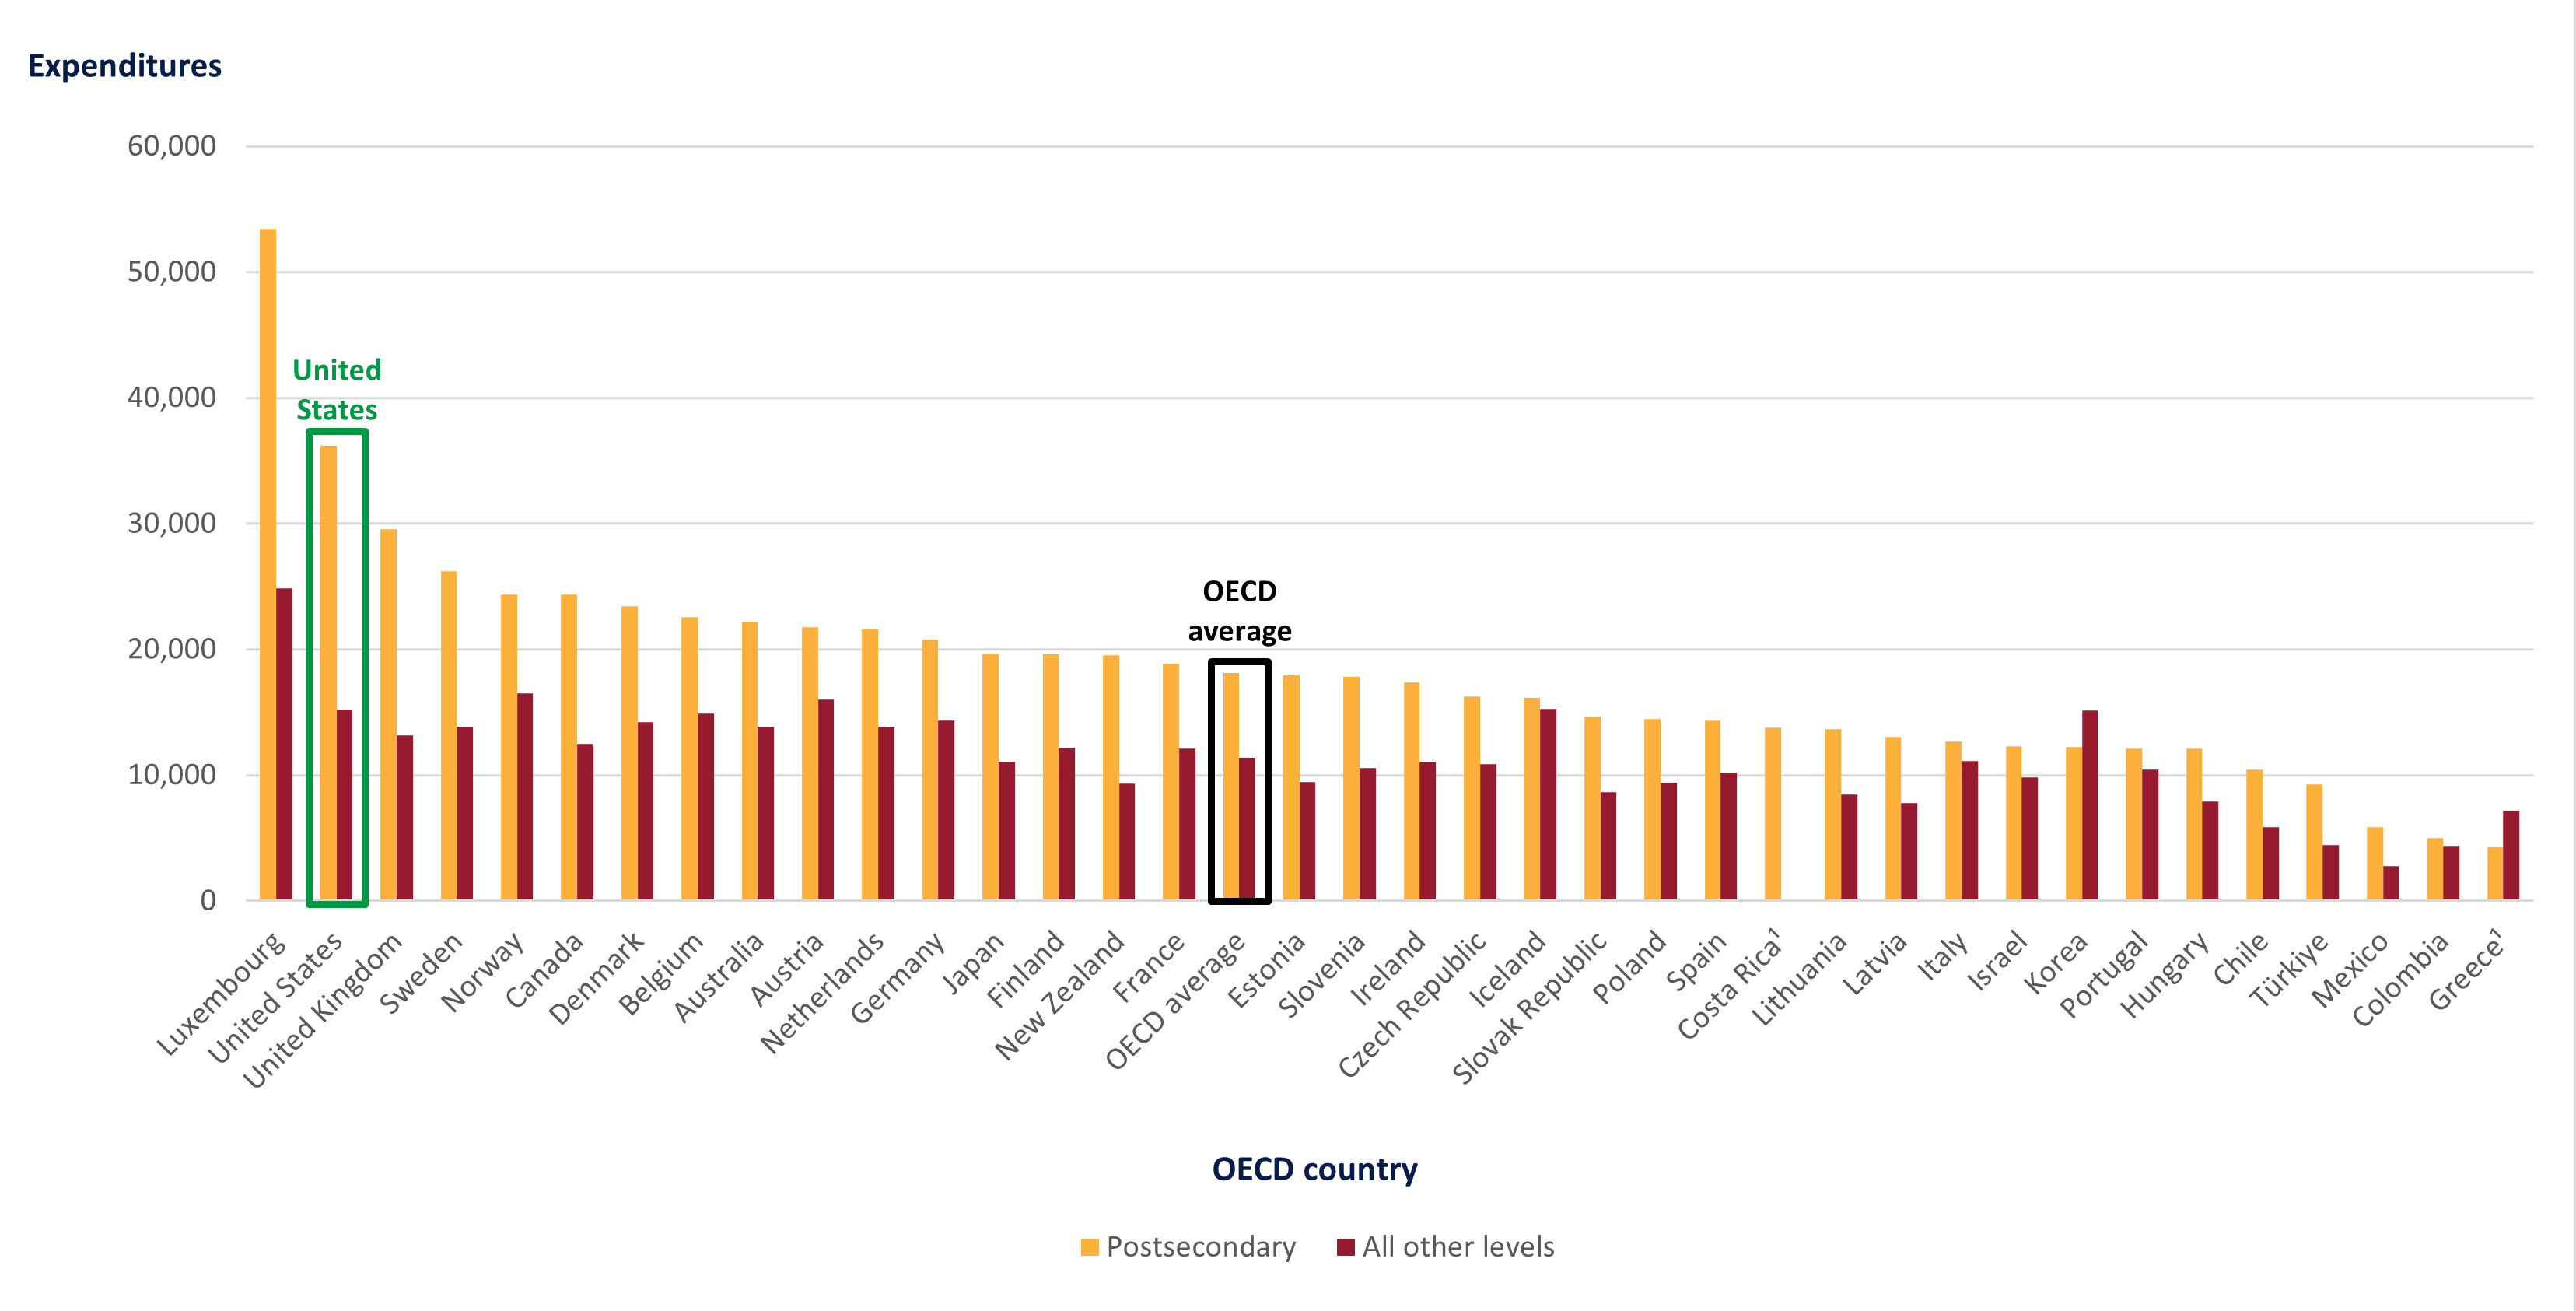
1 Year of reference differs from 2020. Refer to the source table for more details.
SOURCE: OECD (2023), Table C1.1. See Source section for more information and Annex 3 for notes.
High School Completion Rate
The United States has a higher upper secondary (high school) completion rate than most other OECD countries. In 2021, some 87 percent of U.S. students completed their high school program in the expected timeframe, compared with the OECD average of 72 percent (Table B3.1).
Early Childhood Education
The level of participation in early childhood education programs in the United States is below the OECD average. In 2021, average enrollment rates across OECD countries were 72 percent for 3-year-olds, 87 percent for 4-year-olds, and 84 percent for 5-year-olds (Table B2.1). In contrast, enrollment rates for students of these ages in the United States were 30 percent for 3-year-olds, 50 percent for 4-years-olds, and 81 percent for 5-year-olds.
Browse the full EAG 2023 report to see how the United States compares with other countries on these and other important education-related topics.
By RaeAnne Friesenhahn, AIR, and Cris De Brey, NCES
[1] EAG data for the year 2000 can be accessed via the online OECD Stat database.
[2] Unrounded data in Excel format can be accessed via the StatLink located below each table.
[3] Expenditure in national currencies was converted into equivalent USD by dividing the national currency figure by the purchasing power parity (PPP) index for GDP. For more details on methodology see Annex 2 and Annex 3.