IES Blog

Institute of Education Sciences

Using IPEDS Data: Available Tools and Considerations for Use

The Integrated Postsecondary Education Data System (IPEDS) contains comprehensive data on postsecondary institutions. IPEDS gathers information from every college, university, and technical and vocational institution that participates in federal student financial aid programs. The Higher Education Act of 1965, as amended, requires institutions that participate in federal student aid programs to report data on enrollments, program completions, graduation rates, faculty and staff, finances, institutional prices, and student financial aid.

These data are made available to the public in a variety of ways via the IPEDS Use the Data webpage. This blog post provides a description of available IPEDS data tools as well as considerations for determining the appropriate tool to use.


Available Data Tools

College Navigator

College Navigator is a free consumer information tool designed to help students, parents, high school counselors, and others access information about postsecondary institutions.

Note that this tool can be found on the Find Your College webpage (under "Search for College"), along with various other resources to help users plan for college.

IPEDS provides data tools for a variety of users that are organized into three general categories: (1) Search Existing Data, (2) Create Custom Data Analyses, and (3) Download IPEDS Data.

Search Existing Data

Users can search for aggregate tables, charts, publications, or other products related to postsecondary education using the Data Explorer or access IPEDS data via NCES publications like the Digest of Education Statistics or the Condition of Education.

Create Custom Data Analyses

Several data tools allow users to create their own custom analyses with frequently used and derived variables (Data Trends) or all available data collected within IPEDS (Statistical Tables). Users can also customize tables for select subgroups of institutions (Summary Tables). Each of these options allows users to generate analyses within the limitations of the tool itself.

For example, there are three report types available under the Data Feedback Report (DFR) tool. User can

  1. select data from the most recent collection year across frequently used and derived variables to create a Custom DFR;
     
  2. create a Statistical Analysis Report using the variables available for the Custom DFR; and
     
  3. access the NCES developed DFR for any institution.

Download IPEDS Data

Other data tools provide access to raw data through a direct download (Complete Data Files) or through user selections in the IPEDS Custom Data Files tool. In addition, IPEDS data can be downloaded for an entire collection year for all survey components via the Access Database.

IPEDS Data Tools Help

The IPEDS Data Tools User Manual is designed to help guide users through the various functions, processes, and abundant capabilities of IPEDS data tools. The manual contains a wealth of information, hints, tips, and insights for using the tools.


Data Tool Considerations

Users may consider several factors—related to both data selection and data extraction—when determining the right tool for a particular question or query.

Data Selection

  1. Quick access – Accessing data in a few steps may be helpful for users who want to find data quickly. Several data tools provide data quickly but may be limited in their selection options or customizable output.

  2. Data release – IPEDS data are released to the public in two phases: Provisional and Final. Provisional data have undergone quality control procedures and imputation for missing data but have not been updated based on changes within the Prior Year Revision System. Final data reflect changes made within the Prior Year Revision System and additional quality control procedures and will not change. Some tools allow users to access only final data. Table 1 summarizes how provisional and final data are used by various data tools. The IPEDS resource page “Timing of IPEDS Data Collection, Coverage, and Release Cycle” provides more information on data releases.


    Table 1. How provisional and final data are used in various data tools

  1. Select institutions – Users may want to select specific institutions for their analyses. Several tools allow users to limit the output for a selected list of institutions while others include all institutions in the output.
     
  2. Multiple years – While some tools provide a single year of data, many tools provide access to multiple years of data in a single output.
     
  3. Raw data – Some data tools provide access to the raw data as submitted to IPEDS. For example, Look Up an Institution allows users access to survey forms submitted by an institution.
     
  4. Institution-level data – Many data tools provide data at the institution level, since this is the unit of analysis within the IPEDS system.
     
  5. All data available – Many data tools provide access to frequently used and derived variables, but others provide access to the entirety of variables collected within the IPEDS system.

Data Extraction

  1. Save/upload institutions – Several data tools allow a user to create and download a list of institutions, which can be uploaded in a future session.

  2. Save/upload variables – Two data tools allow a user to save the variables selected and upload in a future session.
     
  3. Export data – Many data tools allow a user to download data into a spreadsheet, while others provide information within a PDF. Note that several tools have limitations on the number of variables that can be downloaded in a session (e.g., Compare Institutions has a limit of 250 variables).
     
  4. Produce visuals – Several data tools produce charts, graphs, or other visualizations. For example, Data Trends provides users with the opportunity to generate a bar or line chart and text table.


Below is a graphic that summarizes these considerations for each IPEDS data tool (click the image to enlarge it). 


By Tara B. Lawley, NCES, and Eric S. Atchison, Arkansas State University and Association for Institutional Research IPEDS Educator

NCES Presentation at National HBCU Week Conference

In NCES’s recently released Strategic Plan, Goal 3 identifies our commitment to foster and leverage beneficial partnerships. To fulfill that goal, NCES participates in multiple conferences and meetings throughout the year. Recently, NCES participated in the National Historically Black Colleges and Universities (HBCU) Week Conference. NCES’s presentation at this conference helps us to establish a dialogue with HBCUs and develop partnerships to address critical issues in education.

NCES Commissioner Peggy G. Carr kicked off the presentation with an overview of HBCU data—such as student characteristics, enrollment, and financial aid. Then, NCES experts explored how data from various NCES surveys can help researchers, educators, and policymakers better understand the condition and progress of HBCUs. Read on to learn about these surveys.


Integrated Postsecondary Education Data System (IPEDS)

The Integrated Postsecondary Education Data System (IPEDS) is an annual administrative data collection that gathers information from more than 6,000 postsecondary institutions, including 99 degree-granting, Title IV–eligible HBCUs (in the 2021–22 academic year).

The data collected in IPEDS includes information on institutional characteristics and resources; admissions and completions; student enrollment; student financial aid; and human resources (i.e., staff characteristics). These data are disaggregated, offering insights into student and employee demographics by race/ethnicity and gender, students’ age categories, first-time/non-first-time enrollment statuses, and full-time/part-time attendance intensity.

Data from IPEDS can be explored using various data tools—such as Data Explorer, Trend Generator, and College Navigator—that cater to users with varying levels of data knowledge and varying data needs.


National Postsecondary Student Aid Study (NPSAS)

The National Postsecondary Student Aid Study (NPSAS) is a nationally representative study that examines the characteristics of students in postsecondary institutions—including HBCUs—with a special focus on how they finance their education. NPSAS collects data on the percentage of HBCU students receiving financial aid and the average amounts received from various sources (i.e., federal, state, and institution) by gender and race/ethnicity.

Conducted every 3 or 4 years, this study combines data from student surveys, student-level school records, and other administrative sources and is designed to describe the federal government’s investment in financing students’ postsecondary education.

Data from NPSAS can be explored using DataLab and PowerStats.


National Teacher and Principal Survey (NTPS)

The National Teacher and Principal Survey (NTPS) is the U.S. Department of Education’s primary source of information on K–12 public and private schools from the perspectives of teachers and administrators. NTPS consists of coordinated surveys of schools, principals, and teachers and includes follow-up surveys to study principal and teacher attrition.

Among many other topics, NTPS collects data on the race/ethnicity of teachers and principals. These data—which show that Black teachers and principals make up a relatively small portion of the K–12 workforce—can be used to explore the demographics and experiences of teachers and principals. NTPS provides postsecondary institutions, like HBCUs, a snapshot of the preK–12 experiences of students and staff.

Data from NTPS can be explored using DataLab and PowerStats.


National Assessment of Educational Progress (NAEP)

The National Assessment of Educational Progress (NAEP)—also known as the Nation’s Report Card—is the the largest nationally representative and continuing assessment of what students in public and private schools in the United States know and are able to do in various subjects.

Main NAEP assesses students in grades 4, 8, and 12 in subjects like reading, mathematics, science, and civics, while NAEP Long-Term Trend assesses 9-, 13-, and 17-year-olds in reading and mathematics.

Among many other topics, NAEP collects data on students by race/ethnicity. These data can help to shed light on students’ experiences, academic performance, and level of preparedness before they enroll in HBCUs.

Data from NAEP can be explored using the NAEP Data Explorer.


To explore more HBCU data from these and other NCES surveys—including enrollment trends from 1976 to 2021—check out this annually updated Fast Fact. Be sure to follow NCES on X, Facebook, LinkedIn, and YouTube and subscribe to the NCES News Flash to stay up to date on the latest from NCES.


By Megan Barnett, AIR

Knock, Knock! Who’s There? Understanding Who’s Counted in IPEDS

The Integrated Postsecondary Education Data System (IPEDS) is a comprehensive federal data source that collects information on key features of higher education in the United States, including characteristics of postsecondary institutions, college student enrollment and academic outcomes, and institutions’ employees and finances, among other topics.

The National Center for Education Statistics (NCES) has created a new resource page, Student Cohorts and Subgroups in IPEDS, that provides data reporters and users an overview of how IPEDS collects information related to postsecondary students and staff. This blog post highlights key takeaways from the resource page.

IPEDS survey components collect counts of key student and staff subgroups of interest to the higher education community.

Data users—including researchers, policy analysts, and prospective college students—may be interested in particular demographic groups within U.S. higher education. IPEDS captures data on a range of student and staff subgroups, including race/ethnicity, gender, age categories, Federal Pell Grant recipient status, transfer-in status, and part-time enrollment status.

The Outcome Measures (OM) survey component stands out as an example of how IPEDS collects student subgroups that are of interest to the higher education community. Within this survey component, all entering degree/certificate-seeking undergraduates are divided into one of eight subgroups by entering status (i.e., first-time or non-first-time), attendance status (i.e., full-time or part-time), and Pell Grant recipient status.

Although IPEDS is not a student-level data system, many of its survey components collect counts of students and staff by subgroup.

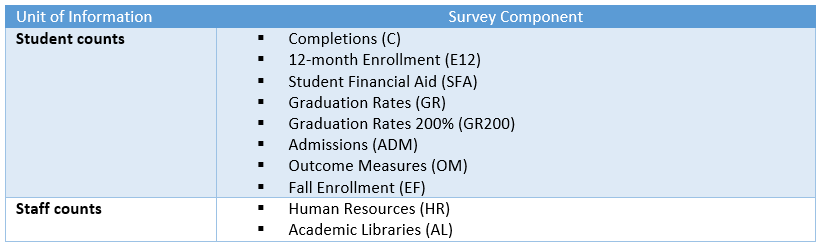
Many IPEDS survey components—such as Admissions, Fall Enrollment, and Human Resources—collect data as counts of individuals (i.e., students or staff) by subgroup (e.g., race/ethnicity, gender) (exhibit 1). Other IPEDS survey components—such as Graduation Rates, Graduation Rates 200%, and Outcome Measures—also include selected student subgroups but monitor cohorts of entering degree/certificate-seeking students over time to document their long-term completion and enrollment outcomes. A cohort is a specific group of students established for tracking purposes. The cohort year is based on the year that a cohort of students begins attending college.


Exhibit 1. IPEDS survey components that collect counts of individuals by subgroup

Table showing IPEDS survey components that collect counts of individuals by subgroup; column one shows the unit of information (student counts vs. staff counts); column two shows the survey component


IPEDS collects student and staff counts by combinations of interacting subgroups.

For survey components that collect student or staff counts, individuals are often reported in disaggregated demographic groups, which allows for more detailed understanding of specific subpopulations. For example, the Fall Enrollment (EF) and 12-month Enrollment (E12) survey components collect total undergraduate enrollment counts disaggregated by all possible combinations of students’ full- or part-time status, gender, degree/certificate-seeking status, and race/ethnicity. Exhibit 2 provides an excerpt of the EF survey component’s primary data collection screen (Part A), in which data reporters provide counts of students who fall within each demographic group indicated by the blank cells.


Exhibit 2. Excerpt of IPEDS Fall Enrollment (EF) survey component data collection screen for full-time undergraduate men: 2022­–23

[click image to enlarge]

Image of IPEDS Fall Enrollment survey component data collection screen for full-time undergraduate men in 2022–23

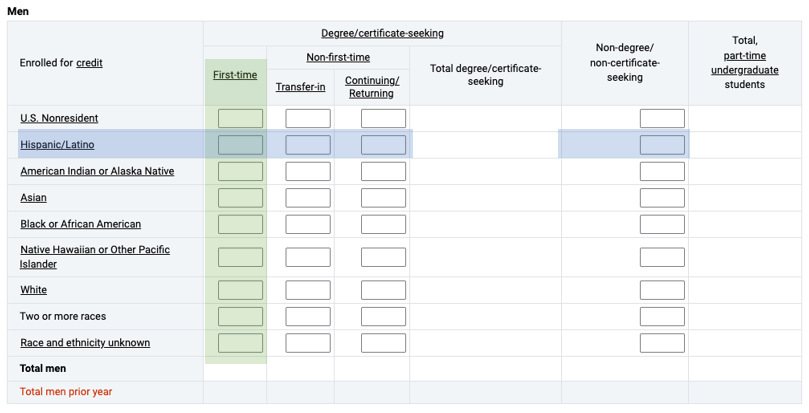
NOTE: This exhibit reflects the primary data collection screen (Part A) for the 2022–23 Fall Enrollment (EF) survey component for full-time undergraduate men. This screen is duplicated three more times for undergraduate students, once each for part-time men, full-time women, and part-time women. For survey materials for all 12 IPEDS survey components, including complete data collection forms and detailed reporting instructions, visit the IPEDS Survey Materials website.


As IPEDS does not collect data at the individual student level, these combinations of interacting subgroups are the smallest unit of information available in IPEDS. However, data users may wish to aggregate these smaller subgroups to arrive at larger groups that reflect broader populations of interest.

For example, using the information presented in exhibit 2, a data user could sum all the values highlighted in the green column to arrive at the total enrollment count of full-time, first-time men. As another example, a data user could sum all the values highlighted in the blue row to determine the total enrollment count of full-time Hispanic/Latino men. Note, however, that many IPEDS data products provide precalculated aggregated values (e.g., total undergraduate enrollment), but data are collected at these smaller units of information (i.e., disaggregated subgroup categories).

Student enrollment counts and cohorts align across IPEDS survey components.

There are several instances when student enrollment or cohort counts reported in one survey component should match or very closely mirror those same counts reported in another survey component. For example, the number of first-time degree/certificate-seeking undergraduate students in a particular fall term should be consistently reported in the Admissions (ADM) and Fall Enrollment (EF) survey components within the same data collection year (see letter A in exhibit 3).


Exhibit 3. Alignment of enrollment counts and cohorts across IPEDS survey components

Infographic showing the alignment of enrollment counts and cohorts across IPEDS survey components


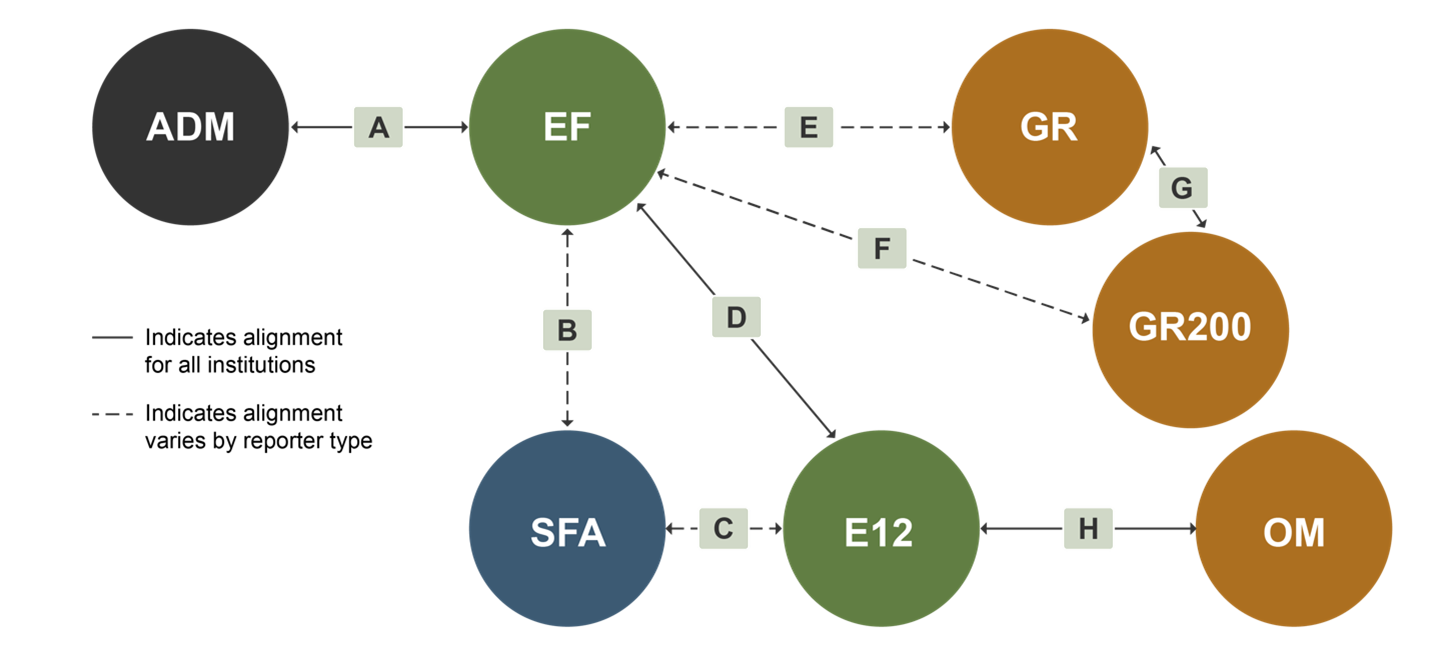
For a full explanation of the alignment of student counts and cohorts across IPEDS survey components (letters A to H in exhibit 3), visit the Student Cohorts and Subgroups in IPEDS resource page.

Be sure to follow NCES on TwitterFacebookLinkedIn, and YouTube, follow IPEDS on Twitter, and subscribe to the NCES News Flash to stay up-to-date on IPEDS data releases and resources.


By Katie Hyland and Roman Ruiz, AIR

Timing is Everything: Understanding the IPEDS Data Collection and Release Cycle

For more than 3 decades, the Integrated Postsecondary Education Data System (IPEDS) has collected data from all postsecondary institutions participating in Title IV federal student aid programs, including universities, community colleges, and vocational and technical schools.

Since 2000, the 12 IPEDS survey components occurring in a given collection year have been organized into three seasonal collection periods: Fall, Winter, and Spring.

The timing of when data are collected (the “collection year”) is most important for the professionals who report their data to the National Center for Education Statistics (NCES). However, IPEDS data users are generally more interested in the year that is actually reflected in the data (the “data year”). As an example, a data user may ask, “What was happening with students, staff, and institutions in 2018–19?"


Text box that says: The collection year refers to the time period the IPEDS survey data are collected. The data year refers to the time period reflected in the IPEDS survey data.


For data users, knowing the difference between the collection year and the data year is important for working with and understanding IPEDS data. Often, the collection year comes after the data year, as institutions need time to collect the required data and check to make sure they are reporting the data accurately. This lag between the time period reflected by the data and when the data are reported is typically one academic term or year, depending on the survey component. For example, fall 2021 enrollment data are not reported to NCES until spring 2022, and the data would not be publicly released until fall 2022.

After the data are collected by NCES, there is an additional time period before they are released publicly in which the data undergo various quality and validity checks. About 9 months after each seasonal collection period ends (i.e., Fall, Winter, Spring), there is a Provisional Data Release and IPEDS data products (e.g., web tools, data files) are updated with the newly released seasonal data. During this provisional release, institutions may revise their data if they believe it was inaccurately reported. A Revised/Final Data Release then happens the following year and includes any revisions that were made to the provisional data.

Sound confusing? The data collection and release cycle can be a technical and complex process, and it varies slightly for each of the 12 IPEDS survey components. Luckily, NCES has created a comprehensive resource page that provides information about the IPEDS data collection and release cycles for each survey component as well as key details for data users and data reporters, such as how to account for summer enrollment in the different IPEDS survey components.

Table 1 provides a summary of the IPEDS 2021–22 data collection and release schedule information that can be found on the resource page. Information on the data year and other details about each survey component can also be found on the resource page.


Table 1. IPEDS 2021–22 Data Collection and Release Schedule

Table showing the IPEDS 2021–22 data collection and release schedule


Here are a few examples of how to distinguish the data year from the collection year in different IPEDS data products.

Example 1: IPEDS Trend Generator

Suppose that a data user is interested in how national graduation rates have changed over time. One tool they might use is the IPEDS Trend Generator. The Trend Generator is a ready-made web tool that allows users to view trends over time on the most frequently asked subject areas in postsecondary education. The Graduation Rate chart below displays data year (shown in green) in the headline and on the x-axis. The “Modify Years” option also allows users to filter by data year. Information about the collection year (shown in gold) can be found in the source notes below the chart.


Image of IPEDS Trend Generator webpage


Example 2: IPEDS Complete Data Files

Imagine that a data user was interested enough in 6-year Graduation Rates that they wanted to run more complex analyses in a statistical program. IPEDS Complete Data Files include all variables for all reporting institutions by survey component and can be downloaded by these users to create their own analytic datasets.

Data users should keep in mind that IPEDS Complete Data Files are organized and released by collection year (shown in gold) rather than data year. Because of this, even though files might share the same collection year, the data years reflected within the files will vary across survey components.


Image of IPEDS Complete Data Files webpage


The examples listed above are just a few of many scenarios in which this distinction between collection year and data year is important for analysis and understanding. Knowing about the IPEDS reporting cycle can be extremely useful when it comes to figuring out how to work with IPEDS data. For more examples and additional details on the IPEDS data collection and release cycles for each survey component, please visit the Timing of IPEDS Data Collection, Coverage, and Release Cycle resource page.

Be sure to follow NCES on Twitter, Facebook, LinkedIn, and YouTube, follow IPEDS on Twitter, and subscribe to the NCES News Flash to stay up-to-date on all IPEDS data releases.


By Katie Hyland and Roman Ruiz, American Institutes for Research

Measuring “Traditional” and “Non-Traditional” Student Success in IPEDS: Data Insights from the IPEDS Outcome Measures (OM) Survey Component

This blog post is the second in a series highlighting the Integrated Postsecondary Education Data System (IPEDS) Outcome Measures (OM) survey component. The first post introduced a new resource page that helps data reporters and users understand OM and how it compares to the Graduation Rates (GR) and Graduation Rates 200% (GR200) survey components. Using data from the OM survey component, this post provides key findings about the demographics and college outcomes of undergraduates in the United States and is designed to spark further study of student success using OM data.

What do Outcome Measures cohorts look like?

OM collects student outcomes for all entering degree/certificate-seeking undergraduates, including non-first-time (i.e., transfer-in) and part-time students. Students are separated into eight subcohorts by entering status (i.e., first-time or non-first-time), attendance status (i.e., full-time or part-time), and Pell Grant recipient status.1 Figure 1 shows the number and percentage distribution of degree/certificate-seeking undergraduates in each OM subcohort from 2009–10 to 2012–13, by institutional level.2

Key takeaways:

  • Across all cohort years, the majority of students were not first-time, full-time (FTFT) students, a group typically referred to as “traditional” college students. At 2-year institutions, 36 percent of Pell Grant recipients and 16 percent of non-Pell Grant recipients were FTFT in 2012–13. At 4-year institutions, 43 percent of Pell Grant recipients and 44 percent of non-Pell Grant recipients were FTFT in 2012–13.
  • Pell Grant recipient cohorts have become less “traditional” over time. In 2012–13, some 36 percent of Pell Grant recipients at 2-year institutions were FTFT, down 5 percentage points from 2009–10 (41 percent). At 4-year institutions, 43 percent of Pell Grant recipients were FTFT in 2012–13, down 5 percentage points from 2009–10 (48 percent).

Figure 1. Number and percentage distribution of degree/certificate-seeking undergraduate students in the adjusted cohort, by Pell Grant recipient status, institutional level, and entering and attendance status: 2009–10 to 2012–13 adjusted cohorts

Stacked bar chart showing the number and percentage distribution of degree/certificate-seeking undergraduate students by Pell Grant recipient status (recipients and non-recipients), institutional level (2-year and 4-year), and entering and attendance status (first-time/full-time, first-time/part-time, non-first-time/full-time, and non-first-time/part-time) for 2009–10 to 2012–13 adjusted cohorts

NOTE: This figure presents data collected from Title IV degree-granting institutions in the United States. Percentages may not sum to 100 due to rounding.

SOURCE: U.S. Department of Education, National Center for Education Statistics, Integrated Postsecondary Education Data System (IPEDS) Outcome Measures component final data (2017­–19) and provisional data (2020).


What outcomes does Outcome Measures collect?

The OM survey component collects students’ highest credential earned (i.e., certificate, associate’s, or bachelor’s) at 4,3 6, and 8 years after entry. Additionally, for students who did not earn a credential by the 8-year status point, the survey component collects an enrollment status outcome (i.e., still enrolled at the institution, enrolled at another institution, or enrollment status unknown). Figure 2 shows these outcomes for the 2012–13 adjusted cohort.

Key takeaways:

  • The percentage of students earning an award (i.e., certificate, associate’s, or bachelor’s) was higher at each status point, with the greatest change occurring between the 4- and 6-year status points (a 7-percentage point change, from 32 percent to 39 percent).
  • At the 8-year status point, more than a quarter of students were still enrolled in higher education: 26 percent had “transferred-out” to enroll at another institution and 1 percent were still enrolled at their original institution. This enrollment status outcome fills an important gap left by the GR200 survey component, which does not collect information on students who do not earn an award 8 years after entry.

Figure 2. Number and percentage distribution of degree/certificate-seeking undergraduate students, by award and enrollment status and entry status point: 2012–13 adjusted cohort

Waffle chart showing award status (certificate, associate’s, bachelor’s, and did not receive award) and enrollment status (still enrolled at institution, enrolled at another institution, and enrollment status unknown) of degree/certificate-seeking undergraduate students, by status point (4-year, 6-year, and 8-year) for 2012–13 adjusted cohort

NOTE: One square represents 1 percent. This figure presents data collected from Title IV degree-granting institutions in the United States.

SOURCE: U.S. Department of Education, National Center for Education Statistics, Integrated Postsecondary Education Data System (IPEDS) Outcome Measures component provisional data (2020).


How do Outcome Measures outcomes vary across student subgroups?

Every data element collected by the OM survey component (e.g., cohort counts, outcomes by time after entry) can be broken down into eight subcohorts based on entering, attendance, and Pell Grant recipient statuses. In addition to these student characteristics, data users can also segment these data by key institutional characteristics such as sector, Carnegie Classification, special mission (e.g., Historically Black College or University), and region, among others.4 Figure 3 displays the status of degree/certificate-seeking undergraduates 8 years after entry by each student subcohort within the broader 2012–13 degree/certificate-seeking cohort.

Key takeaways:

  • Of the eight OM subcohorts, FTFT non-Pell Grant recipients had the highest rate of earning an award or still being enrolled 8 years after entry. Among this subcohort, 18 percent had an unknown enrollment status 8 years after entry.
  • Among both Pell Grant recipients and non-Pell Grant recipients, full-time students had a higher rate than did part-time students of earning an award or still being enrolled 8 years after entry.
  • First-time, part-time (FTPT) students had the lowest rate of the subcohorts of earning a bachelor’s degree. One percent of FTPT Pell Grant recipients and 2 percent of FTPT non-Pell Grant recipients had earned a bachelor’s degree by the 8-year status point.

Figure 3. Number and percentage distribution of degree/certificate-seeking undergraduate students 8 years after entry, by Pell Grant Recipient status, entering and attendance status, and award and enrollment status: 2012–13 adjusted cohort

Horizontal stacked bar chart showing award (certificate, associate’s, and bachelor’s) and enrollment statuses (still enrolled at institution, enrolled at another institution, and enrollment status unknown) of degree/certificate-seeking undergraduate students by Pell Grant recipient status (recipients and non-recipients), institutional level (2-year and 4-year), and entering and attendance status (first-time/full-time, first-time/part-time, non-first-time/full-time, and non-first-time/part-time) for 2012–13 adjusted cohort


NOTE: This figure presents data collected from Title IV degree-granting institutions in the United States. Percentages may not sum to 100 due to rounding.

SOURCE: U.S. Department of Education, National Center for Education Statistics, Integrated Postsecondary Education Data System (IPEDS) Outcome Measures component provisional data (2020).


How do Outcome Measures outcomes vary over time?

OM data are comparable across 4 cohort years.5 Figure 4 shows outcomes of degree/certificate-seeking undergraduates 8 years after entry from the 2009–10 cohort through the 2012–13 cohort for so-called “traditional” (i.e., FTFT) and “non-traditional” (i.e., non-FTFT) students.

Key takeaways:

  • For both traditional and non-traditional students, the percentage of students earning an award was higher for the 2012–13 cohort than for the 2009–10 cohort, climbing from 47 percent to 51 percent for traditional students and from 32 percent to 35 percent for non-traditional students.
  • The growth in award attainment for traditional students was driven by the share of students earning bachelor’s degrees (30 percent for the 2009–10 cohort vs. 35 percent for the 2012–13 cohort).
  • The growth in award attainment for non-traditional students was driven by the share of students earning both associate’s degrees (15 percent for the 2009–10 cohort vs. 16 percent for the 2012–13 cohort) and bachelor’s degrees (13 percent for the 2009–10 cohort vs. 15 percent for the 2012–13 cohort).

Figure 4. Number and percentage distribution of degree/certificate-seeking undergraduate students 8 years after entry, by first-time, full-time (FTFT) status and award and enrollment status: 2009–10 to 2012–13 adjusted cohorts

Stacked bar chart showing award status (certificate, associate’s, and bachelor’s) and enrollment status (still enrolled at institution, enrolled at another institution, and enrollment status unknown) of degree/certificate-seeking undergraduate students 8 years after entry by first-time, full-time status (traditional or first-time, full-time students and non-traditional or non-first-time, full-time students) for 2009–10 to 2012–13 adjusted cohorts

NOTE: This figure presents data collected from Title IV degree-granting institutions in the United States. “Non-traditional” (i.e., non-first-time, full-time) students include first-time, part-time, non-first-time, full-time, and non-first-time, part-time subcohorts. Percentages may not sum to 100 due to rounding.

SOURCE: U.S. Department of Education, National Center for Education Statistics, Integrated Postsecondary Education Data System (IPEDS) Outcome Measures component final data (2017–2019) and provisional data (2020).


To learn more about the IPEDS OM survey component, visit the Measuring Student Success in IPEDS: Graduation Rates (GR), Graduation Rates 200% (GR200), and Outcome Measures (OM) resource page and the OM survey component webpage. Go to the IPEDS Use the Data page to explore IPEDS data through easy-to-use web tools, access data files to conduct your own analyses like those presented in this blog post, or view OM web tables.  

By McCall Pitcher, AIR


[1] The Federal Pell Grant Program (Higher Education Act of 1965, Title IV, Part A, Subpart I, as amended) provides grant assistance to eligible undergraduate postsecondary students with demonstrated financial need to help meet education expenses.

[2] Due to the 8-year measurement lag between initial cohort enrollment and student outcome reporting for the Outcome Measures survey component, the most recent cohort for which data are publicly available is 2012–13. Prior to the 2009–10 cohort, OM did not collect cohort subgroups by Pell Grant recipient status. Therefore, this analysis includes data only for the four most recent cohorts.

[3] The 4-year status point was added in the 2017–18 collection.

[4] Data users can explore available institutional variables on the IPEDS Use the Data webpage.

[5] For comparability purposes, this analysis relies on data from the 2017–18 collection (reflecting the 2009–10 adjusted cohort) through the 2020–21 collection (reflecting the 2012–13 adjusted cohort). Prior to the 2017–18 collection, OM cohorts were based on a fall term for academic reporters and a full year for program reporters.