IES Blog

Institute of Education Sciences

Save the Date: Leveraging Evidence to Accelerate Recovery Nationwide (LEARN) Network Launch Event

Join us on January 19, 2023, from 3pm EST-4:30pm EST, as members of the IES-funded LEARN (Leveraging Evidence to Accelerate Recovery Nationwide) Network convene publicly for the first time to share their network's goals and vision. Learn more from the network teams during this virtual event

and hear from IES Director Mark Schneider about his hopes for the LEARN Network in the coming years as IES looks to the future with a focus on progress, purpose, and performance.

The LEARN Network was established to focus on adapting and preparing to scale existing, evidence-based products to address learning acceleration and recovery for students in K-12, particularly for students from underrepresented groups disproportionately affected by the COVID-19 pandemic. In addition to generating solutions to the nation’s most pressing challenges to COVID-19 recovery within the education sector, IES expects that the combined efforts of this network will lead to the establishment of best practices for how to prepare to effectively scale evidence-based products.

The LEARN Network includes a scaling lead and four product teams. The scaling lead, led by a team at SRI International, is facilitating training, coaching, and collaboration activities with product teams; ensuring educator needs and perspectives are addressed; and providing a model for the field that ensures evidence-based products are developed with the potential to achieve impact at scale for students—particularly those in most need—from the start. Product teams are focused on preparing to scale literacy products for students in K-3 (Targeted Reading Instruction; Grantee: University of Florida), 4th-5th grade (Peer-Assisted Learning Strategies; Grantee: AIR), and middle school (Strategic Adolescent Reading Intervention; Grantee: SERP) as well as a math product for students in 5th grade (Classwide Fraction Intervention combined with Math Peer-Assisted Learning Strategies; Grantee: AIR).

Registration is now open, and we hope to see you there! For more information on the event and to register, visit https://learntoscale.org/

International Computer and Information Literacy Study: 2023 Data Collection

In April, the National Center for Education Statistics (NCES) will kick off the 2023 International Computer and Information Literacy Study (ICILS) of eighth-grade students in the United States. This will be the second time the United States is participating in the ICILS.

What is ICILS?

ICILS is a computer-based international assessment of eighth-grade students’ capacity to use information and communications technologies (ICT)1 productively for a range of different purposes. It is sponsored by the International Association for the Evaluation of Educational Achievement (IEA) and conducted in the United States by NCES.

In addition to assessing students on two components—computer and information literacy (CIL) and computational thinking (CT)—ICILS also collects information from students, teachers, school principals, and ICT coordinators on contextual factors that may be related to students’ development in CIL.

Why is ICILS important?

ICILS measures students’ skills with ICT and provides data on CIL. In the United States, the development of these skills is called for in the Federal STEM Education Strategic Plan. Outside of the United States, ICILS is also recognized as an official EU target by the European Council and EU member states to support strategic priorities toward the European Education Area and Beyond (2021–2030). From a global perspective, ICILS provides information for monitoring progress toward the UNESCO Sustainable Development Goals (SDGs).

The measurement of students’ CIL is highly relevant today—digital tools and online learning became the primary means of delivering and receiving education during the onset of the coronavirus pandemic, and technology continually shapes the way students learn both inside and outside of school.

ICILS provides valuable comparative data on students’ skills and experience across all participating education systems. In 2018, ICILS results showed that U.S. eighth-grade students’ average CIL score (519) was higher than the ICILS 2018 average score (496) (figure 1).


Horizontal bar chart showing average CIL scores of eighth-grade students, by education system, in 2018

* p < .05. Significantly different from the U.S. estimate at the .05 level of statistical significance.
NOTE: CIL = computer and information literacy. The ICILS CIL scale ranges from 100 to 700. The ICILS 2018 average is the average of all participating education systems meeting international technical standards, with each education system weighted equally. Education systems are ordered by their average CIL scores, from largest to smallest. Italics indicate the benchmarking participants.
SOURCE: International Association for the Evaluation of Educational Achievement (IEA), International Computer and Information Literacy Study (ICILS), 2018.


ICILS data can also be used to examine various topics within one education system and shed light on the variations in the use of digital resources in teaching and learning among student and teacher subgroups. For example, in 2018, lower percentages of mathematics teachers than of English language arts (ELA) and science teachers often or always used ICT to support student-led discussions, inquiry learning, and collaboration among students (figure 2).


Stacked horizontal bar chart showing percentage of U.S. eighth-grade teachers who often or always use ICT, by selected teaching practice and subject (English language arts, math, and science), in 2018

NOTE: ICT = information and communications technologies. Teaching practices are ordered by the percentage of English language arts teachers using ICT, from largest to smallest. Science includes general science and/or physics, chemistry, biology, geology, earth sciences, and technical science.
SOURCE: International Association for the Evaluation of Educational Achievement (IEA), International Computer and Information Literacy Study (ICILS), 2018.


What does the ICILS 2023 data collection include?

In November 2022, NCES started the preparation work for the ICILS 2023 main study data collection, which is scheduled for administration from April to June 2023. Eighth-grade students and staff from a nationally representative sample of about 150 schools will participate in the study.

Students will be assessed on CIL (which focuses on understanding computer use, gathering information, producing information, and communicating digitally) and CT (which focuses on conceptualizing problems and operationalizing solutions). In addition to taking the assessment, students will complete a questionnaire about their access to and use of ICT.

Teachers will be surveyed about their use of ICT in teaching practices, ICT skills they emphasize in their teaching, their attitudes toward using ICT, and their ICT-related professional development. In addition, principals and ICT coordinators will be surveyed about ICT resources and support at school, priorities in using ICT, and management of ICT resources.

In 2023, more than 30 education systems will participate in the study and join the international comparisons. When ICILS 2023 results are released in the international and U.S. reports in November 2024, we will be able to learn more about the changes in students’ and teachers’ technology use over the past 5 years by comparing the 2023 and 2018 ICILS results. Such trend comparisons will be meaningful given the increased availability of the Internet and digital tools during the pandemic.


Explore the ICILS website to learn more about the study, and be sure to follow NCES on TwitterFacebookLinkedIn, and YouTube and subscribe to the NCES News Flash to stay up-to-date on future ICILS reports and resources.


By Yan Wang and Yuqi Liao, AIR


[1] Refers to technological tools and resources used to store, create, share, or exchange information, including computers, software applications, and the Internet.

Six Strategies for Effectively Communicating Research Findings to Decision Makers

Researchers must possess the ability to clearly communicate research findings to non-technical audiences, including decision makers who may have limited time and varying levels of tolerance for data-rich reports. We and our colleagues recently honed these skills while preparing research briefs for the Virginia Department of Education (VDOE) as part of an IES-funded partnership project between VDOE and the University of Virginia exploring the impacts of the COVID-19 pandemic on students and teachers. These briefs are a key mechanism through which our project services the purpose of IES’s Using Longitudinal Data to Support State Education Policymaking Grantmaking Programs to generate useful findings to inform the decision making of policy makers and education leaders at the state, district, and school levels.

In their initial feedback, VDOE described the briefs as “too technical.” When we led with the numbers, our intended audience quickly became overwhelmed by the need to also interpret the findings on their own. Our conversations with VDOE provided helpful direction on how we could revise the briefs to better reach non-technical, decision-making audiences in Virginia and beyond. We share six strategies we have applied to all our research briefs.

  • Yes, briefs need a summary too: The draft briefs were short (4-7 pages) inclusive of figures and endnotes, and they began with a list of key findings. Based on the feedback, we morphed this list into a proper summary of the brief. Many of the decision makers we want to reach only have time to read a page summary, and that summary needs to be self-contained. Without additional context, the initial list of key findings would have had minimal impact.
  • Lead with the headline: Numbers are a powerful tool for storytelling; however, too many numbers can also be hard for many people—researchers and non-researchers alike—to consume. We therefore edited each paragraph to lead with a numbers-free sentence that provides the main take away from the analysis and followed that up with the supporting evidence (the numbers).
  • Answer the question: Our initial groundwork to develop solid relationships with agency staff allowed us to identify priority questions on which to focus the briefs. While several tangential but interesting findings also resulted from our analysis, the briefs we developed only focused on answering the priority research questions. Tangential findings can be explored in more depth in future research projects.
  • Accurate but not over-caveated: All research makes some assumptions and has some limitations. The average non-technical audience member is unlikely to want a thorough detailing of each of these; however, some are too important to exclude. We chose to include those that were most vital to helping the reader make the correct interpretation.
  • A picture speaks a thousand words: This was something at which our initial drafts succeeded. Rather than providing tables of statistics, we included simple, well-labeled figures that clearly presented the key findings graphically to visually tell the story.
  • Conclude by summarizing not extrapolating: The purpose of these briefs was to describe the changes that the pandemic wrought to Virginia’s public schools and convey that knowledge to decision makers charged with plotting a course forward. The briefs were not intended to provide explicit guidance or recommendations to those decision makers.

These strategies, of course, are also useful when writing for technical audiences. While their training and experiences may equip them to consume research that doesn’t exhibit these six strategies, using these strategies will enhance the impact of your research findings with even the most technical of audiences.


Luke C. Miller is a Research Associate Professor at the University of Virginia’s School of Education and Human Development. He is the lead researcher and co-Principal Investigator on the IES-funded project led by VDOE in partnership with UVA.

Jennifer Piver-Renna is the Director of the Office of Research in the Department of Data, Research and Technology at the Virginia Department of Education. She is the state education agency (SEA) co-Investigator on the IES-funded project.

This blog was produced by Allen Ruby (Allen.Ruby@ed.gov), Associate Commissioner for Policy and Systems Division, NCER.  

U.S. Is Unique in Score Gap Widening in Mathematics and Science at Both Grades 4 and 8: Prepandemic Evidence from TIMSS

Tracking differences between the performance of high- and low-performing students is one way of monitoring equity in education. These differences are referred to as achievement gaps or “score gaps,” and they may widen or narrow over time.

To provide the most up-to-date international data on this topic, NCES recently released Changes Between 2011 and 2019 in Achievement Gaps Between High- and Low-Performing Students in Mathematics and Science: International Results From TIMSS. This interactive web-based Stats in Brief uses data from the Trends in International Mathematics and Science Study (TIMSS) to explore changes between 2011 and 2019 in the score gaps between students at the 90th percentile (high performing) and the 10th percentile (low performing). The study—which examines data from 47 countries at grade 4, 36 countries at grade 8, and 29 countries at both grades—provides an important picture of prepandemic trends.

This Stats in Brief also provides new analyses of the patterns in score gap changes over the last decade. The focus on patterns sheds light on which part of the achievement distribution may be driving change, which is important for developing appropriate policy responses. 


Did score gaps change in the United States and other countries between 2011 and 2019?

In the United States, score gap changes consistently widened between 2011 and 2019 (figure 1). In fact, the United States was the only country (of 29) where the score gap between high- and low-performing students widened in both mathematics and science at both grade 4 and grade 8.


Figure 1. Changes in scores gaps between high- and low-performing U.S. students between 2011 and 2019
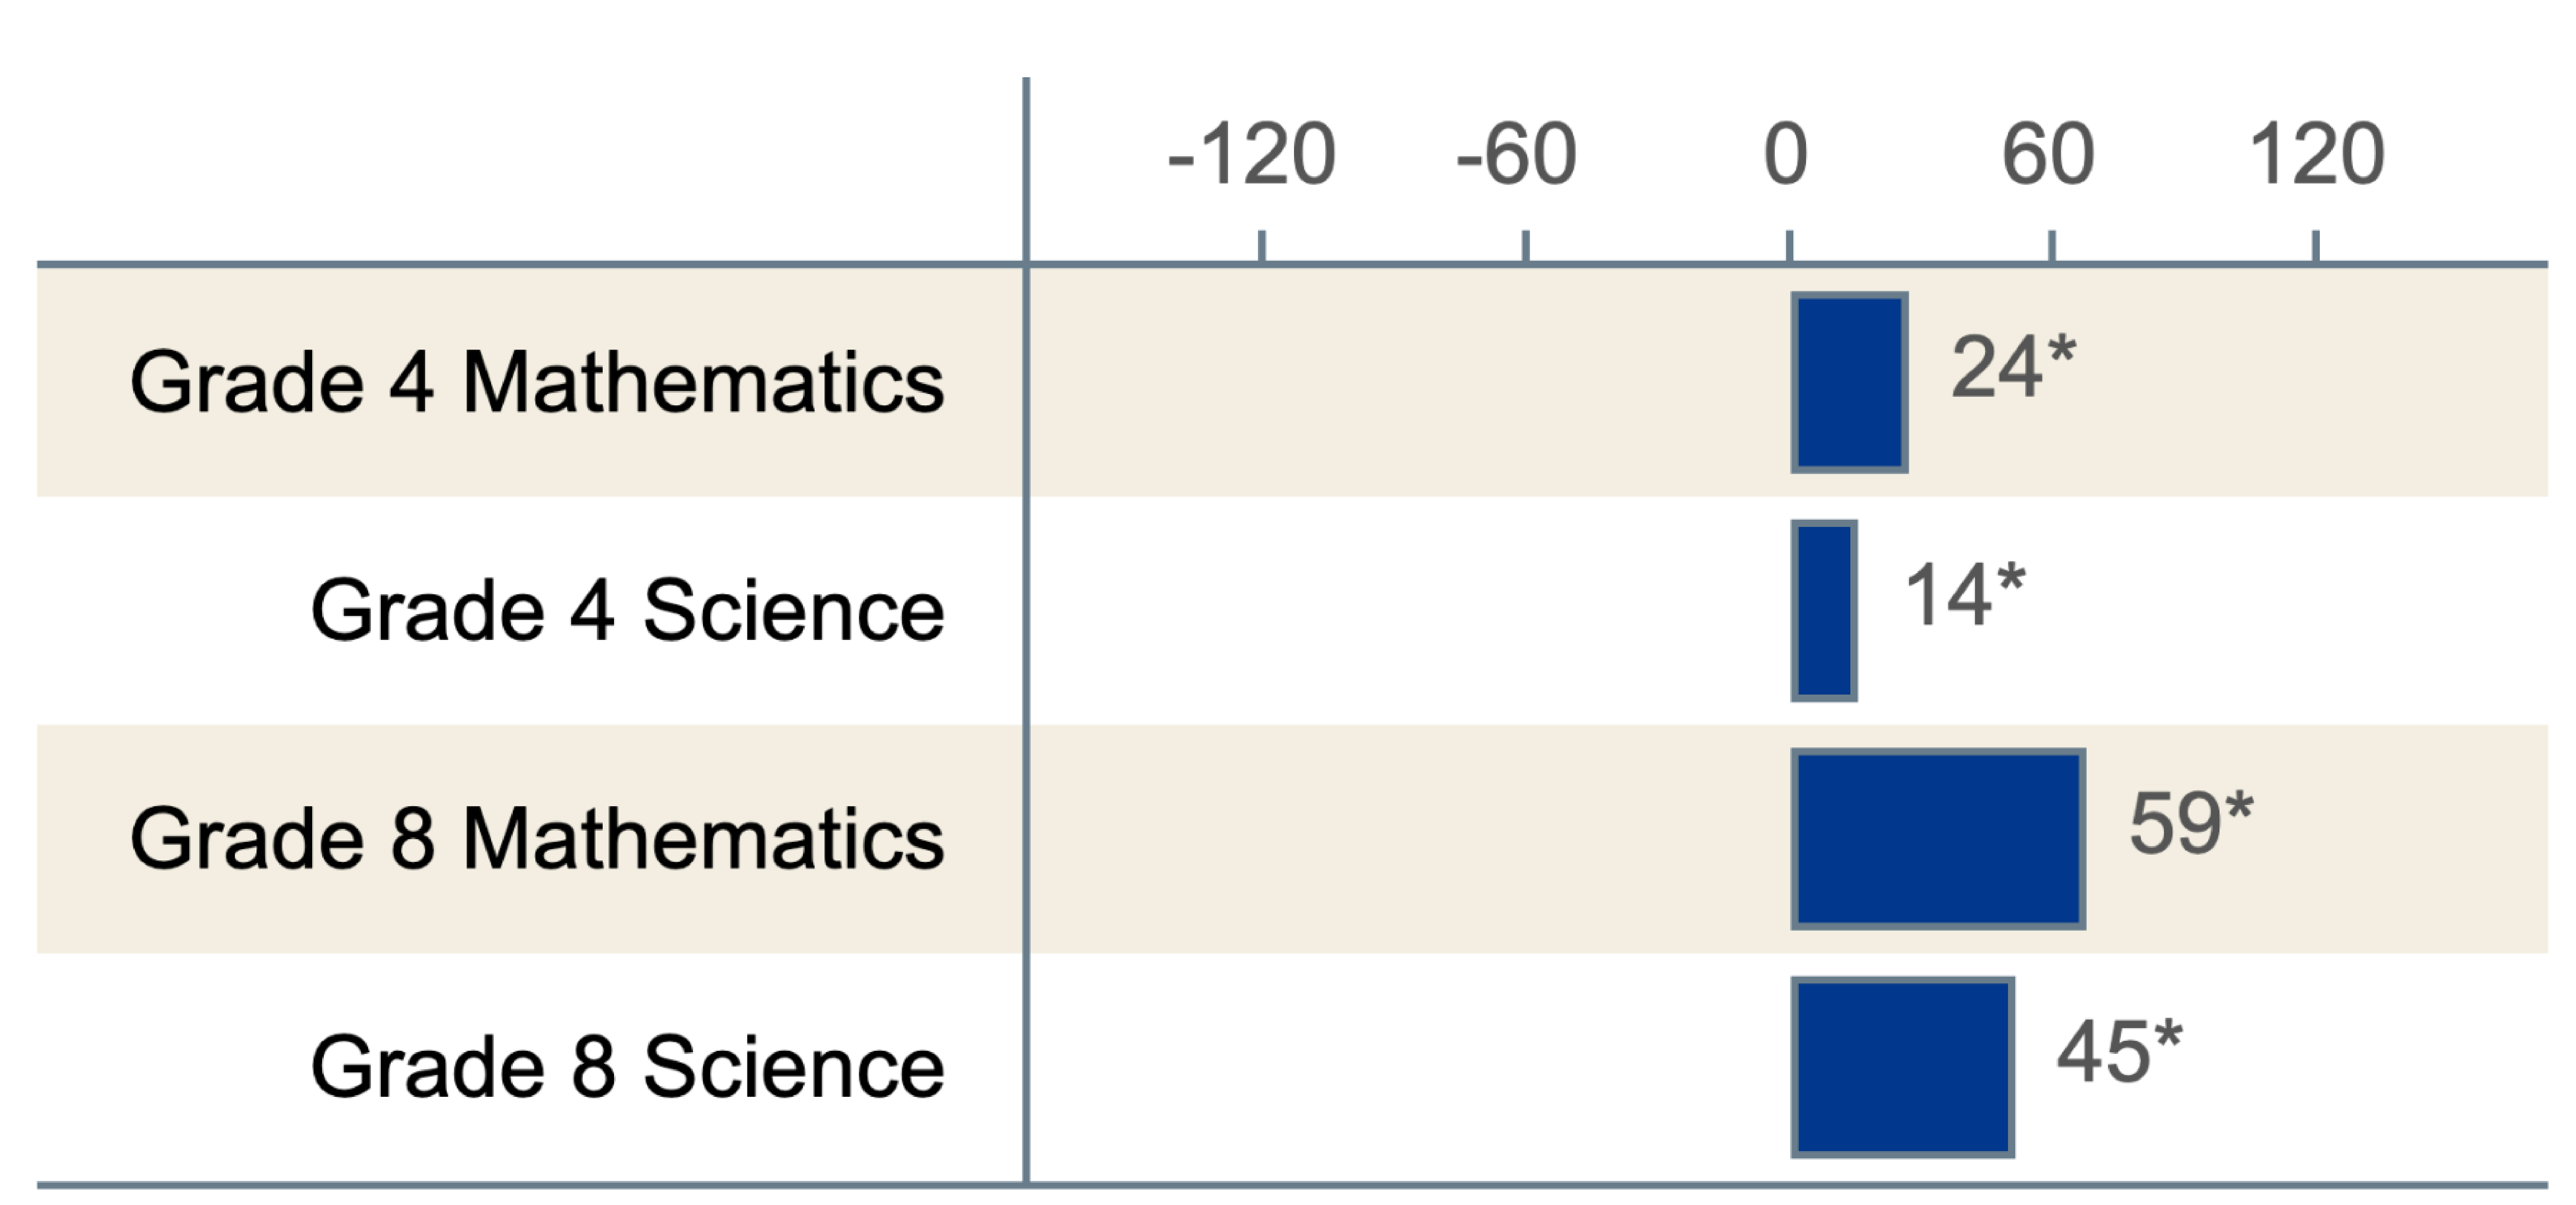
Horizontal bar chart showing changes in scores gaps between high- and low-performing U.S. students between 2011 and 2019

* p < .05. Change in score gap is significant at the .05 level of statistical significance.

SOURCE: Stephens, M., Erberber, E., Tsokodayi, Y., and Fonseca, F. (2022). Changes Between 2011 and 2019 in Achievement Gaps Between High- and Low-Performing Students in Mathematics and Science: International Results From TIMSS (NCES 2022-041). U.S. Department of Education. Washington, DC: National Center for Education Statistics, Institute of Education Sciences. Available at https://nces.ed.gov/pubsearch/pubsinfo.asp?pubid=2022041.


For any given grade and subject combination, no more than a quarter of participating countries had a score gap that widened, and no more than a third had a score gap that narrowed—further highlighting the uniqueness of the U.S. results.


Did score gaps change because of high-performing students, low-performing students, or both?

At grade 4, score gaps widened in the United States between 2011 and 2019 due to decreases in low-performing students’ scores, while high-performing students’ scores did not measurably change (figure 2). This was true for both mathematics and science and for most of the countries where score gaps also widened.


Figure 2. Changes in scores of high- and low-performing U.S. students between 2011 and 2019
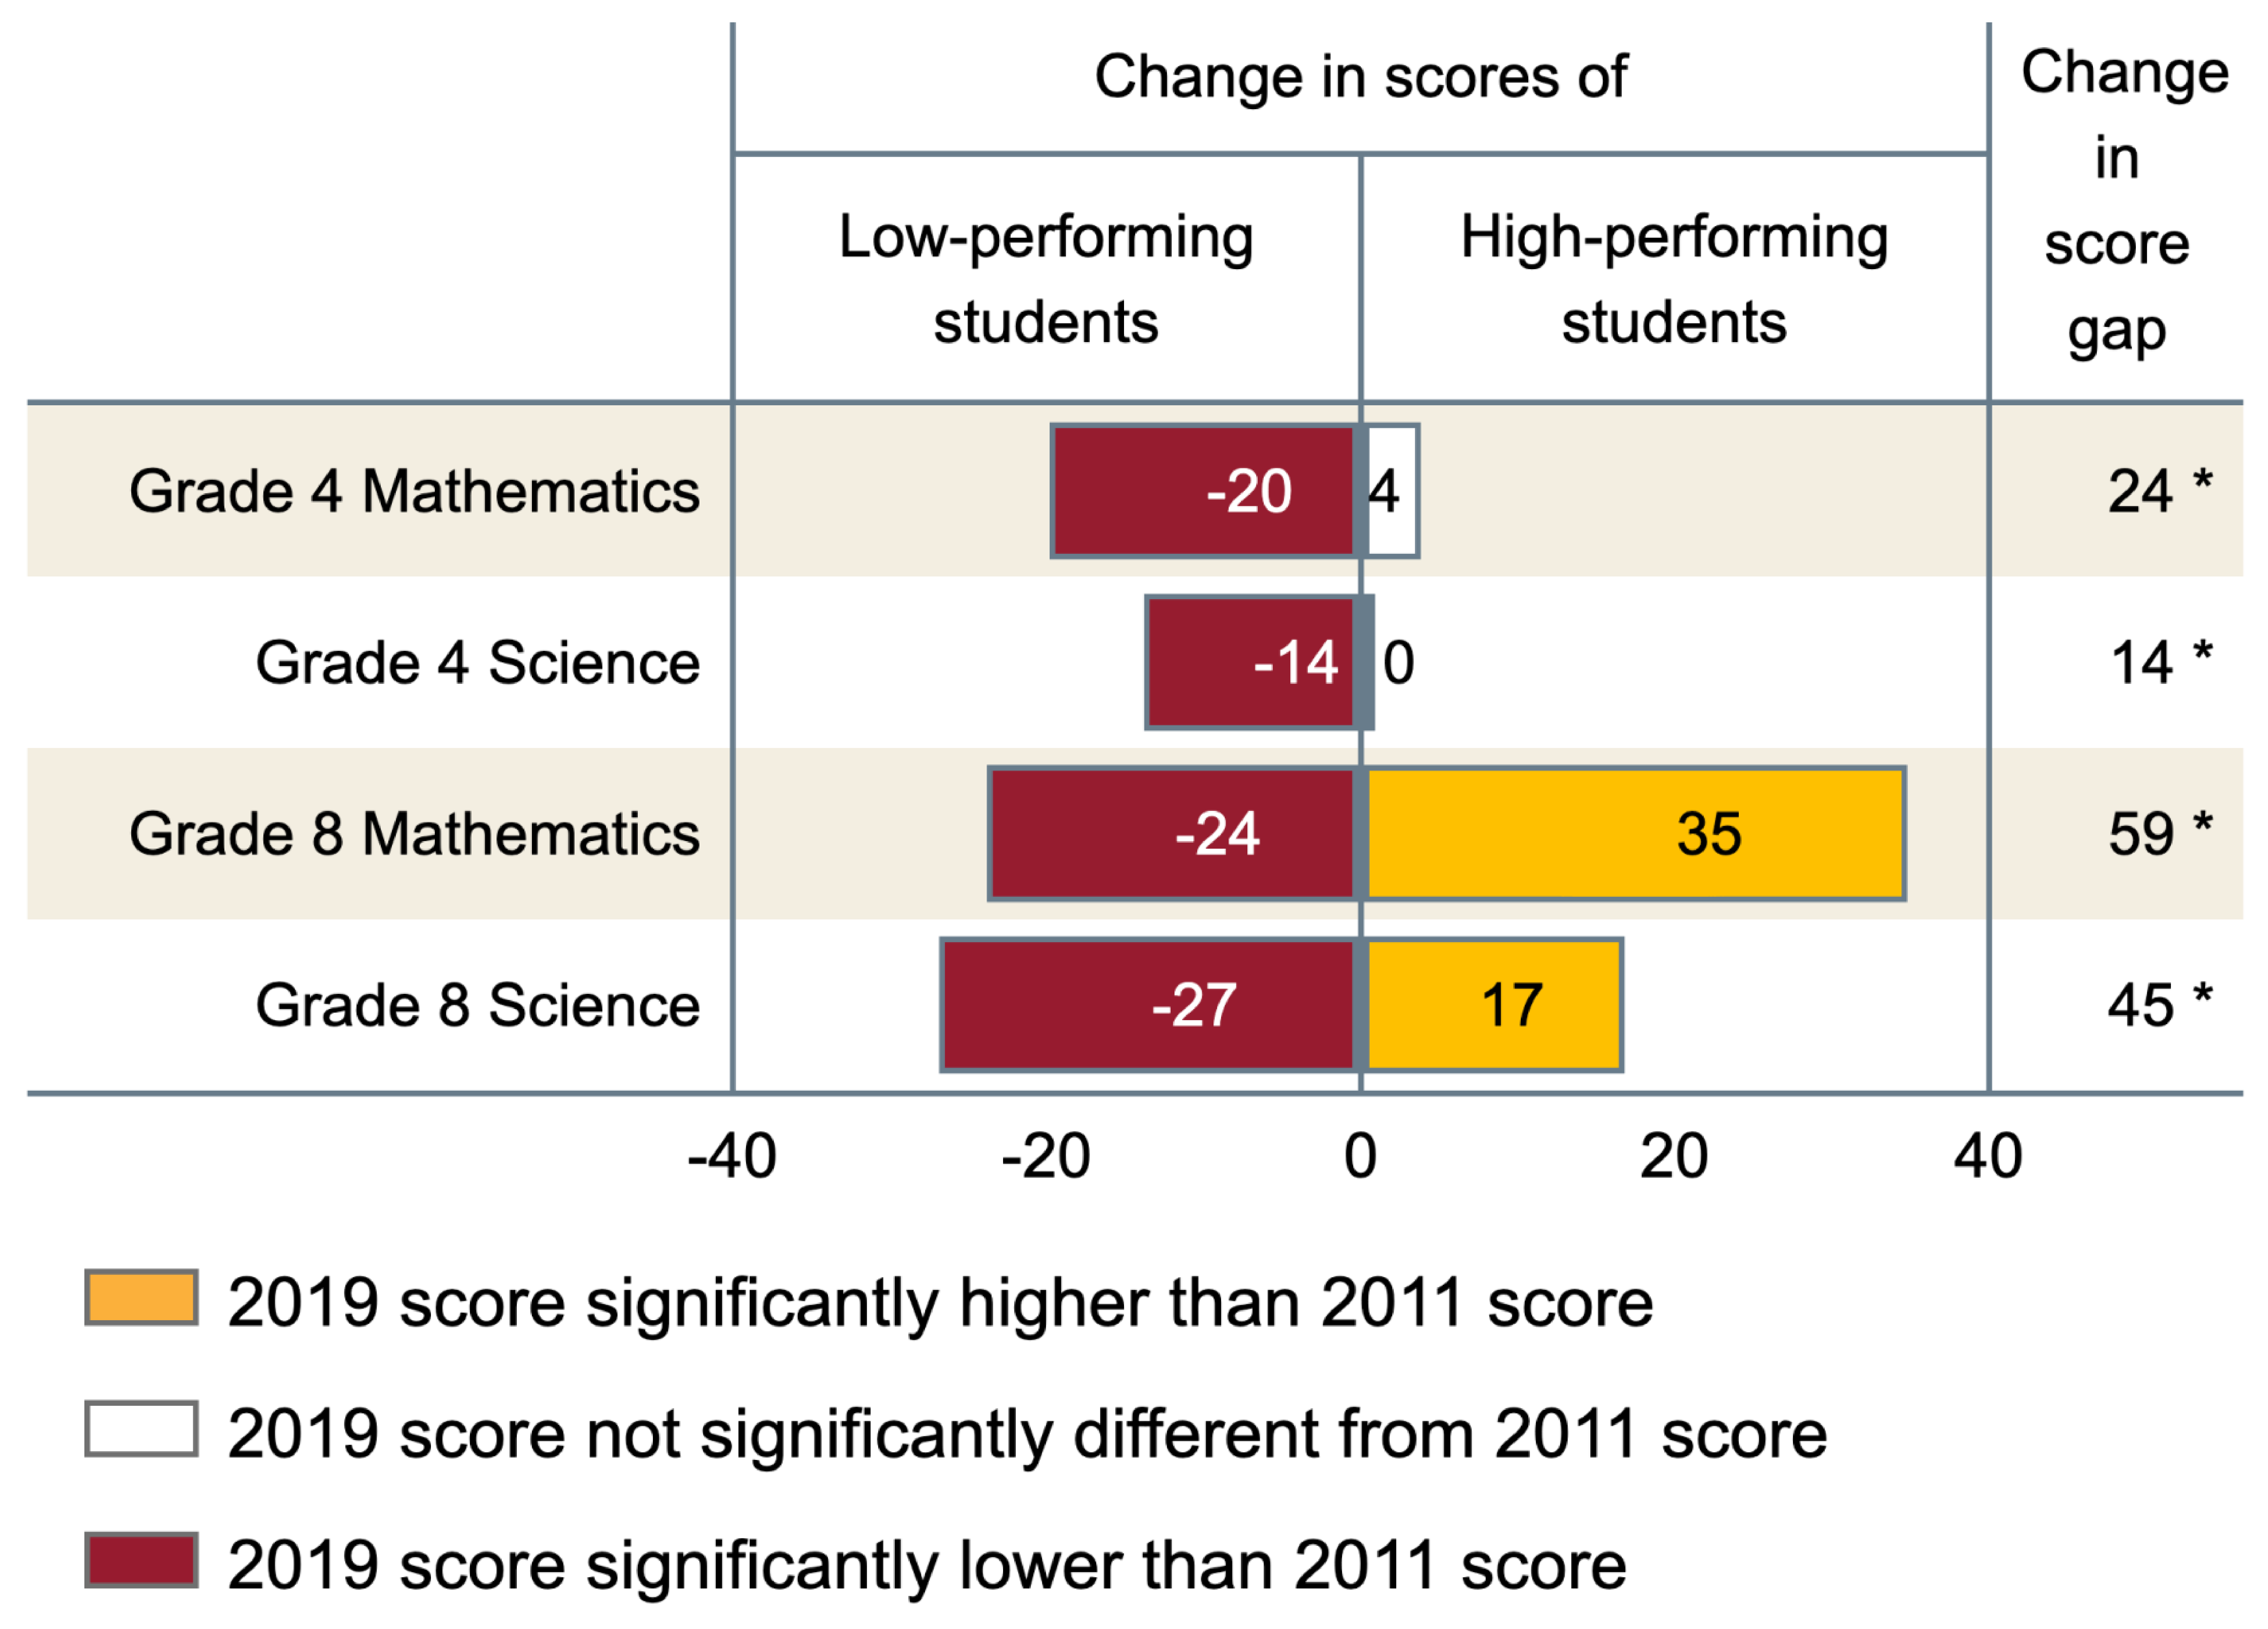
Horizontal bar chart showing changes in scores of high- and low-performing U.S. students between 2011 and 2019 and changes in the corresponding score gaps

p < .05. 2019 score gap is significantly different from 2011 score gap.

SOURCE: Stephens, M., Erberber, E., Tsokodayi, Y., and Fonseca, F. (2022). Changes Between 2011 and 2019 in Achievement Gaps Between High- and Low-Performing Students in Mathematics and Science: International Results From TIMSS (NCES 2022-041). U.S. Department of Education. Washington, DC: National Center for Education Statistics, Institute of Education Sciences. Available at https://nces.ed.gov/pubsearch/pubsinfo.asp?pubid=2022041.


Low-performing U.S. students’ scores also dropped in both subjects at grade 8, but at this grade, they were accompanied by rises in high-performing students’ scores. This pattern—where the two ends of the distribution move in opposite directions—led to the United States’ relatively large changes in score gaps. Among the other countries with widening score gaps at grade 8, this pattern of divergence was not common in mathematics but was more common in science.

In contrast, in countries where the score gaps narrowed, low-performing students’ scores generally increased. In some cases, the scores of both low- and high-performing students increased, but the scores of low-performing students increased more.

Countries with narrowing score gaps typically also saw their average scores rise between 2011 and 2019, demonstrating improvements in both equity and achievement. This was almost never the case in countries where the scores of low-performing students dropped, highlighting the global importance of not letting this group of students fall behind.  


What else can we learn from this TIMSS Stats in Brief?

In addition to providing summary results (described above), this interactive Stats in Brief allows users to select a subject and grade to explore each of the study questions further (exhibit 1). Within each selection, users can choose either a more streamlined or a more expanded view of the cross-country figures and walk through the findings step-by-step while key parts of the figures are highlighted.


Exhibit 1. Preview of the Stats in Brief’s Features
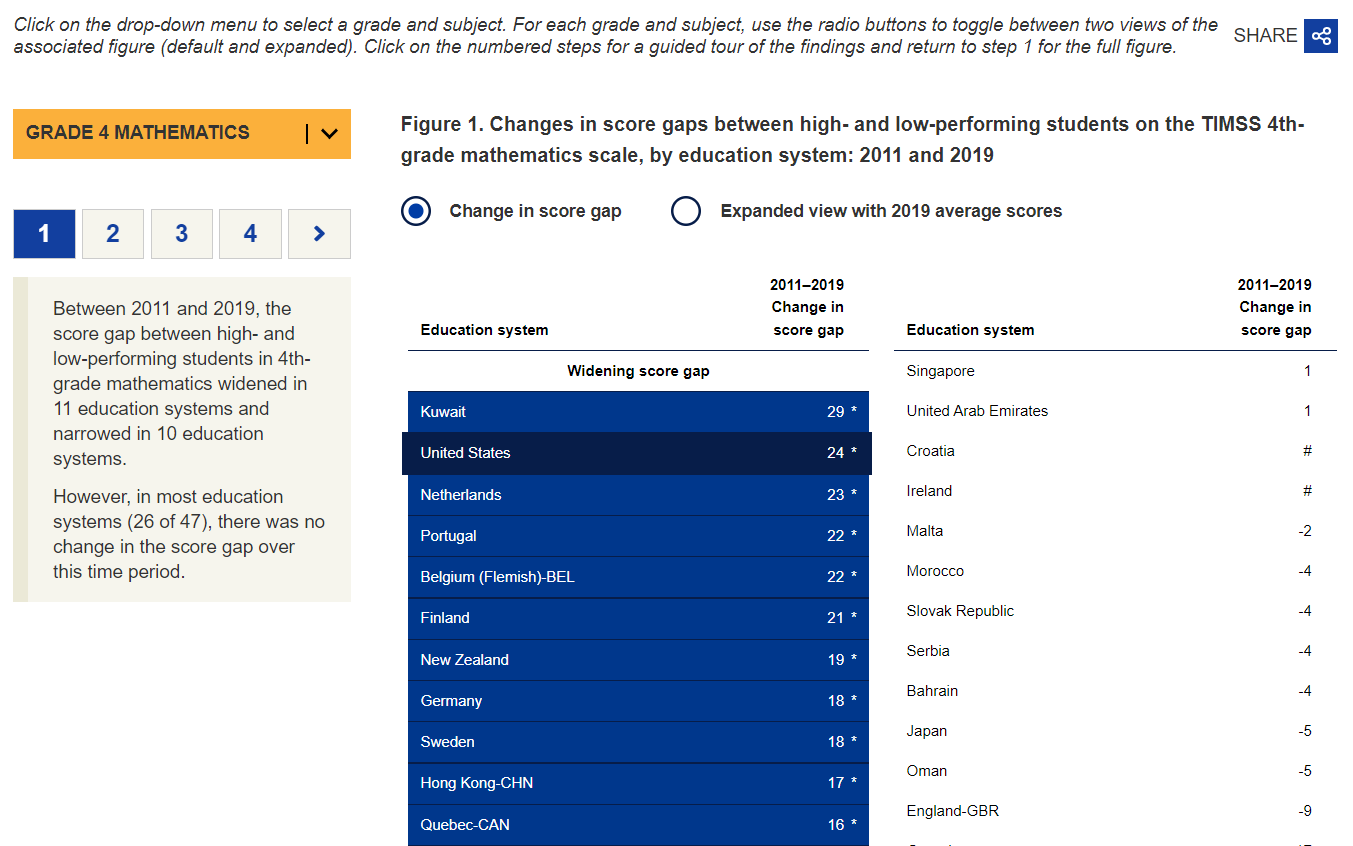
Image of the TIMSS Stats in Brief web report


Explore NCES’ new interactive TIMSS Stats in Brief to learn more about how score gaps between high- and low-performing students have changed over time across countries.

Be sure to follow NCES on TwitterFacebookLinkedIn, and YouTube and subscribe to the NCES News Flash to stay up-to-date on TIMSS data releases and resources.


By Maria Stephens and Ebru Erberber, AIR; and Lydia Malley, NCES

Announcing the Condition of Education 2022 Release

NCES is pleased to present the 2022 edition of the Condition of Education. The Condition is part of a 150-year tradition at NCES and provides historical and contextual perspectives on key measures of educational progress to Congress and the American public. This report uses data from across NCES and from other sources and is designed to help policymakers and the public monitor the latest developments and trends in U.S. education.

Cover of Report on the Condition of Education with IES logo and photos of children reading and writing

The foundation of the Condition of Education is a series of online indicators. Fifty-two of these indicators include content that has been updated this year. Each indicator provides detailed information on a unique topic, ranging from prekindergarten through postsecondary education, as well as labor force outcomes and international comparisons. In addition to the online indicator system, a synthesized overview of findings across topics is presented in the Report on the Condition of Education.

This year, we are excited to begin the rollout of interactive figures. These new interactive figures will empower users to explore the data in different ways. A selection of these indicators are highlighted here. They show various declines in enrollment that occurred during the coronavirus pandemic, from early childhood through postsecondary education. (Click the links below to explore the new interactive figures!)

  • From 2019 to 2020, enrollment rates of young children fell by 6 percentage points for 5-year-olds (from 91 to 84 percent) and by 13 percentage points for 3- to 4-year-olds (from 54 to 40 percent).
  • Public school enrollment in prekindergarten through grade 12 dropped from 50.8 million in fall 2019 to 49.4 million students in fall 2020. This 3 percent drop brought total enrollment back to 2009 levels (49.4 million), erasing a decade of steady growth.
  • At the postsecondary level, total undergraduate enrollment decreased by 9 percent from fall 2009 to fall 2020 (from 17.5 million to 15.9 million students). For male and female students, enrollment patterns exhibited similar trends between 2009 and 2019 (both decreasing by 5 percent). However, from 2019 to 2020, female enrollment fell 2 percent, while male enrollment fell 7 percent. Additionally, between 2019 and 2020, undergraduate enrollment fell 5 percent at public institutions and 2 percent at private nonprofit institutions. In contrast, undergraduate enrollment at for-profit institutions was 4 percent higher in fall 2020 than in fall 2019, marking the first positive single year change in enrollments at these institutions since 2010. Meanwhile, at the postbaccalaureate level, enrollment increased by 10 percent between fall 2009 and fall 2020 (from 2.8 million to 3.1 million students).
  • Educational attainment is associated with economic outcomes, such as employment and earnings, as well as with changes in these outcomes during the pandemic. Compared with 2010, employment rates among 25- to 34-year-olds were higher in 2021 only for those with a bachelor’s or higher degree (84 vs 86 percent). For those who had completed high school and those with some college, employment rates increased from 2010 to 2019, but these gains were reversed to 68 and 75 percent, respectively, during the coronavirus pandemic. For those who had not completed high school, the employment rate was 53 percent in 2021, which was not measurably different from 2019 or 2010.

This year’s Condition also includes two spotlight indicators. These spotlights use data from the Household Pulse Survey (HPS) to examine education during the coronavirus pandemic.

  • Homeschooled Children and Reasons for HomeschoolingThis spotlight opens with an examination of historical trends in homeschooling, using data from the National Household Education Survey (NHES). Then, using HPS, this spotlight examines the percentage of adults with students under 18 in the home who were homeschooled during the 2020–21 school year. Some 6.8 percent of adults with students in the home reported that at least one child was homeschooled in 2020–21. The percentage was higher for White adults (7.4 percent) than for Black adults (5.1 percent) and for Asian adults (3.6 percent). It was also higher for Hispanic adults (6.5 percent) than for Asian adults.
  • Impact of the Coronavirus Pandemic on Fall Plans for Postsecondary Education: This spotlight uses HPS data to examine changes in plans for fall 2021 postsecondary education made in response to the coronavirus pandemic. Among adults 18 years old and over who had household members planning to take classes in fall 2021 from a postsecondary institution, 44 percent reported that there was no change for any household member in their fall plans for postsecondary classes. This is compared with 28 percent who reported no change in plans for at least one household member one year earlier in the pandemic, for fall 2020.

The Condition also includes an At a Glance section, which allows readers to quickly make comparisons within and across indicators, as well as a Reader’s Guide, a Glossary, and a Guide to Sources that provide additional information to help place the indicators in context. In addition, each indicator references the source data tables that were used to produce that indicator. Most of these are in the Digest of Education Statistics.

In addition to publishing the Condition of Education, NCES produces a wide range of other reports and datasets designed to help inform policymakers and the public about significant trends and topics in education. More information about the latest activities and releases at NCES may be found on our website or by following us on Twitter, Facebook, and LinkedIn.


By Peggy G. Carr, NCES Commissioner