IES Blog

Institute of Education Sciences

New Report on Crime and Safety in Schools and College Campuses

Crime in the nation’s schools and college campuses has declined overall during the past two decades, according to a report released on April 17, 2019. Indicators of School Crime and Safety 2018 highlights new information on a wide array of data points, including youth opioid use, perceptions of bullying, and active shooter incidents in educational settings. The report also covers topics such as victimization, school conditions, school environment, safety and security measures at school, and criminal incidents at postsecondary institutions.

In 2017, students ages 12–18 experienced 827,000 total victimizations (i.e., theft and nonfatal violent victimization) at school and 503,800 total victimizations away from school. These figures represent a rate of 33 victimizations per 1,000 students at school, compared to 20 victimizations per 1,000 students away from school. From 1992 to 2017, the total victimization rate and rates of specific crimes—thefts, violent victimizations, and serious violent victimizations—declined for students ages 12–18, both at school and away from school.

This edition of Indicators of School Crime and Safety includes an analysis of active shooter incidents, which represent a small subset of the possible violent incidents that occur at schools. While rare, these events are of high concern to all those interested in the safety of our nation’s students. From 2000 to 2017, there were 37 active shooter incidents at elementary and secondary schools and 15 active shooter incidents at postsecondary institutions. During this period, there were 153 casualties (67 killed and 86 wounded) in active shooter incidents at elementary and secondary schools, and 143 casualties (70 killed and 73 wounded) in active shooter incidents at postsecondary institutions.

Between July 1, 2015 and June 30, 2016, the most recent period available, there were 18 homicides of school-age youth (ages 5–18) at a school out of the 1,478 homicides of school-age youth in the United States. During the same period, 3 of the 1,941 total suicides of school-age youth occurred at school.

In 2017, about 20 percent of students ages 12–18 reported being bullied at school during the school year. Between 2005 and 2017, the percentage of students who reported being bullied at school declined overall and for most of the student and school characteristics examined.


Of the students who were bullied in 2017, about 56 percent felt that those who had bullied them had the ability to influence what other students thought of them. A higher percentage of female students (62 percent) than male students (48 percent) reported that those who bullied them had the ability to influence what other students thought of them.


The new report included a special analysis that shows that the percentage of 8th-graders who reported using heroin during the past 12 months decreased from 1.4 percent in 1995 to 0.3 percent in 2017. The percentage also decreased from 1.1 to 0.2 percent for 10th-graders and from 1.1 to 0.4 percent for 12th-graders during the same period. This 0.4 percent of 12th graders reflects 15,900 students, who were recent users of heroin. The use of OxyContin and Vicodin during the past 12 months also generally decreased for 8th-, 10th-, and 12th-graders between 2005 (the first year of data collection for these survey items) and 2017.


There were also decreases for other types of substance abuse. The percentage of students in grades 9–12 who reported using alcohol at least once during the previous 30 days decreased from 47 to 30 percent between 2001 and 2017. Also, the percentage of students in grades 9–12 reporting marijuana use at least 1 time during the previous 30 days in 2017 (20 percent) was lower than the percentage for 2001 (24 percent).

Other findings – elementary and secondary schools

  • About 99 percent of students ages 12–18 reported that they observed the use of at least one of the selected safety and security measures at their schools in 2017. The three most commonly observed safety and security measures were a written code of student conduct (95 percent), a requirement that visitors sign in and wear visitor badges or stickers (90 percent), and the presence of school staff (other than security guards or assigned police officers) or other adults supervising the hallway (88 percent).
  • About 6 percent of students ages 12–18 reported being called hate-related words at school during the school year in 2017, representing a decrease from 12 percent in 2001. This percentage also decreased between 2001 and 2017 for male and female students as well as for White, Black, and Hispanic students.
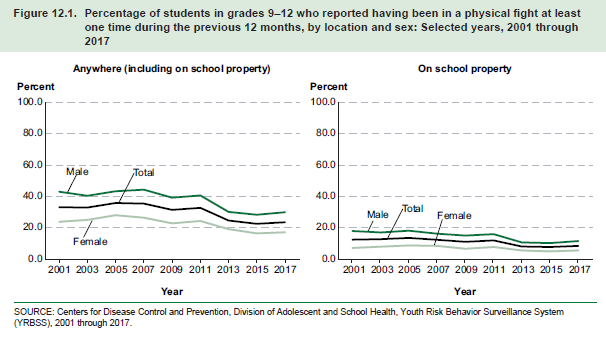
  • The percentage of students in grades 9–12 who reported having been in a physical fight anywhere in the previous 12 months decreased between 2001 and 2017 (from 33 to 24 percent), as did the percentage of students in these grades who reported having been in a physical fight on school property (from 13 to 9 percent).


Other findings – postsecondary Institutions

  • The number of on-campus crimes reported in 2016 was lower than the number reported in 2001 for every category except forcible sex offenses and negligent manslaughter offenses. The number of reported forcible sex crimes on campus increased from 2,200 in 2001 to 8,900 in 2016 (a 305 percent increase).
  • Race, religion, and sexual orientation were the categories of motivating bias most frequently associated with the 1,070 hate crimes reported on college campuses in 2016.

To view the full report, please visit https://nces.ed.gov/pubsearch/pubsinfo.asp?pubid=2019047.

International Comparisons of School Crime and Safety

By Lauren Musu-Gillette

Indicators of School Crime and Safety provides a wealth of information on the safety of schools and colleges. The report is updated annually, which allows the public to compare many data points over time in the United States. But how does crime and safety for U.S. students compare to students from other countries? This year’s report helps put some of the U.S. data in an international context by comparing it to crime and safety indicators in other countries.

For example, 15 percent of U.S. fourth-grade students reported experiencing bullying at least once a month, which was lower than the international average (16 percent).[1] This percentage was also lower than the percentages in 16 countries, higher than the percentages in 21 countries, and not measurably different from the percentages in 10 countries. Similarly, the percentage of U.S. eight-grade students who reported experiencing bullying at least once a week was lower than the international average (7 vs. 8 percent), and was lower than the percentages in 13 countries. The U.S. percentage was higher than the percentages in 16 countries, and not measurably different from the percentages in 6 countries.


Percentage of eighth-grade students who reported experiencing bullying at least once a month during the school year, by country or other education system: 2015

1 Norway collected data from students in their 9th year of schooling rather than in grade 8 because year 1 in Norway is considered the equivalent of kindergarten.
NOTE: Most of the education systems represent complete countries, but some represent subnational entities; England, for example, is part of the United Kingdom. Data are based on rounded estimates.
SOURCE: International Association for the Evaluation of Educational Achievement (IEA), Trends in International Mathematics and Science Study (TIMSS), 2015.


Data from this spotlight come from the 2015 Trends in International Mathematics and Science Study (TIMSS). The primary purpose of TIMSS is to compare the mathematics and science performances of fourth- and eighth-grade students in participating countries and education systems. In addition to assessments, TIMSS provides questionnaires to students who participate, as well as to the teachers and principals of participating students. The 2015 TIMMS questionnaire collected data on students’ reports of bullying, teachers’ reports of whether the school environment is safe and orderly, and principals’ reports of school discipline issues for students in grades 4 and 8.

In the U.S., 7 percent of participating fourth-grade students attended schools that were less than safe and orderly, according to the data reported by their teachers.[2] This was higher than the international average of 4 percent and higher than the percentages in 22 countries, while being not measurably different from the percentages in 19 countries. About 13 percent of participating U.S. eighth-grade students reported attending schools that were less than safe and orderly; higher than the international average of 8 percent and higher than the percentages in 26 countries.

About 3 percent of U.S. fourth-graders and 2 percent of U.S. eighth-graders attended schools with moderate to severe discipline problems, according to data reported by their principals.[3] These percentages were lower than the international averages for fourth-graders and eighth-graders (10 percent and 11 percent, respectively).

For more detailed information, visit the spotlight in Indicators of School Crime and Safety 2016.


[1] The bullying questionnaire item asked, “During this school year, how often have other students from your school done any of the following things to you (including through texting and the Internet)?” These behaviors were listed after the question: Made fun of me or called me names; Left me out of games or activities; Spread lies about me; Stole something from me; Hit or hurt me (e.g., shoving, hitting, kicking); Made me do things I didn’t want to do; Shared embarrassing information about me; Threatened me; and Posted embarrassing things about me online (only asked of eighth-graders).

[2] The questionnaire item was, “Thinking about your current school, indicate the extent to which you agree or disagree with each of the following statements,” and it was followed by these statements: This school is located in a safe neighborhood; I feel safe at this school; This school’s security policies and practices are sufficient; The students behave in an orderly manner; The students are respectful of the teachers; The students respect school property; This school has clear rules about student conduct; and This school’s rules are enforced in a clear and consistent manner.

[3] The questionnaire item asked, “To what degree is each of the following a problem among [fourth-grade/eighth-grade] students in your school?” These behaviors or occurrences were listed following the questionnaire item: Arriving late at school; Absenteeism (i.e., unjustified absences); Classroom disturbance; Cheating; Profanity; Vandalism; Theft; Intimidation or verbal abuse among students (including texting, emailing, etc.); Intimidation or verbal abuse of teachers or staff (including texting, emailing, etc.); Physical fights among students (only asked of fourth-grade principals); Physical injury to other students (only asked of eighth-grade principals); and Physical injury to teachers or staff (only asked of eighth-grade principals).


Bullying Down From a Decade Ago, but Unchanged Since 2013

By Lauren Musu-Gillette, Rachel Hansen, and Maura Spiegelman

Bullying prevention is a topic of perennial interest to policy makers, administrators, and educators, as well as students and their families. Data is a key component of measuring progress in a given area and NCES is committed to providing reliable and timely data on important topics such as bullying. NCES recently released a new report with data on bullying; Student Reports of Bullying and Cyber-Bullying: Results From the 2015 School Crime Supplement to the National Crime Victimization Survey.

The School Crime Supplement (SCS) to the National Crime Victimization Survey collects data on bullying by asking students ages 12–18 if they had been bullied at school during the school year. The percentage of students who reported being bullied at school during the school year decreased from 28 percent in 2005 to 21 percent in 2015. Similarly, the percentage of male students who reported being bullied at school decreased from 27 percent to 19 percent during the same time period. While the downward trend was not significant for female students, a smaller percentage reported being bullied in 2015 than in 2005 (29 vs. 23 percent). Additionally, the percentage of females who reported being bullied was higher than the percentage of males in most years that data were available (the exceptions were 2005 and 2009 when the percentages were not measurably different).  

However, as you can see in the graph below, most of the decline—overall and for males and females—occurred between 2007 and 2013. For the past two years, the percentages have been relatively unchanged.


Percentage of students, ages 12–18, who reported being bullied at school during the school year: Selected years, 2005 through 2015

SOURCE: U.S. Department of Justice, Bureau of Justice Statistics, School Crime Supplement (SCS) to the National Crime Victimization Survey, 2005 through 2015. See Digest of Education Statistics 2016, table 230.40.


In 2015, higher percentages of Black students (25 percent) and White students (22 percent) reported being bullied in comparison to Hispanic students (17 percent). A greater percentage of students in 6th grade (31 percent) reported being bullied than students in grades 8–12, where reports of bullying ranged between 15 percent and 22 percent. No measurable differences were observed in the percentage of private and public school students who reported being bullied at school.

The frequency of bullying is another factor that is measured in the SCS. In 2015, about 67 percent of students who reported being bullied at school indicated that they were bullied once or twice in the school year. About one-third (33 percent) indicated that they were bullied at least once or twice a month, with 10 percent of these students reporting being bullied once or twice a week and 4 percent reporting they were bullied every day.

Additional data from the 2015 report can be found in the tables in the report. These tables contain additional information on bullying-related topics such as types of bullying, and fear and avoidance behaviors at school.

Public school safety and discipline: New data on practices, procedures, and violent incidents at school

By Lauren Musu-Gillette and Tom Snyder

Crime and violence at school not only affects the individuals involved, but also may disrupt the educational process and affect bystanders, the school itself, and the surrounding community [1]. There are many different components to measuring students’ safety at school, and NCES conducts and supports regular surveys on school crime and safety. Our new report, Public School Safety and Discipline, 2013-14 provides data on school safety practices and procedures, and also contains school reports of school crime incidents [2].

Improvements in monitoring and communication can help to ensure students, teachers, and parents have the information they need at the right moment. There have been increases in the use of some types of technology in schools. For example, the percentage of schools that used one or more security cameras to monitor the school in 2013-14 (75 percent) was higher than it was in 2009-10 (61 percent). The percentage of schools which had an electronic notification system that automatically notifies parents in case of a school-wide emergency was also higher in 2013-14 (82 percent) than in 2009-10 (63 percent). Further, the percentage of schools which had a structured anonymous threat reporting system (e.g. online submission, telephone hotline, or written submission via dropbox) was higher in 2013-14 (47 percent) than in 2009-10 (36 percent). The percentage of schools that prohibited student use of cell phones and text messaging was lower in 2013-14 (76 percent) than in 2009-10 (91 percent).

Another indication of the level of safety at school is the percentage of schools reporting that violent incidences occurred during the school year. It is important to note that the nature of the NCES data collections on school crime do not enable cause and effect linkages between activities designed to improve school safety and actual decreases in school crime.  Overall, the percentage of public schools reporting that a violent incident occurred at school [3] was lower in 2013-14 (65 percent) than in 2009-10 (74 percent) [4]. Also, the percentage of schools reporting a serious violent crime was lower in 2013-14 (13 percent) than in 2009-10 (16 percent).  In 2013-14, there were about 16 violent crimes per 1,000 students compared to 25 per 1,000 students in 2009-10.


Percentage of public schools reporting selected discipline problems that occurred at school at least once a week: 2009-10 and 2013-14

Figure. Percentage of public schools reporting selected discipline problems that occurred at school at least once a week: 2009-10 and 2013-14
NOTE: Responses were provided by the principal or the person most knowledgeable about crime and safety issues at the school.
SOURCE: School Survey on Crime and Safety (SSOCS) 2009–10 and School Safety and Discipline 2013-14.

In addition to crimes, discipline problems at school are also of interest. Several types of discipline problems were reported at lower rates in 2013-14 than in 2009-10, including: student racial/ethnic tensions, student bullying, student sexual harassment of other students, and student harassment of other students based on sexual orientation or gender identity.  For example, 15.7 percent of schools reported that student bullying happens at least weekly in 2013-14, compared to 23.1 percent of schools in 2009-10. There were no measurable differences in the percentage of schools reporting, “widespread disorder in classrooms,” “student verbal abuse of teachers,” or “student acts of disrespect for teachers other than verbal abuse.”

In addition to this new report on school crime, NCES produces an annual summary report on school crime, Indicators of School Crime and Safety. Also, NCES has recently released a series of tabulations on bullying that showed bullying rates are lower in 2013 than they were in 2011


[1] Brookmeyer, K.A., Fanti, K.A., and Henrich, C.C. (2006). Schools, Parents, and Youth Violence: A Multilevel, Ecological Analysis. Journal of Clinical Child and Adolescent Psychology, 35(4):504–514.; Goldstein, S.E., Young, A., and Boyd, C. (2008). Relational Aggression at School: Associations With School Safety and Social Climate. Journal of Youth & Adolescence, 37: 641–654.

[2] This blog compares estimates from Public School Safety and Discipline: 2013–14 and School Survey on Crime and Safety. Respondents to the Public School Safety and Discipline: 2013-14 were offered options of completing the survey on paper or online.  The School Survey on Crime and Safety was conducted as a mail survey with telephone follow-up.  Differences in these survey methods may impact inferences.

[3] “At school” was defined as activities happening in school buildings, on school grounds, on school buses, and at places that hold school-sponsored events or activities.

[4] Respondents were asked to report the number of incidents, not number of victims or offenders.

Measuring student safety: Bullying rates at school

By Lauren Musu-Gillette, Rachel Hansen, Kathryn Chandler, and Tom Snyder

Bullying remains a serious issue for students and their families, and efforts to reduce bullying concern policy makers, administrators, and educators. Measuring the extent of the problem, as well as tracking any progress towards reducing the prevalence of bullying, is of utmost importance and why NCES is committed to providing reliable and timely data on important topics such as bullying. NCES provides additional context for understanding this issue in our schools by publishing comparative data on different student groups, as well as data on changes over time in students’ reports of being bulled at school.

The School Crime Supplement (SCS) to the National Crime Victimization Survey collects data on bullying by asking a nationally representative sample of students ages 12–18 if they had been bullied at school. In 2013, about 22 percent of students reported being bullied at school during the school year. This percentage was lower than the percentage reported in every prior survey year in which these data were collected (28 percent each in 2005, 2009, and 2011 and 32 percent in 2007).

Similarly, lower percentages of students reporting being bullied in 2013 were observed across some student characteristics. For example, in 2013 about 24 percent of female students reported being bullied at school, compared with 29 to 33 percent in prior survey years. The pattern for males was similar. The percentage of students who reported being bullied in 2013 was also lower than the percentages in all prior survey years for White and Black students. For Hispanic and Asian students, the percentage of students who reported being bullied in 2013 was lower than the percentages in both 2007 and 2009.


Percentage of students ages 12–18 who reported being bullied at school during the school year, by gender: Selected years, 2005 through 2013

This graph shows three lines representing the total percentage of students bullied at school in 2005, 2007, 2009, 2011, and 2013, as well as the percentage of males and females who report being bullied at school. The percentage goes up between 2005 and 2007 for all groups, it goes down between 2007 and 2009 for all groups, it goes up between 2009 and 2011 for all groups and it goes down between 2011 and 2013 for all groups. The line for females is higher than the total line and the line for males for all points in time. The line for males is lower than the other lines at all points in time.

NOTE: "At school" includes the school building, on school property, on a school bus, or going to and from school.

SOURCE: U.S. Department of Justice, Bureau of Justice Statistics, School Crime Supplement (SCS) to the National Crime Victimization Survey, 2005 through 2013.


In 2013, a higher percentage of females than of males ages 12–18 reported being bullied at school during the school year (24 vs. 19 percent). A higher percentage of White students (24 percent) than of Hispanic students (19 percent) and Asian students (9 percent) reported being bullied at school. In addition, higher percentages of Black students (20 percent) and Hispanic students than of Asian students reported being bullied at school. Higher percentages of students in grades 6 through 11 than of students in grade 12 reported being bullied at school during the school year. In 2013, about 14 percent of 12th-graders reported being bullied at school, compared with 28 percent of 6th-graders, 26 percent of 7th-graders, 22 percent of 8th-graders, 23 percent of 9th-graders, 19 percent of 10th-graders, and 20 percent of 11th-graders.

Additional data from the 2013 School Crime Supplement are available in the Student Reports of Bullying and Cyberbullying: Results from the 2013 School Crime Supplement to the National Victimization Survey. Tables in this report contain further information on bullying-related topics such as frequency and types of bullying, cyber-bullying, and fear and avoidance behaviors at school.

Additional information on the definition of bullying, risk factors for bullying, and bullying prevention can be found on stopbullying.gov. The Department of Education, along with other federal agencies, sponsored stopbullying.gov to provide resources on bullying to school administrators, teachers, parents, and children.