Data from two recent NCES reports—the Condition of Education and the Digest of Education Statistics—show that student homelessness is a challenge in many different types of communities.
In 2014-15, the rate of homelessness among U.S. public school students was highest in city school districts at 3.7 percent, but was also 2.0 percent or higher in suburban, town, and rural districts. While suburban districts had the lowest rate of student homelessness, they still enrolled 422,000 homeless students, second only to the 578,000 homeless students enrolled in city districts. Smaller numbers of homeless students were enrolled in rural (149,000) and town (139,000) districts.
Figure 1. Percentage of public school students who were identified as homeless, by school district locale: School year 2014–15
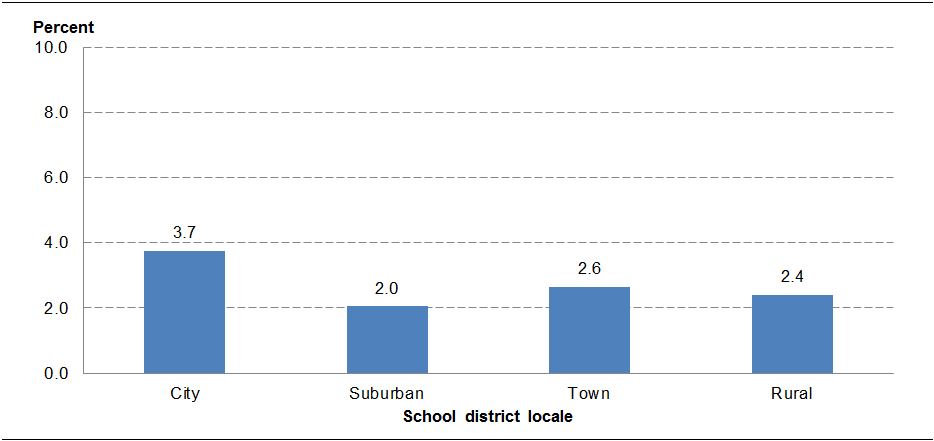
NOTE: Homeless students are defined as children/youth who lack a fixed, regular, and adequate nighttime residence. For more information, see "C118 - Homeless Students Enrolled" at https://www2.ed.gov/about/inits/ed/edfacts/sy-14-15-nonxml.html. Data include all homeless students enrolled at any time during the school year. Data exclude Puerto Rico and the Bureau of Indian Education.
SOURCE: U.S. Department of Education, National Center for Education Statistics, EDFacts file 118, Data Group 655, extracted January 23, 2017, from the EDFacts Data Warehouse (internal U.S. Department of Education source). Common Core of Data (CCD), "Local Education Agency Universe Survey," 2014–15. See Digest of Education Statistics 2016, table 204.75b.
The majority of students experiencing homelessness (76 percent) were doubled up or sharing housing with other families due to loss of their own housing, economic hardship, or other reasons such as domestic violence. Seven percent were in hotels or motels; 14 percent were in shelters, transitional housing or awaiting foster care placement; and 3 percent were unsheltered.
The percentage of homeless students who were doubled up with other families ranged from 70 percent in city districts to 81 percent in rural districts. The percentage of homeless students who were housed in shelters was higher in city districts than in suburban, town, and rural districts. The percentages of homeless students who were unsheltered or living in hotels and motels varied less widely across district locale categories.
Figure 2. Percentage distribution of public school students who were identified as homeless, by primary nighttime residence and school district locale: School year 2014–15
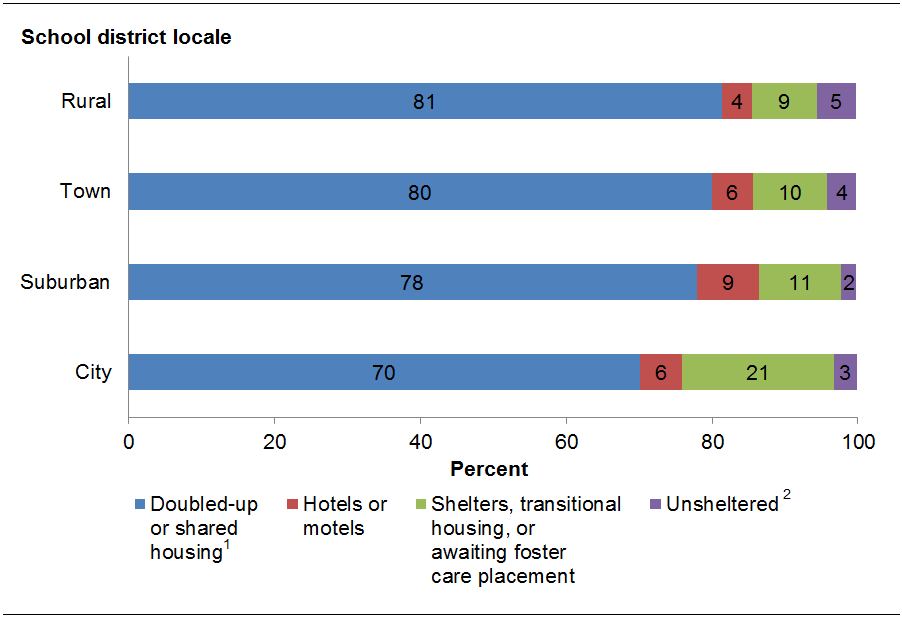
1Refers to temporarily sharing the housing of other persons due to loss of housing, economic hardship, or other reasons (such as domestic violence).
2Includes living in cars, parks, campgrounds, temporary trailers—including Federal Emergency Management Agency (FEMA) trailers—or abandoned buildings.
NOTE: Homeless students are defined as children/youth who lack a fixed, regular, and adequate nighttime residence. For more information, see "C118 - Homeless Students Enrolled" at https://www2.ed.gov/about/inits/ed/edfacts/sy-14-15-nonxml.html. Data include all homeless students enrolled at any time during the school year. Data exclude Puerto Rico and the Bureau of Indian Education. This figure is based on state-level data.
SOURCE: U.S. Department of Education, National Center for Education Statistics, EDFacts file 118, Data Group 655, extracted January 23, 2017, from the EDFacts Data Warehouse (internal U.S. Department of Education source). Common Core of Data (CCD), "Local Education Agency Universe Survey," 2014–15. See Digest of Education Statistics 2016, table 204.75b.
The percentage of homeless students who were unaccompanied youth–meaning that they were not in the physical custody of a parent or guardian—was highest in rural districts (9.3 percent) and lowest in suburban districts (6.9 percent). The percentage of homeless students who were English language learners was highest in urban districts (16.8 percent) and lowest in rural districts (5.9 percent), and the percentage who were migrant students was highest in town districts (3.4 percent) and lowest in urban districts (1.0 percent).
Data used in this analysis were collected under the McKinney-Vento Homeless Assistance Act of 1987. This legislation requires that school districts identify students experiencing homelessness and guarantees students’ right to enroll in public schools and access educational and transportation services. More information on this legislation and the U.S. Department of Education’s programs and resources focused on student homelessness can be found on the National Center for Homeless Education’s website.
States report aggregated data on homeless students to the U.S. Department of Education through the EDFacts collection. EDFacts covers all public school districts and provides a uniquely detailed view of student homelessness. The full data on student homelessness by school district locale is available in the Digest of Education Statistics. A broader analysis in the Condition of Education describes how student homelessness has changed over time and how it varies among states. You can view homeless student data for the 120 largest school districts here and download a dataset with information on all public school districts here.